
 Login Sign Up


| |||||
 |  | ||||

| 12Stocks.com Market Intelligence |
Best SmallCap Stocks
|
| In a hurry? Small Cap Stock Lists: Performance Trends Table, Stock Charts
Sort Small Cap stocks: Daily, Weekly, Year-to-Date, Market Cap & Trends. Filter Small Cap stocks list by sector: Show all, Tech, Finance, Energy, Staples, Retail, Industrial, Materials, Utilities and HealthCare Filter Small Cap stocks list by size: All Large Medium Small and MicroCap |
| 12Stocks.com Small Cap Stocks Performances & Trends Daily | |||||||||
|
|  The overall Smart Investing & Trading Score is 90 (0-bearish to 100-bullish) which puts Small Cap index in short term bullish trend. The Smart Investing & Trading Score from previous trading session is 100 and a deterioration of trend continues.
| ||||||||
Here are the Smart Investing & Trading Scores of the most requested small cap stocks at 12Stocks.com (click stock name for detailed review):
|


| 12Stocks.com: Investing in Smallcap Index with Stocks | |
|
The following table helps investors and traders sort through current performance and trends (as measured by Smart Investing & Trading Score) of various
stocks in the Smallcap Index. Quick View: Move mouse or cursor over stock symbol (ticker) to view short-term technical chart and over stock name to view long term chart. Click on  to add stock symbol to your watchlist and to add stock symbol to your watchlist and  to view watchlist. Click on any ticker or stock name for detailed market intelligence report for that stock. to view watchlist. Click on any ticker or stock name for detailed market intelligence report for that stock. |
12Stocks.com Performance of Stocks in Smallcap Index
| Ticker | Stock Name | Watchlist | Category | Recent Price | Smart Investing & Trading Score | Change % | Weekly Change% |
| UCBI | United Community |   | Financials | 74.00 | 80 | -0.07% | 163.44% |
| DM | Dominion Midstream | | Energy | 4.96 | 70 | 1.02% | 118.50% |
| KAMN | Kaman | | Industrials | 68.05 | 70 | -0.77% | 48.35% |
| UNFI | United Natural | | Consumer Staples | 40.53 | 100 | 1.22% | 34.25% |
| PCVX | Vaxcyte | | Health Care | 42.66 | 100 | 6.30% | 32.73% |
| BE | Bloom Energy | | Industrials | 90.29 | 100 | 2.60% | 31.45% |
| BTU | Peabody Energy | | Energy | 32.00 | 100 | 9.18% | 30.40% |
| PL | Planet Labs | | Industrials | 15.31 | 100 | 3.10% | 28.01% |
| CIFR | Cipher Mining | | Financials | 14.69 | 100 | 6.34% | 25.94% |
| NG | Novagold Resources | | Materials | 9.99 | 100 | 3.52% | 25.82% |
| AVAV | AeroVironment | | Industrials | 374.62 | 100 | 3.98% | 24.13% |
| ACHR | Archer Aviation | | Industrials | 11.57 | 100 | 13.65% | 24.01% |
| NUVB | Nuvation Bio | | Health Care | 3.71 | 100 | 0.00% | 23.26% |
| INOD | Innodata | | Technology | 84.10 | 90 | -3.79% | 22.56% |
| GSAT | Globalstar | | Technology | 42.13 | 100 | 4.62% | 21.59% |
| ALVR | AlloVir | | Health Care | 11.47 | 100 | 16.92% | 20.86% |
| RKLB | Rocket Lab | | Industrials | 56.15 | 100 | 7.01% | 20.42% |
| NTLA | Intellia | | Health Care | 19.96 | 90 | -2.35% | 20.17% |
| NVTS | Navitas Semiconductor | | Technology | 7.82 | 90 | -4.58% | 20.12% |
| EOSE | Eos Energy | | Industrials | 12.59 | 90 | 1.78% | 20.02% |
| RDW | Redwire | | Industrials | 10.73 | 80 | 3.57% | 19.75% |
| OSCR | Oscar Health | | Health Care | 21.66 | 100 | 12.34% | 19.73% |
| CYTK | Cytokinetics | | Health Care | 56.97 | 100 | 1.15% | 19.11% |
| ARQT | Arcutis Bio | | Health Care | 19.88 | 90 | -6.45% | 18.83% |
| COGT | Cogent Biosciences | | Health Care | 15.75 | 100 | 6.78% | 18.51% |
| For chart view version of above stock list: Chart View ➞ 0 - 25 , 25 - 50 , 50 - 75 , 75 - 100 , 100 - 125 , 125 - 150 , 150 - 175 , 175 - 200 , 200 - 225 , 225 - 250 , 250 - 275 , 275 - 300 , 300 - 325 , 325 - 350 , 350 - 375 , 375 - 400 , 400 - 425 , 425 - 450 , 450 - 475 , 475 - 500 , 500 - 525 , 525 - 550 , 550 - 575 , 575 - 600 , 600 - 625 , 625 - 650 , 650 - 675 , 675 - 700 , 700 - 725 , 725 - 750 , 750 - 775 , 775 - 800 , 800 - 825 , 825 - 850 , 850 - 875 | ||
 | Click To Change The Sort Order: By Market Cap or Company Size Performance: Year-to-date, Week and Day |  |
| Too many stocks? View smallcap stocks filtered by marketcap & sector |
| Marketcap: All SmallCap Stocks (default-no microcap), Large, Mid-Range, Small |
| Smallcap Sector: Tech, Finance, Energy, Staples, Retail, Industrial, Materials, & Medical |
|
Get the most comprehensive stock market coverage daily at 12Stocks.com ➞ Best Stocks Today ➞ Best Stocks Weekly ➞ Best Stocks Year-to-Date ➞ Best Stocks Trends ➞  Best Stocks Today 12Stocks.com Best Nasdaq Stocks ➞ Best S&P 500 Stocks ➞ Best Tech Stocks ➞ Best Biotech Stocks ➞ |
| Detailed Overview of SmallCap Stocks |
| SmallCap Technical Overview, Leaders & Laggards, Top SmallCap ETF Funds & Detailed SmallCap Stocks List, Charts, Trends & More |
| Smallcap: Technical Analysis, Trends & YTD Performance | |
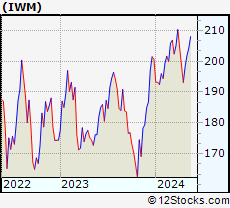
| SmallCap segment as represented by
IWM, an exchange-traded fund [ETF], holds basket of thousands of smallcap stocks from across all major sectors of the US stock market. The smallcap index (contains stocks like Riverbed & Sotheby's) is up by 11.7226% and is currently underperforming the overall market by -3.0979% year-to-date. Below is a quick view of technical charts and trends: | |
 IWM Weekly Chart |
|
| Long Term Trend: Very Good | |
| Medium Term Trend: Good | |
 IWM Daily Chart |
|
| Short Term Trend: Very Good | |
| Overall Trend Score: 90 | |
| YTD Performance: 11.7226% | |
| **Trend Scores & Views Are Only For Educational Purposes And Not For Investing | |
| 12Stocks.com: Top Performing Small Cap Index Stocks | ||||||||||||||||||||||||||||||||||||||||||||||||
 The top performing Small Cap Index stocks year to date are
Now, more recently, over last week, the top performing Small Cap Index stocks on the move are


|
||||||||||||||||||||||||||||||||||||||||||||||||
| 12Stocks.com: Investing in Smallcap Index using Exchange Traded Funds | |
|
The following table shows list of key exchange traded funds (ETF) that
help investors track Smallcap index. The following list also includes leveraged ETF funds that track twice or thrice the daily returns of Smallcap indices. Short or inverse ETF funds move in the opposite direction to the index they track and are useful during market pullbacks or during bear markets. Quick View: Move mouse or cursor over ETF symbol (ticker) to view short-term technical chart and over ETF name to view long term chart. Click on ticker or stock name for detailed view. Click on to add stock symbol to your watchlist and to view watchlist. |
12Stocks.com List of ETFs that track Smallcap Index
| Ticker | ETF Name | Watchlist | Recent Price | Smart Investing & Trading Score | Change % | Week % | Year-to-date % |
| IWM | iShares Russell 2000 ETF | | 245.83 | 90 | 0.741742 | 2.73309 | 11.7226% |
| IJR | iShares Core S&P Small-Cap ETF | | 120.08 | 90 | 0.451732 | 2.36126 | 5.14702% |
| VTWO | Vanguard Russell 2000 Index ETF | | 99.37 | 90 | 0.760495 | 2.6974 | 11.8093% |
| IWO | iShares Russell 2000 Growth ETF | | 325.46 | 90 | 0.605873 | 2.95457 | 12.9885% |
| IWN | iShares Russell 2000 Value ETF | | 179.44 | 90 | 0.78634 | 2.47858 | 10.3187% |
| IJS | iShares S&P Small-Cap 600 Value ETF | | 112.35 | 80 | 0.663023 | 3.11123 | 4.73083% |
| IJT | iShares S&P Small-Cap 600 Growth ETF | | 142.41 | 90 | 0.225209 | 1.7505 | 5.48811% |
| XSLV | Invesco S&P SmallCap Low Volatility ETF | | 46.28 | 50 | 0.333433 | 0.28169 | -0.600307% |
| SAA | ProShares Ultra SmallCap600 2x Shares | | 26.29 | 80 | 1.63024 | 5.37094 | 1.8906% |
| SDD | ProShares UltraShort SmallCap600 -2x Shares | | 12.82 | 10 | -1.27905 | -2.83607 | -15.2401% |
| SMLV | SPDR SSGA US Small Cap Low Volatility Index ETF | | 129.94 | 60 | 0.525298 | 0.541632 | 4.21465% |
| SBB | ProShares Short SmallCap600 -1x Shares | | 13.69 | 10 | -0.916688 | -2.59744 | -5.21974% |
| 12Stocks.com: Charts, Trends, Fundamental Data and Performances of SmallCap Stocks | |
|
We now take in-depth look at all SmallCap stocks including charts, multi-period performances and overall trends (as measured by Smart Investing & Trading Score). One can sort SmallCap stocks (click link to choose) by Daily, Weekly and by Year-to-Date performances. Also, one can sort by size of the company or by market capitalization. |
| Select Your Default Chart Type: | |||||
| |||||
| Click on stock symbol or name for detailed view. Click on to add stock symbol to your watchlist and to view watchlist. Quick View: Move mouse or cursor over "Daily" to quickly view daily technical stock chart and over "Weekly" to view weekly technical stock chart. | |||||

 | UCBI United Community Banks, Inc. |
| Sector: Financials | |
| SubSector: Regional - Mid-Atlantic Banks | |
| MarketCap: 1593.99 Millions | |
| Recent Price: 74.00 Smart Investing & Trading Score: 80 | |
| Day Percent Change: -0.0675219% Day Change: -9999 | |
| Week Change: 163.439% Year-to-date Change: 0.0% | |
| UCBI Links: Profile News Message Board | |
| Charts:- Daily , Weekly | |
| Add UCBI to Watchlist: View: Get Complete UCBI Trend Analysis ➞ | |
 | DM Dominion Midstream Partners, LP |
| Sector: Energy | |
| SubSector: Oil & Gas Pipelines | |
| MarketCap: 3017.01 Millions | |
| Recent Price: 4.96 Smart Investing & Trading Score: 70 | |
| Day Percent Change: 1.01833% Day Change: -9999 | |
| Week Change: 118.502% Year-to-date Change: 84.4% | |
| DM Links: Profile News Message Board | |
| Charts:- Daily , Weekly | |
| Add DM to Watchlist: View: Get Complete DM Trend Analysis ➞ | |
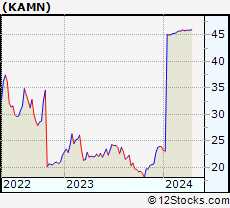 | KAMN Kaman Corporation |
| Sector: Industrials | |
| SubSector: Aerospace/Defense Products & Services | |
| MarketCap: 1154.01 Millions | |
| Recent Price: 68.05 Smart Investing & Trading Score: 70 | |
| Day Percent Change: -0.77282% Day Change: -9999 | |
| Week Change: 48.354% Year-to-date Change: 0.0% | |
| KAMN Links: Profile News Message Board | |
| Charts:- Daily , Weekly | |
| Add KAMN to Watchlist: View: Get Complete KAMN Trend Analysis ➞ | |
 | UNFI United Natural Foods Inc |
| Sector: Consumer Staples | |
| SubSector: Food Distribution | |
| MarketCap: 1753.37 Millions | |
| Recent Price: 40.53 Smart Investing & Trading Score: 100 | |
| Day Percent Change: 1.22378% Day Change: -0.32 | |
| Week Change: 34.2498% Year-to-date Change: 46.9% | |
| UNFI Links: Profile News Message Board | |
| Charts:- Daily , Weekly | |
| Add UNFI to Watchlist: View: Get Complete UNFI Trend Analysis ➞ | |
 | PCVX Vaxcyte Inc |
| Sector: Health Care | |
| SubSector: Biotechnology | |
| MarketCap: 4286.77 Millions | |
| Recent Price: 42.66 Smart Investing & Trading Score: 100 | |
| Day Percent Change: 6.30451% Day Change: 0.65 | |
| Week Change: 32.7318% Year-to-date Change: -48.8% | |
| PCVX Links: Profile News Message Board | |
| Charts:- Daily , Weekly | |
| Add PCVX to Watchlist: View: Get Complete PCVX Trend Analysis ➞ | |
 | BE Bloom Energy Corp |
| Sector: Industrials | |
| SubSector: Electrical Equipment & Parts | |
| MarketCap: 13354.3 Millions | |
| Recent Price: 90.29 Smart Investing & Trading Score: 100 | |
| Day Percent Change: 2.60227% Day Change: 0.32 | |
| Week Change: 31.4456% Year-to-date Change: 286.4% | |
| BE Links: Profile News Message Board | |
| Charts:- Daily , Weekly | |
| Add BE to Watchlist: View: Get Complete BE Trend Analysis ➞ | |
 | BTU Peabody Energy Corp |
| Sector: Energy | |
| SubSector: Thermal Coal | |
| MarketCap: 2326.21 Millions | |
| Recent Price: 32.00 Smart Investing & Trading Score: 100 | |
| Day Percent Change: 9.17776% Day Change: 0.02 | |
| Week Change: 30.3993% Year-to-date Change: 54.9% | |
| BTU Links: Profile News Message Board | |
| Charts:- Daily , Weekly | |
| Add BTU to Watchlist: View: Get Complete BTU Trend Analysis ➞ | |
 | PL Planet Labs PBC |
| Sector: Industrials | |
| SubSector: Aerospace & Defense | |
| MarketCap: 1981.4 Millions | |
| Recent Price: 15.31 Smart Investing & Trading Score: 100 | |
| Day Percent Change: 3.09764% Day Change: 0.05 | |
| Week Change: 28.01% Year-to-date Change: 285.6% | |
| PL Links: Profile News Message Board | |
| Charts:- Daily , Weekly | |
| Add PL to Watchlist: View: Get Complete PL Trend Analysis ➞ | |
 | CIFR Cipher Mining Inc |
| Sector: Financials | |
| SubSector: Capital Markets | |
| MarketCap: 2957.49 Millions | |
| Recent Price: 14.69 Smart Investing & Trading Score: 100 | |
| Day Percent Change: 6.33599% Day Change: -0.05 | |
| Week Change: 25.9434% Year-to-date Change: 204.0% | |
| CIFR Links: Profile News Message Board | |
| Charts:- Daily , Weekly | |
| Add CIFR to Watchlist: View: Get Complete CIFR Trend Analysis ➞ | |
 | NG Novagold Resources Inc |
| Sector: Materials | |
| SubSector: Gold | |
| MarketCap: 2750.64 Millions | |
| Recent Price: 9.99 Smart Investing & Trading Score: 100 | |
| Day Percent Change: 3.52332% Day Change: 0.03 | |
| Week Change: 25.8186% Year-to-date Change: 191.3% | |
| NG Links: Profile News Message Board | |
| Charts:- Daily , Weekly | |
| Add NG to Watchlist: View: Get Complete NG Trend Analysis ➞ | |
 | AVAV AeroVironment Inc |
| Sector: Industrials | |
| SubSector: Aerospace & Defense | |
| MarketCap: 11288.7 Millions | |
| Recent Price: 374.62 Smart Investing & Trading Score: 100 | |
| Day Percent Change: 3.98024% Day Change: 2.83 | |
| Week Change: 24.1327% Year-to-date Change: 139.5% | |
| AVAV Links: Profile News Message Board | |
| Charts:- Daily , Weekly | |
| Add AVAV to Watchlist: View: Get Complete AVAV Trend Analysis ➞ | |
 | ACHR Archer Aviation Inc |
| Sector: Industrials | |
| SubSector: Aerospace & Defense | |
| MarketCap: 5482.72 Millions | |
| Recent Price: 11.57 Smart Investing & Trading Score: 100 | |
| Day Percent Change: 13.6542% Day Change: 0.15 | |
| Week Change: 24.0086% Year-to-date Change: 20.9% | |
| ACHR Links: Profile News Message Board | |
| Charts:- Daily , Weekly | |
| Add ACHR to Watchlist: View: Get Complete ACHR Trend Analysis ➞ | |
 | NUVB Nuvation Bio Inc |
| Sector: Health Care | |
| SubSector: Biotechnology | |
| MarketCap: 1338.76 Millions | |
| Recent Price: 3.71 Smart Investing & Trading Score: 100 | |
| Day Percent Change: 0% Day Change: 0.03 | |
| Week Change: 23.2558% Year-to-date Change: 43.2% | |
| NUVB Links: Profile News Message Board | |
| Charts:- Daily , Weekly | |
| Add NUVB to Watchlist: View: Get Complete NUVB Trend Analysis ➞ | |
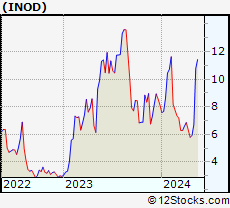 | INOD Innodata Inc |
| Sector: Technology | |
| SubSector: Information Technology Services | |
| MarketCap: 1384.65 Millions | |
| Recent Price: 84.10 Smart Investing & Trading Score: 90 | |
| Day Percent Change: -3.78675% Day Change: -0.53 | |
| Week Change: 22.559% Year-to-date Change: 112.9% | |
| INOD Links: Profile News Message Board | |
| Charts:- Daily , Weekly | |
| Add INOD to Watchlist: View: Get Complete INOD Trend Analysis ➞ | |
 | GSAT Globalstar Inc |
| Sector: Technology | |
| SubSector: Telecom Services | |
| MarketCap: 3955.99 Millions | |
| Recent Price: 42.13 Smart Investing & Trading Score: 100 | |
| Day Percent Change: 4.61882% Day Change: 0.79 | |
| Week Change: 21.5873% Year-to-date Change: 32.5% | |
| GSAT Links: Profile News Message Board | |
| Charts:- Daily , Weekly | |
| Add GSAT to Watchlist: View: Get Complete GSAT Trend Analysis ➞ | |
 | ALVR AlloVir, Inc. |
| Sector: Health Care | |
| SubSector: Biotechnology | |
| MarketCap: 25787 Millions | |
| Recent Price: 11.47 Smart Investing & Trading Score: 100 | |
| Day Percent Change: 16.9215% Day Change: -9999 | |
| Week Change: 20.8641% Year-to-date Change: 10.8% | |
| ALVR Links: Profile News Message Board | |
| Charts:- Daily , Weekly | |
| Add ALVR to Watchlist: View: Get Complete ALVR Trend Analysis ➞ | |
 | RKLB Rocket Lab Corp |
| Sector: Industrials | |
| SubSector: Aerospace & Defense | |
| MarketCap: 22113.8 Millions | |
| Recent Price: 56.15 Smart Investing & Trading Score: 100 | |
| Day Percent Change: 7.01353% Day Change: 0.84 | |
| Week Change: 20.416% Year-to-date Change: 125.0% | |
| RKLB Links: Profile News Message Board | |
| Charts:- Daily , Weekly | |
| Add RKLB to Watchlist: View: Get Complete RKLB Trend Analysis ➞ | |
 | NTLA Intellia Therapeutics Inc |
| Sector: Health Care | |
| SubSector: Biotechnology | |
| MarketCap: 1294.6 Millions | |
| Recent Price: 19.96 Smart Investing & Trading Score: 90 | |
| Day Percent Change: -2.34834% Day Change: -0.09 | |
| Week Change: 20.1686% Year-to-date Change: 63.3% | |
| NTLA Links: Profile News Message Board | |
| Charts:- Daily , Weekly | |
| Add NTLA to Watchlist: View: Get Complete NTLA Trend Analysis ➞ | |
 | NVTS Navitas Semiconductor Corp |
| Sector: Technology | |
| SubSector: Semiconductors | |
| MarketCap: 1193.4 Millions | |
| Recent Price: 7.82 Smart Investing & Trading Score: 90 | |
| Day Percent Change: -4.57596% Day Change: -0.04 | |
| Week Change: 20.1229% Year-to-date Change: 124.1% | |
| NVTS Links: Profile News Message Board | |
| Charts:- Daily , Weekly | |
| Add NVTS to Watchlist: View: Get Complete NVTS Trend Analysis ➞ | |
 | EOSE Eos Energy Enterprises Inc |
| Sector: Industrials | |
| SubSector: Electrical Equipment & Parts | |
| MarketCap: 2013.15 Millions | |
| Recent Price: 12.59 Smart Investing & Trading Score: 90 | |
| Day Percent Change: 1.7785% Day Change: 0.03 | |
| Week Change: 20.0191% Year-to-date Change: 127.7% | |
| EOSE Links: Profile News Message Board | |
| Charts:- Daily , Weekly | |
| Add EOSE to Watchlist: View: Get Complete EOSE Trend Analysis ➞ | |
 | RDW Redwire Corporation |
| Sector: Industrials | |
| SubSector: Aerospace & Defense | |
| MarketCap: 1198.41 Millions | |
| Recent Price: 10.73 Smart Investing & Trading Score: 80 | |
| Day Percent Change: 3.57143% Day Change: 0 | |
| Week Change: 19.7545% Year-to-date Change: -37.0% | |
| RDW Links: Profile News Message Board | |
| Charts:- Daily , Weekly | |
| Add RDW to Watchlist: View: Get Complete RDW Trend Analysis ➞ | |
 | OSCR Oscar Health Inc |
| Sector: Health Care | |
| SubSector: Healthcare Plans | |
| MarketCap: 5023.79 Millions | |
| Recent Price: 21.66 Smart Investing & Trading Score: 100 | |
| Day Percent Change: 12.3444% Day Change: 0.15 | |
| Week Change: 19.7347% Year-to-date Change: 59.9% | |
| OSCR Links: Profile News Message Board | |
| Charts:- Daily , Weekly | |
| Add OSCR to Watchlist: View: Get Complete OSCR Trend Analysis ➞ | |
 | CYTK Cytokinetics Inc |
| Sector: Health Care | |
| SubSector: Biotechnology | |
| MarketCap: 6343.03 Millions | |
| Recent Price: 56.97 Smart Investing & Trading Score: 100 | |
| Day Percent Change: 1.15412% Day Change: 0.73 | |
| Week Change: 19.1093% Year-to-date Change: 16.4% | |
| CYTK Links: Profile News Message Board | |
| Charts:- Daily , Weekly | |
| Add CYTK to Watchlist: View: Get Complete CYTK Trend Analysis ➞ | |
 | ARQT Arcutis Biotherapeutics Inc |
| Sector: Health Care | |
| SubSector: Biotechnology | |
| MarketCap: 2056.37 Millions | |
| Recent Price: 19.88 Smart Investing & Trading Score: 90 | |
| Day Percent Change: -6.44706% Day Change: 0 | |
| Week Change: 18.8285% Year-to-date Change: 36.5% | |
| ARQT Links: Profile News Message Board | |
| Charts:- Daily , Weekly | |
| Add ARQT to Watchlist: View: Get Complete ARQT Trend Analysis ➞ | |
 | COGT Cogent Biosciences Inc |
| Sector: Health Care | |
| SubSector: Biotechnology | |
| MarketCap: 1823.1 Millions | |
| Recent Price: 15.75 Smart Investing & Trading Score: 100 | |
| Day Percent Change: 6.77966% Day Change: -0.09 | |
| Week Change: 18.5102% Year-to-date Change: 101.9% | |
| COGT Links: Profile News Message Board | |
| Charts:- Daily , Weekly | |
| Add COGT to Watchlist: View: Get Complete COGT Trend Analysis ➞ | |
| For tabular summary view of above stock list: Summary View ➞ 0 - 25 , 25 - 50 , 50 - 75 , 75 - 100 , 100 - 125 , 125 - 150 , 150 - 175 , 175 - 200 , 200 - 225 , 225 - 250 , 250 - 275 , 275 - 300 , 300 - 325 , 325 - 350 , 350 - 375 , 375 - 400 , 400 - 425 , 425 - 450 , 450 - 475 , 475 - 500 , 500 - 525 , 525 - 550 , 550 - 575 , 575 - 600 , 600 - 625 , 625 - 650 , 650 - 675 , 675 - 700 , 700 - 725 , 725 - 750 , 750 - 775 , 775 - 800 , 800 - 825 , 825 - 850 , 850 - 875 | ||
| Click To Change The Sort Order: By Market Cap or Company Size Performance: Year-to-date, Week and Day | |
| Select Chart Type: | ||
| Too many stocks? View smallcap stocks filtered by marketcap & sector |
| Marketcap: All SmallCap Stocks (default-no microcap), Large, Mid-Range, Small & MicroCap |
| Sector: Tech, Finance, Energy, Staples, Retail, Industrial, Materials, Utilities & Medical |
|
Best Stocks Today 12Stocks.com |
© 2025 12Stocks.com Terms & Conditions Privacy Contact Us
All Information Provided Only For Education And Not To Be Used For Investing or Trading. See Terms & Conditions


One More Thing ... Get Best Stocks Delivered Daily!
Never Ever Miss A Move With Our Top Ten Stocks Lists
Find Best Stocks In Any Market - Bull or Bear Market
Take A Peek At Our Top Ten Stocks Lists: Daily, Weekly, Year-to-Date & Top Trends
Find Best Stocks In Any Market - Bull or Bear Market
Take A Peek At Our Top Ten Stocks Lists: Daily, Weekly, Year-to-Date & Top Trends
Smallcap Stocks With Best Up Trends [0-bearish to 100-bullish]: Montauk Renewables[100], Butterfly [100], SES AI[100], Fuelcell Energy[100], AlloVir [100], Cara [100], Archer Aviation[100], Erasca [100], Blink Charging[100], Alx Oncology[100], LSB Industries[100]
Best Smallcap Stocks Year-to-Date:
ThredUp [569.504%], Eagle [495.238%], FiscalNote [396.154%], Centrus Energy[363.862%], Global Medical[353.432%], 908 Devices[314.384%], Bloom Energy[286.35%], Planet Labs[285.642%], Celcuity [284.692%], Kratos Defense[264.556%], Digital Turbine[260.227%] Best Smallcap Stocks This Week:
Textainer Group[258.475%], United Community[163.439%], Lakeland Bancorp[147.684%], ClearPoint Neuro[125.164%], Dominion Midstream[118.502%], Bakkt [116.747%], PDL BioPharma[112.645%], GTx [108.706%], Overseas Shipholding[77.0318%], PGT Innovations[65.2536%], Eyenovia [50.3665%] Best Smallcap Stocks Daily:
Vicarious Surgical[27.2072%], Montauk Renewables[22.7723%], Butterfly [18.8776%], SES AI[17.7143%], Fuelcell Energy[17.6267%], Sportsman's Warehouse[17.0732%], Humacyte [17.0391%], AlloVir [16.9215%], Cara [14.3396%], Stratus Properties[13.899%], Zura Bio[13.71%]