
 Login Sign Up


| |||||
 |  | ||||

| 12Stocks.com Market Intelligence |
Best SmallCap Stocks
|
| In a hurry? Small Cap Stock Lists: Performance Trends Table, Stock Charts
Sort Small Cap stocks: Daily, Weekly, Year-to-Date, Market Cap & Trends. Filter Small Cap stocks list by sector: Show all, Tech, Finance, Energy, Staples, Retail, Industrial, Materials, Utilities and HealthCare Filter Small Cap stocks list by size: All Large Medium Small and MicroCap |
| 12Stocks.com Small Cap Stocks Performances & Trends Daily | |||||||||
|
|  The overall Smart Investing & Trading Score is 80 (0-bearish to 100-bullish) which puts Small Cap index in short term neutral to bullish trend. The Smart Investing & Trading Score from previous trading session is 100 and hence a deterioration of trend.
| ||||||||
Here are the Smart Investing & Trading Scores of the most requested small cap stocks at 12Stocks.com (click stock name for detailed review):
|


| 12Stocks.com: Investing in Smallcap Index with Stocks | |
|
The following table helps investors and traders sort through current performance and trends (as measured by Smart Investing & Trading Score) of various
stocks in the Smallcap Index. Quick View: Move mouse or cursor over stock symbol (ticker) to view short-term technical chart and over stock name to view long term chart. Click on  to add stock symbol to your watchlist and to add stock symbol to your watchlist and  to view watchlist. Click on any ticker or stock name for detailed market intelligence report for that stock. to view watchlist. Click on any ticker or stock name for detailed market intelligence report for that stock. |
12Stocks.com Performance of Stocks in Smallcap Index
| Ticker | Stock Name | Watchlist | Category | Recent Price | Smart Investing & Trading Score | Change % | Weekly Change% |
| ACDC | ProFrac Holding |   | Energy | 4.15 | 10 | -2.31% | 8.26% |
| DK | Delek US | | Energy | 27.02 | 100 | -8.67% | 7.76% |
| TTI | TETRA | | Energy | 4.51 | 100 | 3.41% | 7.32% |
| PARR | Par Pacific | | Energy | 34.17 | 90 | -5.10% | 6.77% |
| HLX | Helix Energy | | Energy | 6.44 | 80 | 5.26% | 4.53% |
| AROC | Archrock | | Energy | 24.53 | 90 | 1.42% | 4.30% |
| TALO | Talos Energy | | Energy | 9.55 | 100 | 1.64% | 4.20% |
| TDW | Tidewater | | Energy | 60.72 | 90 | 3.65% | 3.78% |
| NEXT | NextDecade | | Energy | 10.61 | 90 | 2.79% | 3.41% |
| OII | Oceaneering | | Energy | 24.40 | 100 | 1.91% | 2.82% |
| EGY | VAALCO Energy | | Energy | 3.87 | 90 | 3.49% | 2.66% |
| OIS | Oil States | | Energy | 5.53 | 90 | 2.38% | 2.38% |
| KGS | Kodiak Gas | | Energy | 35.31 | 15 | -2.55% | 2.31% |
| GRNT | Granite Ridge | | Energy | 5.51 | 50 | 2.25% | 2.25% |
| MRC | MRC Global | | Energy | 15.13 | 90 | 1.79% | 1.36% |
| REI | Ring Energy | | Energy | 1.10 | 100 | -0.65% | 0.90% |
| DNOW | NOW | | Energy | 15.95 | 90 | 0.40% | 0.87% |
| RES | RPC | | Energy | 4.68 | 80 | 1.83% | 0.68% |
| SDRL | Seadrill | | Energy | 31.97 | 100 | -0.31% | 0.31% |
| KOS | Kosmos Energy | | Energy | 1.83 | 50 | 1.75% | 0.00% |
| NBR | Nabors Industries | | Energy | 36.19 | 90 | -6.87% | -0.21% |
| CNX | CNX Resources | | Energy | 29.07 | 60 | 1.06% | -0.24% |
| AESI | Atlas Energy | | Energy | 11.70 | 46 | 0.00% | -0.53% |
| CVI | CVR Energy | | Energy | 29.58 | 90 | -7.10% | -0.59% |
| EPM | Evolution | | Energy | 5.10 | 100 | 2.04% | -0.60% |
| For chart view version of above stock list: Chart View ➞ 0 - 25 , 25 - 50 | ||
 | Click To Change The Sort Order: By Market Cap or Company Size Performance: Year-to-date, Week and Day |  |
| Too many stocks? View smallcap stocks filtered by marketcap & sector |
| Marketcap: All SmallCap Stocks (default-no microcap), Large, Mid-Range, Small |
| Smallcap Sector: Tech, Finance, Energy, Staples, Retail, Industrial, Materials, & Medical |
|
Get the most comprehensive stock market coverage daily at 12Stocks.com ➞ Best Stocks Today ➞ Best Stocks Weekly ➞ Best Stocks Year-to-Date ➞ Best Stocks Trends ➞  Best Stocks Today 12Stocks.com Best Nasdaq Stocks ➞ Best S&P 500 Stocks ➞ Best Tech Stocks ➞ Best Biotech Stocks ➞ |
| Detailed Overview of SmallCap Stocks |
| SmallCap Technical Overview, Leaders & Laggards, Top SmallCap ETF Funds & Detailed SmallCap Stocks List, Charts, Trends & More |
| Smallcap: Technical Analysis, Trends & YTD Performance | |
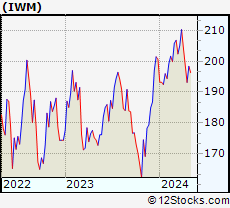
| SmallCap segment as represented by
IWM, an exchange-traded fund [ETF], holds basket of thousands of smallcap stocks from across all major sectors of the US stock market. The smallcap index (contains stocks like Riverbed & Sotheby's) is up by 4.36% and is currently underperforming the overall market by -2.9% year-to-date. Below is a quick view of technical charts and trends: | |
 IWM Weekly Chart |
|
| Long Term Trend: Very Good | |
| Medium Term Trend: Very Good | |
 IWM Daily Chart |
|
| Short Term Trend: Very Good | |
| Overall Trend Score: 80 | |
| YTD Performance: 4.36% | |
| **Trend Scores & Views Are Only For Educational Purposes And Not For Investing | |
| 12Stocks.com: Top Performing Small Cap Index Stocks | ||||||||||||||||||||||||||||||||||||||||||||||||
 The top performing Small Cap Index stocks year to date are
Now, more recently, over last week, the top performing Small Cap Index stocks on the move are


|
||||||||||||||||||||||||||||||||||||||||||||||||
| 12Stocks.com: Investing in Smallcap Index using Exchange Traded Funds | |
|
The following table shows list of key exchange traded funds (ETF) that
help investors track Smallcap index. The following list also includes leveraged ETF funds that track twice or thrice the daily returns of Smallcap indices. Short or inverse ETF funds move in the opposite direction to the index they track and are useful during market pullbacks or during bear markets. Quick View: Move mouse or cursor over ETF symbol (ticker) to view short-term technical chart and over ETF name to view long term chart. Click on ticker or stock name for detailed view. Click on to add stock symbol to your watchlist and to view watchlist. |
12Stocks.com List of ETFs that track Smallcap Index
| Ticker | ETF Name | Watchlist | Recent Price | Smart Investing & Trading Score | Change % | Week % | Year-to-date % |
| IWM | iShares Russell 2000 | | 235.17 | 80 | -0.44 | 0.14 | 4.36% |
| IJR | iShares Core S&P Small-Cap | | 118.76 | 100 | -0.08 | -0.89 | -0.29% |
| VTWO | Vanguard Russell 2000 ETF | | 95.43 | 80 | 0.24 | -0.93 | 2.92% |
| IWN | iShares Russell 2000 Value | | 174.53 | 100 | -0.01 | -0.85 | 2.1% |
| IWO | iShares Russell 2000 Growth | | 308.59 | 80 | 0.51 | -1.11 | 3.5% |
| IJS | iShares S&P Small-Cap 600 Value | | 110.04 | 100 | -0.22 | -0.99 | -2.29% |
| IJT | iShares S&P Small-Cap 600 Growth | | 141.94 | 70 | 0.05 | -0.89 | 1.68% |
| XSLV | PowerShares S&P SmallCap Low Volatil ETF | | 47.68 | 100 | -0.3 | -0.13 | -1.1% |
| SAA | ProShares Ultra SmallCap600 | | 25.65 | 100 | -0.31 | -2.17 | -8.34% |
| SMLV | SPDR SSGA US Small Cap Low Volatil ETF | | 133.28 | 100 | -0.09 | 2.75 | 2.13% |
| SDD | ProShares UltraShort SmallCap600 | | 13.29 | 30 | -100 | -100 | -100% |
| SBB | ProShares Short SmallCap600 | | 13.98 | 20 | 0.15 | 0.97 | 0.93% |
| 12Stocks.com: Charts, Trends, Fundamental Data and Performances of SmallCap Stocks | |
|
We now take in-depth look at all SmallCap stocks including charts, multi-period performances and overall trends (as measured by Smart Investing & Trading Score). One can sort SmallCap stocks (click link to choose) by Daily, Weekly and by Year-to-Date performances. Also, one can sort by size of the company or by market capitalization. |
| Select Your Default Chart Type: | |||||
| |||||
| Click on stock symbol or name for detailed view. Click on to add stock symbol to your watchlist and to view watchlist. Quick View: Move mouse or cursor over "Daily" to quickly view daily technical stock chart and over "Weekly" to view weekly technical stock chart. | |||||

 | ACDC ProFrac Holding Corp. |
| Sector: Energy | |
| SubSector: Oil & Gas Equipment & Services | |
| MarketCap: 1830 Millions | |
| Recent Price: 4.15 Smart Investing & Trading Score: 10 | |
| Day Percent Change: -2.31% Day Change: -0.09 | |
| Week Change: 8.26% Year-to-date Change: -51.0% | |
| ACDC Links: Profile News Message Board | |
| Charts:- Daily , Weekly | |
| Add ACDC to Watchlist: View: Get Complete ACDC Trend Analysis ➞ | |
 | DK Delek US Holdings, Inc. |
| Sector: Energy | |
| SubSector: Oil & Gas Refining & Marketing | |
| MarketCap: 1328.54 Millions | |
| Recent Price: 27.02 Smart Investing & Trading Score: 100 | |
| Day Percent Change: -8.67% Day Change: -2.15 | |
| Week Change: 7.76% Year-to-date Change: 28.0% | |
| DK Links: Profile News Message Board | |
| Charts:- Daily , Weekly | |
| Add DK to Watchlist: View: Get Complete DK Trend Analysis ➞ | |
 | TTI TETRA Technologies, Inc. |
| Sector: Energy | |
| SubSector: Oil & Gas Equipment & Services | |
| MarketCap: 56.9461 Millions | |
| Recent Price: 4.51 Smart Investing & Trading Score: 100 | |
| Day Percent Change: 3.41% Day Change: 0.14 | |
| Week Change: 7.32% Year-to-date Change: 18.7% | |
| TTI Links: Profile News Message Board | |
| Charts:- Daily , Weekly | |
| Add TTI to Watchlist: View: Get Complete TTI Trend Analysis ➞ | |
 | PARR Par Pacific Holdings, Inc. |
| Sector: Energy | |
| SubSector: Oil & Gas Refining & Marketing | |
| MarketCap: 443.154 Millions | |
| Recent Price: 34.17 Smart Investing & Trading Score: 90 | |
| Day Percent Change: -5.1% Day Change: -1.62 | |
| Week Change: 6.77% Year-to-date Change: 83.8% | |
| PARR Links: Profile News Message Board | |
| Charts:- Daily , Weekly | |
| Add PARR to Watchlist: View: Get Complete PARR Trend Analysis ➞ | |
 | HLX Helix Energy Solutions Group, Inc. |
| Sector: Energy | |
| SubSector: Oil & Gas Equipment & Services | |
| MarketCap: 341.661 Millions | |
| Recent Price: 6.44 Smart Investing & Trading Score: 80 | |
| Day Percent Change: 5.26% Day Change: 0.3 | |
| Week Change: 4.53% Year-to-date Change: -35.6% | |
| HLX Links: Profile News Message Board | |
| Charts:- Daily , Weekly | |
| Add HLX to Watchlist: View: Get Complete HLX Trend Analysis ➞ | |
 | AROC Archrock, Inc. |
| Sector: Energy | |
| SubSector: Oil & Gas Equipment & Services | |
| MarketCap: 614.961 Millions | |
| Recent Price: 24.53 Smart Investing & Trading Score: 90 | |
| Day Percent Change: 1.42% Day Change: 0.35 | |
| Week Change: 4.3% Year-to-date Change: 2.7% | |
| AROC Links: Profile News Message Board | |
| Charts:- Daily , Weekly | |
| Add AROC to Watchlist: View: Get Complete AROC Trend Analysis ➞ | |
 | TALO Talos Energy Inc. |
| Sector: Energy | |
| SubSector: Independent Oil & Gas | |
| MarketCap: 396.293 Millions | |
| Recent Price: 9.55 Smart Investing & Trading Score: 100 | |
| Day Percent Change: 1.64% Day Change: 0.14 | |
| Week Change: 4.2% Year-to-date Change: -10.5% | |
| TALO Links: Profile News Message Board | |
| Charts:- Daily , Weekly | |
| Add TALO to Watchlist: View: Get Complete TALO Trend Analysis ➞ | |
 | TDW Tidewater Inc. |
| Sector: Energy | |
| SubSector: Oil & Gas Equipment & Services | |
| MarketCap: 295.061 Millions | |
| Recent Price: 60.72 Smart Investing & Trading Score: 90 | |
| Day Percent Change: 3.65% Day Change: 2.04 | |
| Week Change: 3.78% Year-to-date Change: 5.9% | |
| TDW Links: Profile News Message Board | |
| Charts:- Daily , Weekly | |
| Add TDW to Watchlist: View: Get Complete TDW Trend Analysis ➞ | |
 | NEXT NextDecade Corporation |
| Sector: Energy | |
| SubSector: Independent Oil & Gas | |
| MarketCap: 270.893 Millions | |
| Recent Price: 10.61 Smart Investing & Trading Score: 90 | |
| Day Percent Change: 2.79% Day Change: 0.28 | |
| Week Change: 3.41% Year-to-date Change: 33.7% | |
| NEXT Links: Profile News Message Board | |
| Charts:- Daily , Weekly | |
| Add NEXT to Watchlist: View: Get Complete NEXT Trend Analysis ➞ | |
 | OII Oceaneering International, Inc. |
| Sector: Energy | |
| SubSector: Oil & Gas Equipment & Services | |
| MarketCap: 324.061 Millions | |
| Recent Price: 24.40 Smart Investing & Trading Score: 100 | |
| Day Percent Change: 1.91% Day Change: 0.43 | |
| Week Change: 2.82% Year-to-date Change: -11.9% | |
| OII Links: Profile News Message Board | |
| Charts:- Daily , Weekly | |
| Add OII to Watchlist: View: Get Complete OII Trend Analysis ➞ | |
 | EGY VAALCO Energy, Inc. |
| Sector: Energy | |
| SubSector: Independent Oil & Gas | |
| MarketCap: 59.5593 Millions | |
| Recent Price: 3.87 Smart Investing & Trading Score: 90 | |
| Day Percent Change: 3.49% Day Change: 0.13 | |
| Week Change: 2.66% Year-to-date Change: -8.6% | |
| EGY Links: Profile News Message Board | |
| Charts:- Daily , Weekly | |
| Add EGY to Watchlist: View: Get Complete EGY Trend Analysis ➞ | |
 | OIS Oil States International, Inc. |
| Sector: Energy | |
| SubSector: Oil & Gas Equipment & Services | |
| MarketCap: 131.061 Millions | |
| Recent Price: 5.53 Smart Investing & Trading Score: 90 | |
| Day Percent Change: 2.38% Day Change: 0.12 | |
| Week Change: 2.38% Year-to-date Change: 2.0% | |
| OIS Links: Profile News Message Board | |
| Charts:- Daily , Weekly | |
| Add OIS to Watchlist: View: Get Complete OIS Trend Analysis ➞ | |
 | KGS Kodiak Gas Services, LLC |
| Sector: Energy | |
| SubSector: Oil & Gas Equipment & Services | |
| MarketCap: 1220 Millions | |
| Recent Price: 35.31 Smart Investing & Trading Score: 15 | |
| Day Percent Change: -2.55% Day Change: -0.94 | |
| Week Change: 2.31% Year-to-date Change: -8.7% | |
| KGS Links: Profile News Message Board | |
| Charts:- Daily , Weekly | |
| Add KGS to Watchlist: View: Get Complete KGS Trend Analysis ➞ | |
 | GRNT Granite Ridge Resources, Inc. |
| Sector: Energy | |
| SubSector: Oil & Gas E&P | |
| MarketCap: 890 Millions | |
| Recent Price: 5.51 Smart Investing & Trading Score: 50 | |
| Day Percent Change: 2.25% Day Change: 0.12 | |
| Week Change: 2.25% Year-to-date Change: -12.4% | |
| GRNT Links: Profile News Message Board | |
| Charts:- Daily , Weekly | |
| Add GRNT to Watchlist: View: Get Complete GRNT Trend Analysis ➞ | |
 | MRC MRC Global Inc. |
| Sector: Energy | |
| SubSector: Oil & Gas Equipment & Services | |
| MarketCap: 364.061 Millions | |
| Recent Price: 15.13 Smart Investing & Trading Score: 90 | |
| Day Percent Change: 1.79% Day Change: 0.25 | |
| Week Change: 1.36% Year-to-date Change: 11.0% | |
| MRC Links: Profile News Message Board | |
| Charts:- Daily , Weekly | |
| Add MRC to Watchlist: View: Get Complete MRC Trend Analysis ➞ | |
 | REI Ring Energy, Inc. |
| Sector: Energy | |
| SubSector: Oil & Gas Drilling & Exploration | |
| MarketCap: 50.8139 Millions | |
| Recent Price: 1.10 Smart Investing & Trading Score: 100 | |
| Day Percent Change: -0.65% Day Change: -0.01 | |
| Week Change: 0.9% Year-to-date Change: -31.6% | |
| REI Links: Profile News Message Board | |
| Charts:- Daily , Weekly | |
| Add REI to Watchlist: View: Get Complete REI Trend Analysis ➞ | |
 | DNOW NOW Inc. |
| Sector: Energy | |
| SubSector: Oil & Gas Equipment & Services | |
| MarketCap: 679.661 Millions | |
| Recent Price: 15.95 Smart Investing & Trading Score: 90 | |
| Day Percent Change: 0.4% Day Change: 0.06 | |
| Week Change: 0.87% Year-to-date Change: 15.5% | |
| DNOW Links: Profile News Message Board | |
| Charts:- Daily , Weekly | |
| Add DNOW to Watchlist: View: Get Complete DNOW Trend Analysis ➞ | |
 | RES RPC, Inc. |
| Sector: Energy | |
| SubSector: Oil & Gas Equipment & Services | |
| MarketCap: 546.261 Millions | |
| Recent Price: 4.68 Smart Investing & Trading Score: 80 | |
| Day Percent Change: 1.83% Day Change: 0.08 | |
| Week Change: 0.68% Year-to-date Change: -23.1% | |
| RES Links: Profile News Message Board | |
| Charts:- Daily , Weekly | |
| Add RES to Watchlist: View: Get Complete RES Trend Analysis ➞ | |
 | SDRL Seadrill Limited |
| Sector: Energy | |
| SubSector: Oil & Gas Drilling | |
| MarketCap: 3300 Millions | |
| Recent Price: 31.97 Smart Investing & Trading Score: 100 | |
| Day Percent Change: -0.31% Day Change: -0.09 | |
| Week Change: 0.31% Year-to-date Change: -25.3% | |
| SDRL Links: Profile News Message Board | |
| Charts:- Daily , Weekly | |
| Add SDRL to Watchlist: View: Get Complete SDRL Trend Analysis ➞ | |
 | KOS Kosmos Energy Ltd. |
| Sector: Energy | |
| SubSector: Independent Oil & Gas | |
| MarketCap: 261.693 Millions | |
| Recent Price: 1.83 Smart Investing & Trading Score: 50 | |
| Day Percent Change: 1.75% Day Change: 0.03 | |
| Week Change: 0% Year-to-date Change: -49.1% | |
| KOS Links: Profile News Message Board | |
| Charts:- Daily , Weekly | |
| Add KOS to Watchlist: View: Get Complete KOS Trend Analysis ➞ | |
 | NBR Nabors Industries Ltd. |
| Sector: Energy | |
| SubSector: Oil & Gas Drilling & Exploration | |
| MarketCap: 240.539 Millions | |
| Recent Price: 36.19 Smart Investing & Trading Score: 90 | |
| Day Percent Change: -6.87% Day Change: -2.47 | |
| Week Change: -0.21% Year-to-date Change: -41.4% | |
| NBR Links: Profile News Message Board | |
| Charts:- Daily , Weekly | |
| Add NBR to Watchlist: View: Get Complete NBR Trend Analysis ➞ | |
 | CNX CNX Resources Corporation |
| Sector: Energy | |
| SubSector: Independent Oil & Gas | |
| MarketCap: 1344.33 Millions | |
| Recent Price: 29.07 Smart Investing & Trading Score: 60 | |
| Day Percent Change: 1.06% Day Change: 0.3 | |
| Week Change: -0.24% Year-to-date Change: -21.9% | |
| CNX Links: Profile News Message Board | |
| Charts:- Daily , Weekly | |
| Add CNX to Watchlist: View: Get Complete CNX Trend Analysis ➞ | |
 | AESI Atlas Energy Solutions Inc. |
| Sector: Energy | |
| SubSector: Oil & Gas Equipment & Services | |
| MarketCap: 947 Millions | |
| Recent Price: 11.70 Smart Investing & Trading Score: 46 | |
| Day Percent Change: 0% Day Change: 0 | |
| Week Change: -0.53% Year-to-date Change: -47.7% | |
| AESI Links: Profile News Message Board | |
| Charts:- Daily , Weekly | |
| Add AESI to Watchlist: View: Get Complete AESI Trend Analysis ➞ | |
 | CVI CVR Energy, Inc. |
| Sector: Energy | |
| SubSector: Oil & Gas Refining & Marketing | |
| MarketCap: 2482.14 Millions | |
| Recent Price: 29.58 Smart Investing & Trading Score: 90 | |
| Day Percent Change: -7.1% Day Change: -2.05 | |
| Week Change: -0.59% Year-to-date Change: 60.2% | |
| CVI Links: Profile News Message Board | |
| Charts:- Daily , Weekly | |
| Add CVI to Watchlist: View: Get Complete CVI Trend Analysis ➞ | |
 | EPM Evolution Petroleum Corporation |
| Sector: Energy | |
| SubSector: Independent Oil & Gas | |
| MarketCap: 98.0593 Millions | |
| Recent Price: 5.10 Smart Investing & Trading Score: 100 | |
| Day Percent Change: 2.04% Day Change: 0.1 | |
| Week Change: -0.6% Year-to-date Change: 0.1% | |
| EPM Links: Profile News Message Board | |
| Charts:- Daily , Weekly | |
| Add EPM to Watchlist: View: Get Complete EPM Trend Analysis ➞ | |
| For tabular summary view of above stock list: Summary View ➞ 0 - 25 , 25 - 50 | ||
| Click To Change The Sort Order: By Market Cap or Company Size Performance: Year-to-date, Week and Day | |
| Select Chart Type: | ||
| Too many stocks? View smallcap stocks filtered by marketcap & sector |
| Marketcap: All SmallCap Stocks (default-no microcap), Large, Mid-Range, Small & MicroCap |
| Sector: Tech, Finance, Energy, Staples, Retail, Industrial, Materials, Utilities & Medical |
|
Best Stocks Today 12Stocks.com |
© 2025 12Stocks.com Terms & Conditions Privacy Contact Us
All Information Provided Only For Education And Not To Be Used For Investing or Trading. See Terms & Conditions


One More Thing ... Get Best Stocks Delivered Daily!
Never Ever Miss A Move With Our Top Ten Stocks Lists
Find Best Stocks In Any Market - Bull or Bear Market
Take A Peek At Our Top Ten Stocks Lists: Daily, Weekly, Year-to-Date & Top Trends
Find Best Stocks In Any Market - Bull or Bear Market
Take A Peek At Our Top Ten Stocks Lists: Daily, Weekly, Year-to-Date & Top Trends
Smallcap Stocks With Best Up Trends [0-bearish to 100-bullish]: Cato [100], ALX Oncology[100], Cooper-Standard [100], Precigen [100], Designer Brands[100], Babcock & Wilcox Enterprises[100], Design [100], Ironwood [100], Teekay Tankers[100], Green Plains[100], i-80 Gold[100]
Best Smallcap Stocks Year-to-Date:
Celcuity [284.87%], OptimizeRx [232.1%], Precigen [225%], CommScope Holding[195.39%], Willdan Group[179%], 908 Devices[173.64%], Centrus Energy[166.15%], nLIGHT [157.86%], Cooper-Standard [153.02%], Rigel [149.64%], Kratos Defense[145.56%] Best Smallcap Stocks This Week:
Precigen [96.76%], ALX Oncology[57.25%], Immuneering [52.3%], Plymouth Industrial[40.4%], Array [37.99%], Cato [34.15%], SelectQuote [30.15%], Karyopharm [29.46%], Zentalis [26.35%], Guess [25.88%], Shoals [25.49%] Best Smallcap Stocks Daily:
SelectQuote [41.53%], Immuneering [34.99%], Cato [34.15%], ALX Oncology[23.8%], Cooper-Standard [16.38%], Tyra Biosciences[14.26%], Zentalis [14.02%], Zura Bio[13.71%], X4 [13.57%], Precigen [13.4%], Mersana [11.25%]