
 Login Sign Up


| |||||
 |  | ||||

| 12Stocks.com Market Intelligence |
Best SmallCap Stocks
|
| In a hurry? Small Cap Stock Lists: Performance Trends Table, Stock Charts
Sort Small Cap stocks: Daily, Weekly, Year-to-Date, Market Cap & Trends. Filter Small Cap stocks list by sector: Show all, Tech, Finance, Energy, Staples, Retail, Industrial, Materials, Utilities and HealthCare Filter Small Cap stocks list by size: All Large Medium Small and MicroCap |
| 12Stocks.com Small Cap Stocks Performances & Trends Daily | |||||||||
|
|  The overall Smart Investing & Trading Score is 100 (0-bearish to 100-bullish) which puts Small Cap index in short term bullish trend. The Smart Investing & Trading Score from previous trading session is 100 and an improvement of trend continues.
| ||||||||
Here are the Smart Investing & Trading Scores of the most requested small cap stocks at 12Stocks.com (click stock name for detailed review):
|


| 12Stocks.com: Investing in Smallcap Index with Stocks | |
|
The following table helps investors and traders sort through current performance and trends (as measured by Smart Investing & Trading Score) of various
stocks in the Smallcap Index. Quick View: Move mouse or cursor over stock symbol (ticker) to view short-term technical chart and over stock name to view long term chart. Click on  to add stock symbol to your watchlist and to add stock symbol to your watchlist and  to view watchlist. Click on any ticker or stock name for detailed market intelligence report for that stock. to view watchlist. Click on any ticker or stock name for detailed market intelligence report for that stock. |
12Stocks.com Performance of Stocks in Smallcap Index
| Ticker | Stock Name | Watchlist | Category | Recent Price | Smart Investing & Trading Score | Change % | YTD Change% |
| KTB | Kontoor Brands |   | Consumer Staples | 70.90 | 90 | 55.84 | -15.85% |
| TPB | Turning Point | | Consumer Staples | 98.58 | 90 | 50.60 | 66.51% |
| ELF | e.l.f. Beauty | | Consumer Staples | 116.37 | 50 | 29.97 | -2.09% |
| SHOO | Steven Madden | | Consumer Staples | 27.01 | 80 | 27.50 | -34.70% |
| HY | Hyster-Yale Materials | | Consumer Staples | 36.30 | 0 | 26.87 | -24.23% |
| FL | Foot Locker | | Consumer Staples | 25.78 | 100 | 24.89 | 19.49% |
| LIND | Lindblad Expeditions | | Consumer Staples | 13.50 | 80 | 18.35 | 14.42% |
| ALCO | Alico | | Consumer Staples | 32.81 | 50 | 17.44 | 29.23% |
| SKIN | Beauty Health | | Consumer Staples | 2.18 | 70 | 14.95 | 49.69% |
| ZVIA | Zevia PBC | | Consumer Staples | 2.91 | 20 | 12.02 | -28.64% |
| UVV | Universal | | Consumer Staples | 53.45 | 10 | 10.97 | 2.34% |
| RCKY | Rocky Brands | | Consumer Staples | 26.44 | 60 | 8.70 | 22.37% |
| SNBR | Sleep Number | | Consumer Staples | 11.13 | 100 | 8.38 | -29.59% |
| WWW | Wolverine World | | Consumer Staples | 28.71 | 100 | 7.91 | 30.94% |
| LMNR | Limoneira | | Consumer Staples | 15.38 | 30 | 7.07 | -33.34% |
| IRBT | iRobot | | Consumer Staples | 3.39 | 50 | 6.34 | -52.39% |
| BRCC | BRC | | Consumer Staples | 1.51 | 10 | 6.08 | -50.16% |
| ESCA | Escalade | | Consumer Staples | 12.15 | 10 | 5.94 | -4.73% |
| MOD | Modine | | Consumer Staples | 138.72 | 50 | 5.63 | 22.25% |
| BLBD | Blue Bird | | Consumer Staples | 57.37 | 90 | 5.51 | 46.21% |
| HOFT | Hooker Furniture | | Consumer Staples | 9.98 | 70 | 5.35 | -23.63% |
| LCII | LCI Industries | | Consumer Staples | 103.43 | 100 | 5.25 | 4.36% |
| CAL | Caleres | | Consumer Staples | 14.63 | 60 | 4.82 | -34.02% |
| AMWD | American Woodmark | | Consumer Staples | 63.46 | 80 | 4.81 | -15.45% |
| XPEL | XPEL | | Consumer Staples | 37.34 | 80 | 4.74 | -3.73% |
| For chart view version of above stock list: Chart View ➞ 0 - 25 , 25 - 50 , 50 - 75 , 75 - 100 , 100 - 125 | ||
 | Click To Change The Sort Order: By Market Cap or Company Size Performance: Year-to-date, Week and Day |  |
| Too many stocks? View smallcap stocks filtered by marketcap & sector |
| Marketcap: All SmallCap Stocks (default-no microcap), Large, Mid-Range, Small |
| Smallcap Sector: Tech, Finance, Energy, Staples, Retail, Industrial, Materials, & Medical |
|
Get the most comprehensive stock market coverage daily at 12Stocks.com ➞ Best Stocks Today ➞ Best Stocks Weekly ➞ Best Stocks Year-to-Date ➞ Best Stocks Trends ➞  Best Stocks Today 12Stocks.com Best Nasdaq Stocks ➞ Best S&P 500 Stocks ➞ Best Tech Stocks ➞ Best Biotech Stocks ➞ |
| Detailed Overview of SmallCap Stocks |
| SmallCap Technical Overview, Leaders & Laggards, Top SmallCap ETF Funds & Detailed SmallCap Stocks List, Charts, Trends & More |
| Smallcap: Technical Analysis, Trends & YTD Performance | |
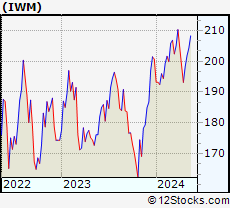
| SmallCap segment as represented by
IWM, an exchange-traded fund [ETF], holds basket of thousands of smallcap stocks from across all major sectors of the US stock market. The smallcap index (contains stocks like Riverbed & Sotheby's) is up by 5.17% and is currently underperforming the overall market by -5.16% year-to-date. Below is a quick view of technical charts and trends: | |
 IWM Weekly Chart |
|
| Long Term Trend: Very Good | |
| Medium Term Trend: Good | |
 IWM Daily Chart |
|
| Short Term Trend: Very Good | |
| Overall Trend Score: 100 | |
| YTD Performance: 5.17% | |
| **Trend Scores & Views Are Only For Educational Purposes And Not For Investing | |
| 12Stocks.com: Top Performing Small Cap Index Stocks | ||||||||||||||||||||||||||||||||||||||||||||||||
 The top performing Small Cap Index stocks year to date are
Now, more recently, over last week, the top performing Small Cap Index stocks on the move are


|
||||||||||||||||||||||||||||||||||||||||||||||||
| 12Stocks.com: Investing in Smallcap Index using Exchange Traded Funds | |
|
The following table shows list of key exchange traded funds (ETF) that
help investors track Smallcap index. The following list also includes leveraged ETF funds that track twice or thrice the daily returns of Smallcap indices. Short or inverse ETF funds move in the opposite direction to the index they track and are useful during market pullbacks or during bear markets. Quick View: Move mouse or cursor over ETF symbol (ticker) to view short-term technical chart and over ETF name to view long term chart. Click on ticker or stock name for detailed view. Click on to add stock symbol to your watchlist and to view watchlist. |
12Stocks.com List of ETFs that track Smallcap Index
| Ticker | ETF Name | Watchlist | Recent Price | Smart Investing & Trading Score | Change % | Week % | Year-to-date % |
| IWM | iShares Russell 2000 | | 227.13 | 100 | 3.34 | 4.83 | 5.17% |
| IJR | iShares Core S&P Small-Cap | | 114.44 | 100 | 3.14 | 5.41 | 2.05% |
| VTWO | Vanguard Russell 2000 ETF | | 91.86 | 100 | 14.09 | 4.83 | 5.28% |
| IWN | iShares Russell 2000 Value | | 166.61 | 100 | 12.58 | 5.29 | 4.12% |
| IWO | iShares Russell 2000 Growth | | 299.36 | 70 | 2.92 | 4.45 | 6.18% |
| IJS | iShares S&P Small-Cap 600 Value | | 105.64 | 100 | 8.2 | 6.32 | -0.03% |
| IJT | iShares S&P Small-Cap 600 Growth | | 137.41 | 70 | 2.62 | 4.66 | 4.24% |
| XSLV | PowerShares S&P SmallCap Low Volatil ETF | | 46.12 | 60 | 12.32 | 3.16 | 0.12% |
| SBB | ProShares Short SmallCap600 | | 14.50 | 20 | -12.53 | -5.14 | -1.56% |
| SAA | ProShares Ultra SmallCap600 | | 23.91 | 70 | 5.47 | 11.11 | -3.54% |
| SMLV | SPDR SSGA US Small Cap Low Volatil ETF | | 128.01 | 70 | 15.28 | 5.23 | 3.76% |
| SDD | ProShares UltraShort SmallCap600 | | 14.33 | 0 | -5.22 | -10.12 | -8.29% |
| 12Stocks.com: Charts, Trends, Fundamental Data and Performances of SmallCap Stocks | |
|
We now take in-depth look at all SmallCap stocks including charts, multi-period performances and overall trends (as measured by Smart Investing & Trading Score). One can sort SmallCap stocks (click link to choose) by Daily, Weekly and by Year-to-Date performances. Also, one can sort by size of the company or by market capitalization. |
| Select Your Default Chart Type: | |||||
| |||||
| Click on stock symbol or name for detailed view. Click on to add stock symbol to your watchlist and to view watchlist. Quick View: Move mouse or cursor over "Daily" to quickly view daily technical stock chart and over "Weekly" to view weekly technical stock chart. | |||||

 | KTB Kontoor Brands, Inc. |
| Sector: Consumer Staples | |
| SubSector: Textile - Apparel Clothing | |
| MarketCap: 1668.65 Millions | |
| Recent Price: 70.90 Smart Investing & Trading Score: 90 | |
| Day Percent Change: 55.84% Day Change: 26.38 | |
| Week Change: 24.67% Year-to-date Change: -15.9% | |
| KTB Links: Profile News Message Board | |
| Charts:- Daily , Weekly | |
| Add KTB to Watchlist: View: Get Complete KTB Trend Analysis ➞ | |
 | TPB Turning Point Brands, Inc. |
| Sector: Consumer Staples | |
| SubSector: Tobacco Products, Other | |
| MarketCap: 381.97 Millions | |
| Recent Price: 98.58 Smart Investing & Trading Score: 90 | |
| Day Percent Change: 50.6% Day Change: 13.17 | |
| Week Change: 7.73% Year-to-date Change: 66.5% | |
| TPB Links: Profile News Message Board | |
| Charts:- Daily , Weekly | |
| Add TPB to Watchlist: View: Get Complete TPB Trend Analysis ➞ | |
 | ELF e.l.f. Beauty, Inc. |
| Sector: Consumer Staples | |
| SubSector: Personal Products | |
| MarketCap: 497.985 Millions | |
| Recent Price: 116.37 Smart Investing & Trading Score: 50 | |
| Day Percent Change: 29.97% Day Change: 39.42 | |
| Week Change: 11.35% Year-to-date Change: -2.1% | |
| ELF Links: Profile News Message Board | |
| Charts:- Daily , Weekly | |
| Add ELF to Watchlist: View: Get Complete ELF Trend Analysis ➞ | |
 | SHOO Steven Madden, Ltd. |
| Sector: Consumer Staples | |
| SubSector: Textile - Apparel Footwear & Accessories | |
| MarketCap: 1756.3 Millions | |
| Recent Price: 27.01 Smart Investing & Trading Score: 80 | |
| Day Percent Change: 27.5% Day Change: 9.74 | |
| Week Change: 5.73% Year-to-date Change: -34.7% | |
| SHOO Links: Profile News Message Board | |
| Charts:- Daily , Weekly | |
| Add SHOO to Watchlist: View: Get Complete SHOO Trend Analysis ➞ | |
 | HY Hyster-Yale Materials Handling, Inc. |
| Sector: Consumer Staples | |
| SubSector: Trucks & Other Vehicles | |
| MarketCap: 660 Millions | |
| Recent Price: 36.30 Smart Investing & Trading Score: 0 | |
| Day Percent Change: 26.87% Day Change: 13.05 | |
| Week Change: 2.76% Year-to-date Change: -24.2% | |
| HY Links: Profile News Message Board | |
| Charts:- Daily , Weekly | |
| Add HY to Watchlist: View: Get Complete HY Trend Analysis ➞ | |
 | FL Foot Locker, Inc. |
| Sector: Consumer Staples | |
| SubSector: Textile - Apparel Footwear & Accessories | |
| MarketCap: 2463.6 Millions | |
| Recent Price: 25.78 Smart Investing & Trading Score: 100 | |
| Day Percent Change: 24.89% Day Change: 6.52 | |
| Week Change: 2.81% Year-to-date Change: 19.5% | |
| FL Links: Profile News Message Board | |
| Charts:- Daily , Weekly | |
| Add FL to Watchlist: View: Get Complete FL Trend Analysis ➞ | |
 | LIND Lindblad Expeditions Holdings, Inc. |
| Sector: Consumer Staples | |
| SubSector: Recreational Goods, Other | |
| MarketCap: 220.259 Millions | |
| Recent Price: 13.50 Smart Investing & Trading Score: 80 | |
| Day Percent Change: 18.35% Day Change: 1.62 | |
| Week Change: 3.98% Year-to-date Change: 14.4% | |
| LIND Links: Profile News Message Board | |
| Charts:- Daily , Weekly | |
| Add LIND to Watchlist: View: Get Complete LIND Trend Analysis ➞ | |
 | ALCO Alico, Inc. |
| Sector: Consumer Staples | |
| SubSector: Farm Products | |
| MarketCap: 221.187 Millions | |
| Recent Price: 32.81 Smart Investing & Trading Score: 50 | |
| Day Percent Change: 17.44% Day Change: 4.34 | |
| Week Change: 3.63% Year-to-date Change: 29.2% | |
| ALCO Links: Profile News Message Board | |
| Charts:- Daily , Weekly | |
| Add ALCO to Watchlist: View: Get Complete ALCO Trend Analysis ➞ | |
 | SKIN The Beauty Health Company |
| Sector: Consumer Staples | |
| SubSector: Household & Personal Products | |
| MarketCap: 1070 Millions | |
| Recent Price: 2.18 Smart Investing & Trading Score: 70 | |
| Day Percent Change: 14.95% Day Change: 0.23 | |
| Week Change: 49.69% Year-to-date Change: 49.7% | |
| SKIN Links: Profile News Message Board | |
| Charts:- Daily , Weekly | |
| Add SKIN to Watchlist: View: Get Complete SKIN Trend Analysis ➞ | |
 | ZVIA Zevia PBC |
| Sector: Consumer Staples | |
| SubSector: Beverages - Non-Alcoholic | |
| MarketCap: 303 Millions | |
| Recent Price: 2.91 Smart Investing & Trading Score: 20 | |
| Day Percent Change: 12.02% Day Change: 0.12 | |
| Week Change: -13.08% Year-to-date Change: -28.6% | |
| ZVIA Links: Profile News Message Board | |
| Charts:- Daily , Weekly | |
| Add ZVIA to Watchlist: View: Get Complete ZVIA Trend Analysis ➞ | |
 | UVV Universal Corporation |
| Sector: Consumer Staples | |
| SubSector: Tobacco Products, Other | |
| MarketCap: 1107.7 Millions | |
| Recent Price: 53.45 Smart Investing & Trading Score: 10 | |
| Day Percent Change: 10.97% Day Change: 5.33 | |
| Week Change: -1.67% Year-to-date Change: 2.3% | |
| UVV Links: Profile News Message Board | |
| Charts:- Daily , Weekly | |
| Add UVV to Watchlist: View: Get Complete UVV Trend Analysis ➞ | |
 | RCKY Rocky Brands, Inc. |
| Sector: Consumer Staples | |
| SubSector: Textile - Apparel Footwear & Accessories | |
| MarketCap: 137.47 Millions | |
| Recent Price: 26.44 Smart Investing & Trading Score: 60 | |
| Day Percent Change: 8.7% Day Change: 2.54 | |
| Week Change: -1.19% Year-to-date Change: 22.4% | |
| RCKY Links: Profile News Message Board | |
| Charts:- Daily , Weekly | |
| Add RCKY to Watchlist: View: Get Complete RCKY Trend Analysis ➞ | |
 | SNBR Sleep Number Corporation |
| Sector: Consumer Staples | |
| SubSector: Home Furnishings & Fixtures | |
| MarketCap: 692.735 Millions | |
| Recent Price: 11.13 Smart Investing & Trading Score: 100 | |
| Day Percent Change: 8.38% Day Change: 1.11 | |
| Week Change: 14.27% Year-to-date Change: -29.6% | |
| SNBR Links: Profile News Message Board | |
| Charts:- Daily , Weekly | |
| Add SNBR to Watchlist: View: Get Complete SNBR Trend Analysis ➞ | |
 | WWW Wolverine World Wide, Inc. |
| Sector: Consumer Staples | |
| SubSector: Textile - Apparel Footwear & Accessories | |
| MarketCap: 1390.7 Millions | |
| Recent Price: 28.71 Smart Investing & Trading Score: 100 | |
| Day Percent Change: 7.91% Day Change: 0.99 | |
| Week Change: 5.89% Year-to-date Change: 30.9% | |
| WWW Links: Profile News Message Board | |
| Charts:- Daily , Weekly | |
| Add WWW to Watchlist: View: Get Complete WWW Trend Analysis ➞ | |
 | LMNR Limoneira Company |
| Sector: Consumer Staples | |
| SubSector: Farm Products | |
| MarketCap: 324.987 Millions | |
| Recent Price: 15.38 Smart Investing & Trading Score: 30 | |
| Day Percent Change: 7.07% Day Change: 1.5 | |
| Week Change: 5.55% Year-to-date Change: -33.3% | |
| LMNR Links: Profile News Message Board | |
| Charts:- Daily , Weekly | |
| Add LMNR to Watchlist: View: Get Complete LMNR Trend Analysis ➞ | |
 | IRBT iRobot Corporation |
| Sector: Consumer Staples | |
| SubSector: Appliances | |
| MarketCap: 1193.38 Millions | |
| Recent Price: 3.39 Smart Investing & Trading Score: 50 | |
| Day Percent Change: 6.34% Day Change: 0.47 | |
| Week Change: -12.56% Year-to-date Change: -52.4% | |
| IRBT Links: Profile News Message Board | |
| Charts:- Daily , Weekly | |
| Add IRBT to Watchlist: View: Get Complete IRBT Trend Analysis ➞ | |
 | BRCC BRC Inc. |
| Sector: Consumer Staples | |
| SubSector: Packaged Foods | |
| MarketCap: 1110 Millions | |
| Recent Price: 1.51 Smart Investing & Trading Score: 10 | |
| Day Percent Change: 6.08% Day Change: 0.25 | |
| Week Change: 22.48% Year-to-date Change: -50.2% | |
| BRCC Links: Profile News Message Board | |
| Charts:- Daily , Weekly | |
| Add BRCC to Watchlist: View: Get Complete BRCC Trend Analysis ➞ | |
 | ESCA Escalade, Incorporated |
| Sector: Consumer Staples | |
| SubSector: Sporting Goods | |
| MarketCap: 87.8144 Millions | |
| Recent Price: 12.15 Smart Investing & Trading Score: 10 | |
| Day Percent Change: 5.94% Day Change: 0.79 | |
| Week Change: 6.53% Year-to-date Change: -4.7% | |
| ESCA Links: Profile News Message Board | |
| Charts:- Daily , Weekly | |
| Add ESCA to Watchlist: View: Get Complete ESCA Trend Analysis ➞ | |
 | MOD Modine Manufacturing Company |
| Sector: Consumer Staples | |
| SubSector: Auto Parts | |
| MarketCap: 177.339 Millions | |
| Recent Price: 138.72 Smart Investing & Trading Score: 50 | |
| Day Percent Change: 5.63% Day Change: 6.37 | |
| Week Change: 3.76% Year-to-date Change: 22.3% | |
| MOD Links: Profile News Message Board | |
| Charts:- Daily , Weekly | |
| Add MOD to Watchlist: View: Get Complete MOD Trend Analysis ➞ | |
 | BLBD Blue Bird Corporation |
| Sector: Consumer Staples | |
| SubSector: Auto Manufacturers - Major | |
| MarketCap: 345.371 Millions | |
| Recent Price: 57.37 Smart Investing & Trading Score: 90 | |
| Day Percent Change: 5.51% Day Change: 2.55 | |
| Week Change: 27.96% Year-to-date Change: 46.2% | |
| BLBD Links: Profile News Message Board | |
| Charts:- Daily , Weekly | |
| Add BLBD to Watchlist: View: Get Complete BLBD Trend Analysis ➞ | |
 | HOFT Hooker Furniture Corporation |
| Sector: Consumer Staples | |
| SubSector: Home Furnishings & Fixtures | |
| MarketCap: 173.235 Millions | |
| Recent Price: 9.98 Smart Investing & Trading Score: 70 | |
| Day Percent Change: 5.35% Day Change: 0.8 | |
| Week Change: 9.85% Year-to-date Change: -23.6% | |
| HOFT Links: Profile News Message Board | |
| Charts:- Daily , Weekly | |
| Add HOFT to Watchlist: View: Get Complete HOFT Trend Analysis ➞ | |
 | LCII LCI Industries |
| Sector: Consumer Staples | |
| SubSector: Recreational Vehicles | |
| MarketCap: 1663.59 Millions | |
| Recent Price: 103.43 Smart Investing & Trading Score: 100 | |
| Day Percent Change: 5.25% Day Change: 5.99 | |
| Week Change: 9.86% Year-to-date Change: 4.4% | |
| LCII Links: Profile News Message Board | |
| Charts:- Daily , Weekly | |
| Add LCII to Watchlist: View: Get Complete LCII Trend Analysis ➞ | |
 | CAL Caleres, Inc. |
| Sector: Consumer Staples | |
| SubSector: Textile - Apparel Footwear & Accessories | |
| MarketCap: 224.07 Millions | |
| Recent Price: 14.63 Smart Investing & Trading Score: 60 | |
| Day Percent Change: 4.82% Day Change: 2.02 | |
| Week Change: 8.92% Year-to-date Change: -34.0% | |
| CAL Links: Profile News Message Board | |
| Charts:- Daily , Weekly | |
| Add CAL to Watchlist: View: Get Complete CAL Trend Analysis ➞ | |
 | AMWD American Woodmark Corporation |
| Sector: Consumer Staples | |
| SubSector: Home Furnishings & Fixtures | |
| MarketCap: 958.435 Millions | |
| Recent Price: 63.46 Smart Investing & Trading Score: 80 | |
| Day Percent Change: 4.81% Day Change: 4.57 | |
| Week Change: 8.36% Year-to-date Change: -15.5% | |
| AMWD Links: Profile News Message Board | |
| Charts:- Daily , Weekly | |
| Add AMWD to Watchlist: View: Get Complete AMWD Trend Analysis ➞ | |
 | XPEL XPEL, Inc. |
| Sector: Consumer Staples | |
| SubSector: Auto Parts | |
| MarketCap: 290.239 Millions | |
| Recent Price: 37.34 Smart Investing & Trading Score: 80 | |
| Day Percent Change: 4.74% Day Change: 2.04 | |
| Week Change: 11.38% Year-to-date Change: -3.7% | |
| XPEL Links: Profile News Message Board | |
| Charts:- Daily , Weekly | |
| Add XPEL to Watchlist: View: Get Complete XPEL Trend Analysis ➞ | |
| For tabular summary view of above stock list: Summary View ➞ 0 - 25 , 25 - 50 , 50 - 75 , 75 - 100 , 100 - 125 | ||
| Click To Change The Sort Order: By Market Cap or Company Size Performance: Year-to-date, Week and Day | |
| Select Chart Type: | ||
| Too many stocks? View smallcap stocks filtered by marketcap & sector |
| Marketcap: All SmallCap Stocks (default-no microcap), Large, Mid-Range, Small & MicroCap |
| Sector: Tech, Finance, Energy, Staples, Retail, Industrial, Materials, Utilities & Medical |
|
Best Stocks Today 12Stocks.com |
© 2025 12Stocks.com Terms & Conditions Privacy Contact Us
All Information Provided Only For Education And Not To Be Used For Investing or Trading. See Terms & Conditions


One More Thing ... Get Best Stocks Delivered Daily!
Never Ever Miss A Move With Our Top Ten Stocks Lists
Find Best Stocks In Any Market - Bull or Bear Market
Take A Peek At Our Top Ten Stocks Lists: Daily, Weekly, Year-to-Date & Top Trends
Find Best Stocks In Any Market - Bull or Bear Market
Take A Peek At Our Top Ten Stocks Lists: Daily, Weekly, Year-to-Date & Top Trends
Smallcap Stocks With Best Up Trends [0-bearish to 100-bullish]: LendingTree [100], Amneal [100], XOMA [100], Newmark Group[100], Novavax [100], Mirum [100], Ensign Group[100], Halozyme [100], Taylor Morrison[100], Century Communities[100], Graham [100]
Best Smallcap Stocks Year-to-Date:
Celcuity [300.08%], OptimizeRx [256.58%], 908 Devices[220.45%], Willdan Group[210.66%], CommScope Holding[192.51%], Centrus Energy[181.4%], Amprius [173.93%], Kratos Defense[160.61%], nLIGHT [159.77%], Digital Turbine[159.76%], Solid Power[155.03%] Best Smallcap Stocks This Week:
X4 [85.44%], Aveanna Healthcare[83.8%], Gevo [69.23%], BioXcel [68.67%], Ovid [68.17%], Sapiens [58.51%], Cerence [57.58%], Arcturus [57.33%], Money[56.67%], Generation Bio[54.44%], Hanesbrands [53.72%] Best Smallcap Stocks Daily:
Summit [647.43%], SITE Centers[336.52%], Atara Bio[214.54%], Crinetics [209.71%], Pennant Group[203.74%], Pulse Biosciences[194.65%], CareDx [185.69%], LendingTree [170.2%], Chimera [160.37%], TG [153.47%], Hawkins [146.51%]