
 Login Sign Up


| |||||
 |  | ||||

| 12Stocks.com Market Intelligence |
Best Materials Stocks
| In a hurry? Materials Stocks Lists: Performance Trends Table, Stock Charts
Sort Materials stocks: Daily, Weekly, Year-to-Date, Market Cap & Trends. Filter Materials stocks list by size: All Materials Large Mid-Range Small |
| 12Stocks.com Materials Stocks Performances & Trends Daily | |||||||||
|
|  The overall Smart Investing & Trading Score is 20 (0-bearish to 100-bullish) which puts Materials sector in short term bearish trend. The Smart Investing & Trading Score from previous trading session is 30 and a deterioration of trend continues.
| ||||||||
Here are the Smart Investing & Trading Scores of the most requested Materials stocks at 12Stocks.com (click stock name for detailed review):
|


| Consider signing up for our daily 12Stocks.com "Best Stocks Newsletter". You will never ever miss a big stock move again! |
| 12Stocks.com: Investing in Materials sector with Stocks | |
|
The following table helps investors and traders sort through current performance and trends (as measured by Smart Investing & Trading Score) of various
stocks in the Materials sector. Quick View: Move mouse or cursor over stock symbol (ticker) to view short-term Technical chart and over stock name to view long term chart. Click on  to add stock symbol to your watchlist and to add stock symbol to your watchlist and  to view watchlist. Click on any ticker or stock name for detailed market intelligence report for that stock. to view watchlist. Click on any ticker or stock name for detailed market intelligence report for that stock. |
12Stocks.com Performance of Stocks in Materials Sector
| Ticker | Stock Name | Watchlist | Category | Recent Price | Smart Investing & Trading Score | Change % | YTD Change% |
| JHX | James Hardie |   | Building Materials | 19.16 | 0 | -2.24 | -37.51% |
| BCC | Boise Cascade | | Lumber & Wood Production | 80.46 | 10 | -2.34 | -31.06% |
| ASTL | Algoma Steel | | Steel | 4.59 | 40 | -2.34 | -51.92% |
| OEC | Orion S.A | | Chemicals | 8.64 | 10 | -2.37 | -43.13% |
| PAAS | Pan American | | Gold | 35.34 | 50 | -2.40 | 66.79% |
| SSD | Simpson | | Lumber & Wood Production | 182.33 | 30 | -2.43 | 11.29% |
| CLMT | Calumet | | Chemicals | 18.77 | 90 | -2.57 | -13.88% |
| LOMA | Loma Negra | | Building Materials | 7.46 | 10 | -2.61 | -40.61% |
| SMTS | Sierra Metals | | Metals/Minerals | 0.29 | 80 | -2.66 | 0.00% |
| FRD | Friedman Industries | | Steel | 21.32 | 60 | -2.67 | 44.21% |
| HL | Hecla | | Other Precious Metals & Mining | 11.03 | 60 | -2.82 | 110.00% |
| VGZ | Vista Gold | | Gold | 2.04 | 70 | -2.86 | 254.54% |
| AG | First Majestic | | Silver | 10.05 | 50 | -3.09 | 69.23% |
| GATO | Gatos Silver | | Other Precious Metals & Mining | 14.40 | 20 | -3.10 | -4.89% |
| KRO | Kronos Worldwide | | Chemicals | 6.03 | 20 | -3.21 | -35.13% |
| NEXA | Nexa | | Other Industrial Metals & Mining | 5.09 | 90 | -3.23 | -27.83% |
| LODE | Comstock | | Other Precious Metals & Mining | 2.86 | 30 | -3.38 | -61.35% |
| AKG | Asanko Gold | | Gold | 16.87 | 0 | -3.38 | 0.00% |
| GORO | Gold | | Gold | 0.72 | 60 | -3.49 | 226.08% |
| NUE | Nucor Corp | | Steel | 137.39 | 30 | -3.79 | 21.06% |
| MERC | Mercer | | Paper & Paper Products | 3.05 | 20 | -3.79 | -50.67% |
| SLVM | Sylvamo Corp | | Paper & Paper Products | 44.47 | 30 | -3.86 | -46.20% |
| MPVD | Mountain Prove | | Metals/Minerals | 10.23 | 80 | -4.39 | 0.00% |
| AMRS | Amyris | | Chemicals | 18.23 | 70 | -4.90 | 0.00% |
| BIOX | Bioceres Crop | | Agricultural Inputs | 1.81 | 0 | -5.24 | -73.07% |
| For chart view version of above stock list: Chart View ➞ 0 - 25 , 25 - 50 , 50 - 75 , 75 - 100 , 100 - 125 , 125 - 150 , 150 - 175 , 175 - 200 , 200 - 225 , 225 - 250 , 250 - 275 | ||
 | Click To Change The Sort Order: By Market Cap or Company Size Performance: Year-to-date, Week and Day |  |
|
Get the most comprehensive stock market coverage daily at 12Stocks.com ➞ Best Stocks Today ➞ Best Stocks Weekly ➞ Best Stocks Year-to-Date ➞ Best Stocks Trends ➞  Best Stocks Today 12Stocks.com Best Nasdaq Stocks ➞ Best S&P 500 Stocks ➞ Best Tech Stocks ➞ Best Biotech Stocks ➞ |
| Detailed Overview of Materials Stocks |
| Materials Technical Overview, Leaders & Laggards, Top Materials ETF Funds & Detailed Materials Stocks List, Charts, Trends & More |
| Materials Sector: Technical Analysis, Trends & YTD Performance | |
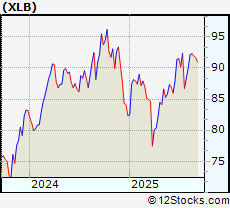
| Materials sector is composed of stocks
from mining, metals, agricultural, precious metals
and chemical subsectors. Materials sector, as represented by XLB, an exchange-traded fund [ETF] that holds basket of Materials stocks (e.g, Dow Chemical, Newmont Mining) is up by 9.61724% and is currently underperforming the overall market by -3.97146% year-to-date. Below is a quick view of Technical charts and trends: |
|
 XLB Weekly Chart |
|
| Long Term Trend: Very Good | |
| Medium Term Trend: Not Good | |
 XLB Daily Chart |
|
| Short Term Trend: Not Good | |
| Overall Trend Score: 20 | |
| YTD Performance: 9.61724% | |
| **Trend Scores & Views Are Only For Educational Purposes And Not For Investing | |
| 12Stocks.com: Top Performing Materials Sector Stocks | ||||||||||||||||||||||||||||||||||||||||||||||||
 The top performing Materials sector stocks year to date are
Now, more recently, over last week, the top performing Materials sector stocks on the move are


|
||||||||||||||||||||||||||||||||||||||||||||||||
| 12Stocks.com: Investing in Materials Sector using Exchange Traded Funds | |
|
The following table shows list of key exchange traded funds (ETF) that
help investors track Materials Index. For detailed view, check out our ETF Funds section of our website. Quick View: Move mouse or cursor over ETF symbol (ticker) to view short-term Technical chart and over ETF name to view long term chart. Click on ticker or stock name for detailed view. Click on to add stock symbol to your watchlist and to view watchlist. |
12Stocks.com List of ETFs that track Materials Index
| Ticker | ETF Name | Watchlist | Recent Price | Smart Investing & Trading Score | Change % | Week % | Year-to-date % |
| JJC | Copper Sub | | 62.75 | 90 | 2.06571 | 220.808 | 0% |
| RTM | S&P 500 Eq | | 33.24 | 20 | -1.44975 | -1.74396 | 4.28614% |
| 12Stocks.com: Charts, Trends, Fundamental Data and Performances of Materials Stocks | |
|
We now take in-depth look at all Materials stocks including charts, multi-period performances and overall trends (as measured by Smart Investing & Trading Score). One can sort Materials stocks (click link to choose) by Daily, Weekly and by Year-to-Date performances. Also, one can sort by size of the company or by market capitalization. |
| Select Your Default Chart Type: | |||||
| |||||
| Click on stock symbol or name for detailed view. Click on to add stock symbol to your watchlist and to view watchlist. Quick View: Move mouse or cursor over "Daily" to quickly view daily Technical stock chart and over "Weekly" to view weekly Technical stock chart. | |||||

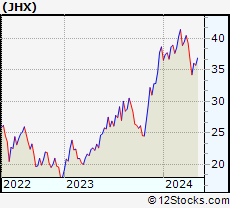 | JHX James Hardie Industries plc |
| Sector: Materials | |
| SubSector: Building Materials | |
| MarketCap: 11699.3 Millions | |
| Recent Price: 19.16 Smart Investing & Trading Score: 0 | |
| Day Percent Change: -2.2449% Day Change: 1.14 | |
| Week Change: -1.54162% Year-to-date Change: -37.5% | |
| JHX Links: Profile News Message Board | |
| Charts:- Daily , Weekly | |
| Add JHX to Watchlist: View: Get Complete JHX Trend Analysis ➞ | |
 | BCC Boise Cascade Co |
| Sector: Materials | |
| SubSector: Lumber & Wood Production | |
| MarketCap: 3361.12 Millions | |
| Recent Price: 80.46 Smart Investing & Trading Score: 10 | |
| Day Percent Change: -2.34252% Day Change: 0.17 | |
| Week Change: -5.66303% Year-to-date Change: -31.1% | |
| BCC Links: Profile News Message Board | |
| Charts:- Daily , Weekly | |
| Add BCC to Watchlist: View: Get Complete BCC Trend Analysis ➞ | |
 | ASTL Algoma Steel Group Inc |
| Sector: Materials | |
| SubSector: Steel | |
| MarketCap: 538.29 Millions | |
| Recent Price: 4.59 Smart Investing & Trading Score: 40 | |
| Day Percent Change: -2.34043% Day Change: 0.22 | |
| Week Change: -1.92308% Year-to-date Change: -51.9% | |
| ASTL Links: Profile News Message Board | |
| Charts:- Daily , Weekly | |
| Add ASTL to Watchlist: View: Get Complete ASTL Trend Analysis ➞ | |
 | OEC Orion S.A |
| Sector: Materials | |
| SubSector: Specialty Chemicals | |
| MarketCap: 596.31 Millions | |
| Recent Price: 8.64 Smart Investing & Trading Score: 10 | |
| Day Percent Change: -2.37288% Day Change: -0.1 | |
| Week Change: -17.6358% Year-to-date Change: -43.1% | |
| OEC Links: Profile News Message Board | |
| Charts:- Daily , Weekly | |
| Add OEC to Watchlist: View: Get Complete OEC Trend Analysis ➞ | |
 | PAAS Pan American Silver Corp |
| Sector: Materials | |
| SubSector: Gold | |
| MarketCap: 12518.3 Millions | |
| Recent Price: 35.34 Smart Investing & Trading Score: 50 | |
| Day Percent Change: -2.40265% Day Change: 0.77 | |
| Week Change: -0.169492% Year-to-date Change: 66.8% | |
| PAAS Links: Profile News Message Board | |
| Charts:- Daily , Weekly | |
| Add PAAS to Watchlist: View: Get Complete PAAS Trend Analysis ➞ | |
 | SSD Simpson Manufacturing Co., Inc |
| Sector: Materials | |
| SubSector: Lumber & Wood Production | |
| MarketCap: 8152.83 Millions | |
| Recent Price: 182.33 Smart Investing & Trading Score: 30 | |
| Day Percent Change: -2.43472% Day Change: 0.3 | |
| Week Change: -4.18812% Year-to-date Change: 11.3% | |
| SSD Links: Profile News Message Board | |
| Charts:- Daily , Weekly | |
| Add SSD to Watchlist: View: Get Complete SSD Trend Analysis ➞ | |
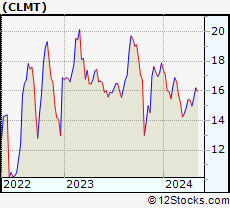 | CLMT Calumet Inc |
| Sector: Materials | |
| SubSector: Specialty Chemicals | |
| MarketCap: 1547.66 Millions | |
| Recent Price: 18.77 Smart Investing & Trading Score: 90 | |
| Day Percent Change: -2.57009% Day Change: 1 | |
| Week Change: 5.59932% Year-to-date Change: -13.9% | |
| CLMT Links: Profile News Message Board | |
| Charts:- Daily , Weekly | |
| Add CLMT to Watchlist: View: Get Complete CLMT Trend Analysis ➞ | |
 | LOMA Loma Negra Compania Industrial Argentina Sociedad Anonima ADR |
| Sector: Materials | |
| SubSector: Building Materials | |
| MarketCap: 1072.8 Millions | |
| Recent Price: 7.46 Smart Investing & Trading Score: 10 | |
| Day Percent Change: -2.61097% Day Change: 0.12 | |
| Week Change: -6.399% Year-to-date Change: -40.6% | |
| LOMA Links: Profile News Message Board | |
| Charts:- Daily , Weekly | |
| Add LOMA to Watchlist: View: Get Complete LOMA Trend Analysis ➞ | |
 | SMTS Sierra Metals Inc. |
| Sector: Materials | |
| SubSector: Industrial Metals & Minerals | |
| MarketCap: 124.91 Millions | |
| Recent Price: 0.29 Smart Investing & Trading Score: 80 | |
| Day Percent Change: -2.65781% Day Change: -9999 | |
| Week Change: 67.4286% Year-to-date Change: 0.0% | |
| SMTS Links: Profile News Message Board | |
| Charts:- Daily , Weekly | |
| Add SMTS to Watchlist: View: Get Complete SMTS Trend Analysis ➞ | |
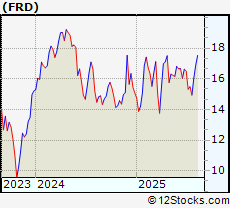 | FRD Friedman Industries, Inc |
| Sector: Materials | |
| SubSector: Steel | |
| MarketCap: 153.33 Millions | |
| Recent Price: 21.32 Smart Investing & Trading Score: 60 | |
| Day Percent Change: -2.67062% Day Change: 0.58 | |
| Week Change: 0.803783% Year-to-date Change: 44.2% | |
| FRD Links: Profile News Message Board | |
| Charts:- Daily , Weekly | |
| Add FRD to Watchlist: View: Get Complete FRD Trend Analysis ➞ | |
 | HL Hecla Mining Co |
| Sector: Materials | |
| SubSector: Other Precious Metals & Mining | |
| MarketCap: 6043.25 Millions | |
| Recent Price: 11.03 Smart Investing & Trading Score: 60 | |
| Day Percent Change: -2.81938% Day Change: 0.09 | |
| Week Change: 8.34971% Year-to-date Change: 110.0% | |
| HL Links: Profile News Message Board | |
| Charts:- Daily , Weekly | |
| Add HL to Watchlist: View: Get Complete HL Trend Analysis ➞ | |
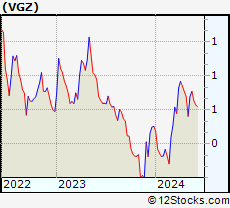 | VGZ Vista Gold Corp |
| Sector: Materials | |
| SubSector: Gold | |
| MarketCap: 171.5 Millions | |
| Recent Price: 2.04 Smart Investing & Trading Score: 70 | |
| Day Percent Change: -2.85714% Day Change: 0.02 | |
| Week Change: 42.6573% Year-to-date Change: 254.5% | |
| VGZ Links: Profile News Message Board | |
| Charts:- Daily , Weekly | |
| Add VGZ to Watchlist: View: Get Complete VGZ Trend Analysis ➞ | |
 | AG First Majestic Silver Corporation |
| Sector: Materials | |
| SubSector: Silver | |
| MarketCap: 4434 Millions | |
| Recent Price: 10.05 Smart Investing & Trading Score: 50 | |
| Day Percent Change: -3.08582% Day Change: 0.18 | |
| Week Change: 9.95624% Year-to-date Change: 69.2% | |
| AG Links: Profile News Message Board | |
| Charts:- Daily , Weekly | |
| Add AG to Watchlist: View: Get Complete AG Trend Analysis ➞ | |
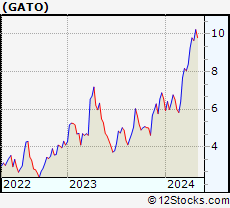 | GATO Gatos Silver, Inc. |
| Sector: Materials | |
| SubSector: Other Precious Metals & Mining | |
| MarketCap: 41237 Millions | |
| Recent Price: 14.40 Smart Investing & Trading Score: 20 | |
| Day Percent Change: -3.09556% Day Change: -9999 | |
| Week Change: -2.10741% Year-to-date Change: -4.9% | |
| GATO Links: Profile News Message Board | |
| Charts:- Daily , Weekly | |
| Add GATO to Watchlist: View: Get Complete GATO Trend Analysis ➞ | |
 | KRO Kronos Worldwide, Inc |
| Sector: Materials | |
| SubSector: Specialty Chemicals | |
| MarketCap: 713.33 Millions | |
| Recent Price: 6.03 Smart Investing & Trading Score: 20 | |
| Day Percent Change: -3.21027% Day Change: 0.02 | |
| Week Change: -4.13355% Year-to-date Change: -35.1% | |
| KRO Links: Profile News Message Board | |
| Charts:- Daily , Weekly | |
| Add KRO to Watchlist: View: Get Complete KRO Trend Analysis ➞ | |
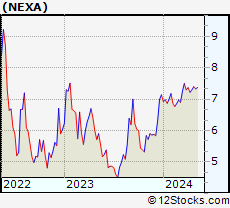 | NEXA Nexa Resources S.A |
| Sector: Materials | |
| SubSector: Other Industrial Metals & Mining | |
| MarketCap: 641 Millions | |
| Recent Price: 5.09 Smart Investing & Trading Score: 90 | |
| Day Percent Change: -3.23194% Day Change: 0.05 | |
| Week Change: 6.04167% Year-to-date Change: -27.8% | |
| NEXA Links: Profile News Message Board | |
| Charts:- Daily , Weekly | |
| Add NEXA to Watchlist: View: Get Complete NEXA Trend Analysis ➞ | |
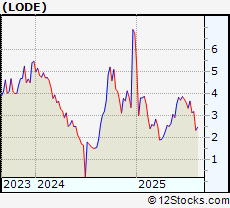 | LODE Comstock Inc |
| Sector: Materials | |
| SubSector: Other Precious Metals & Mining | |
| MarketCap: 117.25 Millions | |
| Recent Price: 2.86 Smart Investing & Trading Score: 30 | |
| Day Percent Change: -3.37838% Day Change: 0.06 | |
| Week Change: 17.6955% Year-to-date Change: -61.4% | |
| LODE Links: Profile News Message Board | |
| Charts:- Daily , Weekly | |
| Add LODE to Watchlist: View: Get Complete LODE Trend Analysis ➞ | |
 | AKG Asanko Gold Inc. |
| Sector: Materials | |
| SubSector: Gold | |
| MarketCap: 175.619 Millions | |
| Recent Price: 16.87 Smart Investing & Trading Score: 0 | |
| Day Percent Change: -3.37915% Day Change: -9999 | |
| Week Change: -19.4365% Year-to-date Change: 0.0% | |
| AKG Links: Profile News Message Board | |
| Charts:- Daily , Weekly | |
| Add AKG to Watchlist: View: Get Complete AKG Trend Analysis ➞ | |
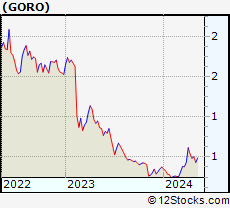 | GORO Gold Resource Corp |
| Sector: Materials | |
| SubSector: Gold | |
| MarketCap: 102.75 Millions | |
| Recent Price: 0.72 Smart Investing & Trading Score: 60 | |
| Day Percent Change: -3.49287% Day Change: 0 | |
| Week Change: -7.45334% Year-to-date Change: 226.1% | |
| GORO Links: Profile News Message Board | |
| Charts:- Daily , Weekly | |
| Add GORO to Watchlist: View: Get Complete GORO Trend Analysis ➞ | |
 | NUE Nucor Corp |
| Sector: Materials | |
| SubSector: Steel | |
| MarketCap: 33801.4 Millions | |
| Recent Price: 137.39 Smart Investing & Trading Score: 30 | |
| Day Percent Change: -3.78852% Day Change: -5.41 | |
| Week Change: -3.16465% Year-to-date Change: 21.1% | |
| NUE Links: Profile News Message Board | |
| Charts:- Daily , Weekly | |
| Add NUE to Watchlist: View: Get Complete NUE Trend Analysis ➞ | |
 | MERC Mercer International Inc |
| Sector: Materials | |
| SubSector: Paper & Paper Products | |
| MarketCap: 216.35 Millions | |
| Recent Price: 3.05 Smart Investing & Trading Score: 20 | |
| Day Percent Change: -3.78549% Day Change: 0.06 | |
| Week Change: -4.6875% Year-to-date Change: -50.7% | |
| MERC Links: Profile News Message Board | |
| Charts:- Daily , Weekly | |
| Add MERC to Watchlist: View: Get Complete MERC Trend Analysis ➞ | |
 | SLVM Sylvamo Corp |
| Sector: Materials | |
| SubSector: Paper & Paper Products | |
| MarketCap: 1832.11 Millions | |
| Recent Price: 44.47 Smart Investing & Trading Score: 30 | |
| Day Percent Change: -3.86% Day Change: -1.67 | |
| Week Change: -6.94% Year-to-date Change: -46.2% | |
| SLVM Links: Profile News Message Board | |
| Charts:- Daily , Weekly | |
| Add SLVM to Watchlist: View: Get Complete SLVM Trend Analysis ➞ | |
 | MPVD Mountain Province Diamonds Inc. |
| Sector: Materials | |
| SubSector: Industrial Metals & Minerals | |
| MarketCap: 581.66 Millions | |
| Recent Price: 10.23 Smart Investing & Trading Score: 80 | |
| Day Percent Change: -4.39252% Day Change: -9999 | |
| Week Change: 22.6619% Year-to-date Change: 0.0% | |
| MPVD Links: Profile News Message Board | |
| Charts:- Daily , Weekly | |
| Add MPVD to Watchlist: View: Get Complete MPVD Trend Analysis ➞ | |
 | AMRS Amyris, Inc. |
| Sector: Materials | |
| SubSector: Specialty Chemicals | |
| MarketCap: 261.857 Millions | |
| Recent Price: 18.23 Smart Investing & Trading Score: 70 | |
| Day Percent Change: -4.90349% Day Change: -9999 | |
| Week Change: 36360% Year-to-date Change: 0.0% | |
| AMRS Links: Profile News Message Board | |
| Charts:- Daily , Weekly | |
| Add AMRS to Watchlist: View: Get Complete AMRS Trend Analysis ➞ | |
 | BIOX Bioceres Crop Solutions Corp |
| Sector: Materials | |
| SubSector: Agricultural Inputs | |
| MarketCap: 169.95 Millions | |
| Recent Price: 1.81 Smart Investing & Trading Score: 0 | |
| Day Percent Change: -5.2356% Day Change: 0.24 | |
| Week Change: -19.1964% Year-to-date Change: -73.1% | |
| BIOX Links: Profile News Message Board | |
| Charts:- Daily , Weekly | |
| Add BIOX to Watchlist: View: Get Complete BIOX Trend Analysis ➞ | |
| For tabular summary view of above stock list: Summary View ➞ 0 - 25 , 25 - 50 , 50 - 75 , 75 - 100 , 100 - 125 , 125 - 150 , 150 - 175 , 175 - 200 , 200 - 225 , 225 - 250 , 250 - 275 | ||
| Click To Change The Sort Order: By Market Cap or Company Size Performance: Year-to-date, Week and Day | |
| Select Chart Type: | ||
|
Best Stocks Today 12Stocks.com |
© 2025 12Stocks.com Terms & Conditions Privacy Contact Us
All Information Provided Only For Education And Not To Be Used For Investing or Trading. See Terms & Conditions


One More Thing ... Get Best Stocks Delivered Daily!
Never Ever Miss A Move With Our Top Ten Stocks Lists
Find Best Stocks In Any Market - Bull or Bear Market
Take A Peek At Our Top Ten Stocks Lists: Daily, Weekly, Year-to-Date & Top Trends
Find Best Stocks In Any Market - Bull or Bear Market
Take A Peek At Our Top Ten Stocks Lists: Daily, Weekly, Year-to-Date & Top Trends
Materials Stocks With Best Up Trends [0-bearish to 100-bullish]: Livent [100], Gevo [100], United States[100], Rayonier Advanced[100], Endeavour Silver[100], Turquoise Hill[100], Chemtura [100], Steel Dynamics[100], Nevsun [100], Cementos Pacasmayo[100], Century Aluminum[100]
Best Materials Stocks Year-to-Date:
Americas Gold[620.513%], Avino Silver[353.794%], MP [307.627%], Vista Gold[254.536%], Gold [226.081%], United States[223.699%], Tower[214.225%], SSR [203.343%], Gold Royalty[193.548%], Flexible [183.834%], Gold Fields[175.1%] Best Materials Stocks This Week:
PolyOne [59833200%], Amyris [36360%], Chemtura [3703.85%], Golden Star[1837.95%], Alexco [690.301%], Hi-Crush Partners[626.496%], Yamana Gold[625.812%], Aluminum [516.255%], Monsanto [465.839%], Turquoise Hill[433.11%], Mechel PAO[418.222%] Best Materials Stocks Daily:
Livent [140.6%], Grupo Simec[12.2572%], Arch Coal[8.71849%], Gevo [8.46561%], IperionX [5.96%], United States[5.26316%], Rayonier Advanced[5.14372%], Sibanye Gold[5.06135%], Synalloy [5.05051%], Endeavour Silver[4.50161%], i-80 Gold[4.465%]