
 Login Sign Up


| |||||
 |  | ||||

| 12Stocks.com Market Intelligence |
Best Industrial Stocks
| In a hurry? Industrial Stocks Lists: Performance Trends Table, Stock Charts
Sort Industrial stocks: Daily, Weekly, Year-to-Date, Market Cap & Trends. Filter Industrial stocks list by size:All Industrial Large Mid-Range Small |
| 12Stocks.com Industrial Stocks Performances & Trends Daily | |||||||||
|
|  The overall Smart Investing & Trading Score is 78 (0-bearish to 100-bullish) which puts Industrial sector in short term neutral to bullish trend. The Smart Investing & Trading Score from previous trading session is 78 and hence a deterioration of trend.
| ||||||||
Here are the Smart Investing & Trading Scores of the most requested Industrial stocks at 12Stocks.com (click stock name for detailed review):
|


| 12Stocks.com: Investing in Industrial sector with Stocks | |
|
The following table helps investors and traders sort through current performance and trends (as measured by Smart Investing & Trading Score) of various
stocks in the Industrial sector. Quick View: Move mouse or cursor over stock symbol (ticker) to view short-term Technical chart and over stock name to view long term chart. Click on  to add stock symbol to your watchlist and to add stock symbol to your watchlist and  to view watchlist. Click on any ticker or stock name for detailed market intelligence report for that stock. to view watchlist. Click on any ticker or stock name for detailed market intelligence report for that stock. |
12Stocks.com Performance of Stocks in Industrial Sector
| Ticker | Stock Name | Watchlist | Category | Recent Price | Smart Investing & Trading Score | Change % | Weekly Change% |
| SMR | NuScale Power |   | Specialty Industrial Machinery | 42.12 | 95 | 12.38% | 12.38% |
| RKLB | Rocket Lab | | Aerospace & Defense | 43.21 | 100 | 10.71% | 10.71% |
| SLDP | Solid Power | | Electrical Equipment & Parts | 2.67 | 90 | 7.23% | 7.23% |
| RDW | Redwire | | Aerospace & Defense | 17.73 | 100 | 6.55% | 6.55% |
| HTZ | Hertz Global | | Rental & Leasing | 7.91 | 88 | 4.91% | 4.91% |
| JOBY | Joby Aviation | | Airports & Air | 12.63 | 100 | 4.90% | 4.90% |
| AMPX | Amprius Technologies | | Electrical Equipment & Parts | 6.73 | 95 | 4.50% | 4.50% |
| ENVX | Enovix | | Electrical Equipment & Parts | 14.65 | 95 | 4.12% | 4.12% |
| AGX | Argan | | Heavy Construction | 220.73 | 78 | 4.00% | 4.00% |
| AMSC | American Superconductor | | Electrical Equipment | 40.71 | 85 | 3.93% | 3.93% |
| DCO | Ducommun | | Aerospace/Defense | 88.46 | 95 | 3.21% | 3.21% |
| FLR | Fluor | | Heavy Construction | 53.81 | 95 | 2.95% | 2.95% |
| CW | Curtiss-Wright | | Machinery | 487.14 | 75 | 2.93% | 2.93% |
| PCT | PureCycle Technologies | | Pollution & Treatment Controls | 15.69 | 95 | 2.89% | 2.89% |
| SPCE | Virgin Galactic | | Conglomerates | 3.21 | 90 | 2.88% | 2.88% |
| ACHR | Archer Aviation | | Aerospace & Defense | 10.80 | 81 | 2.76% | 2.76% |
| GE | General Electric | | Machinery | 262.34 | 95 | 2.71% | 2.71% |
| WWD | Woodward | | Aerospace/Defense | 251.56 | 83 | 2.62% | 2.62% |
| NPK | National Presto | | Aerospace/Defense | 105.70 | 76 | 2.59% | 2.59% |
| NNBR | NN | | Machine Tools | 2.16 | 68 | 2.37% | 2.37% |
| SST | System1 | | Specialty | 6.33 | 76 | 2.26% | 2.26% |
| HEI | HEICO | | Aerospace/Defense | 321.60 | 68 | 2.16% | 2.16% |
| CDRE | Cadre | | Aerospace & Defense | 33.45 | 100 | 2.08% | 2.08% |
| TDG | TransDigm | | Aerospace/Defense | 1574.85 | 100 | 2.06% | 2.06% |
| SKYH | Sky Harbour | | Aerospace & Defense | 10.20 | 64 | 2.00% | 2.00% |
| For chart view version of above stock list: Chart View ➞ 0 - 25 , 25 - 50 , 50 - 75 , 75 - 100 , 100 - 125 , 125 - 150 , 150 - 175 , 175 - 200 , 200 - 225 , 225 - 250 | ||
 | Click To Change The Sort Order: By Market Cap or Company Size Performance: Year-to-date, Week and Day |  |
|
Get the most comprehensive stock market coverage daily at 12Stocks.com ➞ Best Stocks Today ➞ Best Stocks Weekly ➞ Best Stocks Year-to-Date ➞ Best Stocks Trends ➞  Best Stocks Today 12Stocks.com Best Nasdaq Stocks ➞ Best S&P 500 Stocks ➞ Best Tech Stocks ➞ Best Biotech Stocks ➞ |
| Detailed Overview of Industrial Stocks |
| Industrial Technical Overview, Leaders & Laggards, Top Industrial ETF Funds & Detailed Industrial Stocks List, Charts, Trends & More |
| Industrial Sector: Technical Analysis, Trends & YTD Performance | |
| Industrial sector is composed of stocks
from industrial machinery, aerospace, defense, farm/construction
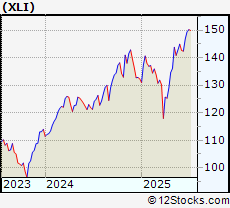
and industrial services subsectors. Industrial sector, as represented by XLI, an exchange-traded fund [ETF] that holds basket of Industrial stocks (e.g, Caterpillar, Boeing) is up by 14.96% and is currently outperforming the overall market by 8.41% year-to-date. Below is a quick view of Technical charts and trends: |
|
 XLI Weekly Chart |
|
| Long Term Trend: Very Good | |
| Medium Term Trend: Good | |
 XLI Daily Chart |
|
| Short Term Trend: Good | |
| Overall Trend Score: 78 | |
| YTD Performance: 14.96% | |
| **Trend Scores & Views Are Only For Educational Purposes And Not For Investing | |
| 12Stocks.com: Top Performing Industrial Sector Stocks | ||||||||||||||||||||||||||||||||||||||||||||||||
 The top performing Industrial sector stocks year to date are
Now, more recently, over last week, the top performing Industrial sector stocks on the move are


|
||||||||||||||||||||||||||||||||||||||||||||||||
| 12Stocks.com: Investing in Industrial Sector using Exchange Traded Funds | |
|
The following table shows list of key exchange traded funds (ETF) that
help investors track Industrial Index. For detailed view, check out our ETF Funds section of our website. Quick View: Move mouse or cursor over ETF symbol (ticker) to view short-term Technical chart and over ETF name to view long term chart. Click on ticker or stock name for detailed view. Click on to add stock symbol to your watchlist and to view watchlist. |
12Stocks.com List of ETFs that track Industrial Index
| Ticker | ETF Name | Watchlist | Recent Price | Smart Investing & Trading Score | Change % | Week % | Year-to-date % |
| XLI | Industrial | | 151.01 | 78 | 0.54 | 0.54 | 14.96% |
| UXI | Industrials | | 45.03 | 90 | 1.07 | 1.07 | 24.17% |
| PPA | Aerospace & Defense | | 145.19 | 95 | 1.67 | 1.67 | 26.6% |
| ITA | Aerospace & Defense | | 193.64 | 95 | 2.03 | 2.03 | 33.44% |
| ITB | Home Construction | | 98.02 | 68 | -0.74 | -0.74 | -4.54% |
| XHB | Homebuilders | | 104.02 | 68 | -0.7 | -0.7 | -0.14% |
| SIJ | Short Industrials | | 12.10 | 46 | -1.13 | -1.13 | 45.13% |
| 12Stocks.com: Charts, Trends, Fundamental Data and Performances of Industrial Stocks | |
|
We now take in-depth look at all Industrial stocks including charts, multi-period performances and overall trends (as measured by Smart Investing & Trading Score). One can sort Industrial stocks (click link to choose) by Daily, Weekly and by Year-to-Date performances. Also, one can sort by size of the company or by market capitalization. |
| Select Your Default Chart Type: | |||||
| |||||
| Click on stock symbol or name for detailed view. Click on to add stock symbol to your watchlist and to view watchlist. Quick View: Move mouse or cursor over "Daily" to quickly view daily Technical stock chart and over "Weekly" to view weekly Technical stock chart. | |||||

 | SMR NuScale Power Corporation |
| Sector: Industrials | |
| SubSector: Specialty Industrial Machinery | |
| MarketCap: 1510 Millions | |
| Recent Price: 42.12 Smart Investing & Trading Score: 95 | |
| Day Percent Change: 12.38% Day Change: 4.64 | |
| Week Change: 12.38% Year-to-date Change: 134.9% | |
| SMR Links: Profile News Message Board | |
| Charts:- Daily , Weekly | |
| Add SMR to Watchlist: View: Get Complete SMR Trend Analysis ➞ | |
 | RKLB Rocket Lab USA, Inc. |
| Sector: Industrials | |
| SubSector: Aerospace & Defense | |
| MarketCap: 2820 Millions | |
| Recent Price: 43.21 Smart Investing & Trading Score: 100 | |
| Day Percent Change: 10.71% Day Change: 4.18 | |
| Week Change: 10.71% Year-to-date Change: 69.7% | |
| RKLB Links: Profile News Message Board | |
| Charts:- Daily , Weekly | |
| Add RKLB to Watchlist: View: Get Complete RKLB Trend Analysis ➞ | |
 | SLDP Solid Power, Inc. |
| Sector: Industrials | |
| SubSector: Electrical Equipment & Parts | |
| MarketCap: 445 Millions | |
| Recent Price: 2.67 Smart Investing & Trading Score: 90 | |
| Day Percent Change: 7.23% Day Change: 0.18 | |
| Week Change: 7.23% Year-to-date Change: 41.3% | |
| SLDP Links: Profile News Message Board | |
| Charts:- Daily , Weekly | |
| Add SLDP to Watchlist: View: Get Complete SLDP Trend Analysis ➞ | |
 | RDW Redwire Corporation |
| Sector: Industrials | |
| SubSector: Aerospace & Defense | |
| MarketCap: 160 Millions | |
| Recent Price: 17.73 Smart Investing & Trading Score: 100 | |
| Day Percent Change: 6.55% Day Change: 1.09 | |
| Week Change: 6.55% Year-to-date Change: 7.7% | |
| RDW Links: Profile News Message Board | |
| Charts:- Daily , Weekly | |
| Add RDW to Watchlist: View: Get Complete RDW Trend Analysis ➞ | |
 | HTZ Hertz Global Holdings, Inc. |
| Sector: Industrials | |
| SubSector: Rental & Leasing Services | |
| MarketCap: 5830 Millions | |
| Recent Price: 7.91 Smart Investing & Trading Score: 88 | |
| Day Percent Change: 4.91% Day Change: 0.37 | |
| Week Change: 4.91% Year-to-date Change: 116.1% | |
| HTZ Links: Profile News Message Board | |
| Charts:- Daily , Weekly | |
| Add HTZ to Watchlist: View: Get Complete HTZ Trend Analysis ➞ | |
 | JOBY Joby Aviation, Inc. |
| Sector: Industrials | |
| SubSector: Airports & Air Services | |
| MarketCap: 5810 Millions | |
| Recent Price: 12.63 Smart Investing & Trading Score: 100 | |
| Day Percent Change: 4.9% Day Change: 0.59 | |
| Week Change: 4.9% Year-to-date Change: 55.4% | |
| JOBY Links: Profile News Message Board | |
| Charts:- Daily , Weekly | |
| Add JOBY to Watchlist: View: Get Complete JOBY Trend Analysis ➞ | |
 | AMPX Amprius Technologies, Inc. |
| Sector: Industrials | |
| SubSector: Electrical Equipment & Parts | |
| MarketCap: 608 Millions | |
| Recent Price: 6.73 Smart Investing & Trading Score: 95 | |
| Day Percent Change: 4.5% Day Change: 0.29 | |
| Week Change: 4.5% Year-to-date Change: 140.4% | |
| AMPX Links: Profile News Message Board | |
| Charts:- Daily , Weekly | |
| Add AMPX to Watchlist: View: Get Complete AMPX Trend Analysis ➞ | |
 | ENVX Enovix Corporation |
| Sector: Industrials | |
| SubSector: Electrical Equipment & Parts | |
| MarketCap: 2740 Millions | |
| Recent Price: 14.65 Smart Investing & Trading Score: 95 | |
| Day Percent Change: 4.12% Day Change: 0.58 | |
| Week Change: 4.12% Year-to-date Change: 34.8% | |
| ENVX Links: Profile News Message Board | |
| Charts:- Daily , Weekly | |
| Add ENVX to Watchlist: View: Get Complete ENVX Trend Analysis ➞ | |
 | AGX Argan, Inc. |
| Sector: Industrials | |
| SubSector: Heavy Construction | |
| MarketCap: 664.095 Millions | |
| Recent Price: 220.73 Smart Investing & Trading Score: 78 | |
| Day Percent Change: 4% Day Change: 8.48 | |
| Week Change: 4% Year-to-date Change: 61.9% | |
| AGX Links: Profile News Message Board | |
| Charts:- Daily , Weekly | |
| Add AGX to Watchlist: View: Get Complete AGX Trend Analysis ➞ | |
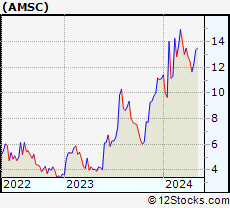 | AMSC American Superconductor Corporation |
| Sector: Industrials | |
| SubSector: Industrial Electrical Equipment | |
| MarketCap: 114.879 Millions | |
| Recent Price: 40.71 Smart Investing & Trading Score: 85 | |
| Day Percent Change: 3.93% Day Change: 1.54 | |
| Week Change: 3.93% Year-to-date Change: 65.3% | |
| AMSC Links: Profile News Message Board | |
| Charts:- Daily , Weekly | |
| Add AMSC to Watchlist: View: Get Complete AMSC Trend Analysis ➞ | |
 | DCO Ducommun Incorporated |
| Sector: Industrials | |
| SubSector: Aerospace/Defense Products & Services | |
| MarketCap: 261.101 Millions | |
| Recent Price: 88.46 Smart Investing & Trading Score: 95 | |
| Day Percent Change: 3.21% Day Change: 2.75 | |
| Week Change: 3.21% Year-to-date Change: 39.0% | |
| DCO Links: Profile News Message Board | |
| Charts:- Daily , Weekly | |
| Add DCO to Watchlist: View: Get Complete DCO Trend Analysis ➞ | |
 | FLR Fluor Corporation |
| Sector: Industrials | |
| SubSector: Heavy Construction | |
| MarketCap: 891.495 Millions | |
| Recent Price: 53.81 Smart Investing & Trading Score: 95 | |
| Day Percent Change: 2.95% Day Change: 1.54 | |
| Week Change: 2.95% Year-to-date Change: 9.1% | |
| FLR Links: Profile News Message Board | |
| Charts:- Daily , Weekly | |
| Add FLR to Watchlist: View: Get Complete FLR Trend Analysis ➞ | |
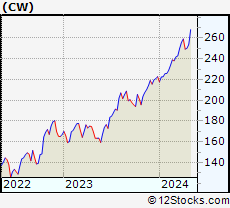 | CW Curtiss-Wright Corporation |
| Sector: Industrials | |
| SubSector: Diversified Machinery | |
| MarketCap: 4057.56 Millions | |
| Recent Price: 487.14 Smart Investing & Trading Score: 75 | |
| Day Percent Change: 2.93% Day Change: 13.87 | |
| Week Change: 2.93% Year-to-date Change: 37.4% | |
| CW Links: Profile News Message Board | |
| Charts:- Daily , Weekly | |
| Add CW to Watchlist: View: Get Complete CW Trend Analysis ➞ | |
 | PCT PureCycle Technologies, Inc. |
| Sector: Industrials | |
| SubSector: Pollution & Treatment Controls | |
| MarketCap: 1610 Millions | |
| Recent Price: 15.69 Smart Investing & Trading Score: 95 | |
| Day Percent Change: 2.89% Day Change: 0.44 | |
| Week Change: 2.89% Year-to-date Change: 53.1% | |
| PCT Links: Profile News Message Board | |
| Charts:- Daily , Weekly | |
| Add PCT to Watchlist: View: Get Complete PCT Trend Analysis ➞ | |
 | SPCE Virgin Galactic Holdings, Inc. |
| Sector: Industrials | |
| SubSector: Conglomerates | |
| MarketCap: 2612.48 Millions | |
| Recent Price: 3.21 Smart Investing & Trading Score: 90 | |
| Day Percent Change: 2.88% Day Change: 0.09 | |
| Week Change: 2.88% Year-to-date Change: -45.4% | |
| SPCE Links: Profile News Message Board | |
| Charts:- Daily , Weekly | |
| Add SPCE to Watchlist: View: Get Complete SPCE Trend Analysis ➞ | |
 | ACHR Archer Aviation Inc. |
| Sector: Industrials | |
| SubSector: Aerospace & Defense | |
| MarketCap: 976 Millions | |
| Recent Price: 10.80 Smart Investing & Trading Score: 81 | |
| Day Percent Change: 2.76% Day Change: 0.29 | |
| Week Change: 2.76% Year-to-date Change: 10.8% | |
| ACHR Links: Profile News Message Board | |
| Charts:- Daily , Weekly | |
| Add ACHR to Watchlist: View: Get Complete ACHR Trend Analysis ➞ | |
 | GE General Electric Company |
| Sector: Industrials | |
| SubSector: Diversified Machinery | |
| MarketCap: 64710.6 Millions | |
| Recent Price: 262.34 Smart Investing & Trading Score: 95 | |
| Day Percent Change: 2.71% Day Change: 6.92 | |
| Week Change: 2.71% Year-to-date Change: 57.6% | |
| GE Links: Profile News Message Board | |
| Charts:- Daily , Weekly | |
| Add GE to Watchlist: View: Get Complete GE Trend Analysis ➞ | |
 | WWD Woodward, Inc. |
| Sector: Industrials | |
| SubSector: Aerospace/Defense Products & Services | |
| MarketCap: 3764.01 Millions | |
| Recent Price: 251.56 Smart Investing & Trading Score: 83 | |
| Day Percent Change: 2.62% Day Change: 6.42 | |
| Week Change: 2.62% Year-to-date Change: 51.4% | |
| WWD Links: Profile News Message Board | |
| Charts:- Daily , Weekly | |
| Add WWD to Watchlist: View: Get Complete WWD Trend Analysis ➞ | |
 | NPK National Presto Industries, Inc. |
| Sector: Industrials | |
| SubSector: Aerospace/Defense Products & Services | |
| MarketCap: 540.401 Millions | |
| Recent Price: 105.70 Smart Investing & Trading Score: 76 | |
| Day Percent Change: 2.59% Day Change: 2.67 | |
| Week Change: 2.59% Year-to-date Change: 8.5% | |
| NPK Links: Profile News Message Board | |
| Charts:- Daily , Weekly | |
| Add NPK to Watchlist: View: Get Complete NPK Trend Analysis ➞ | |
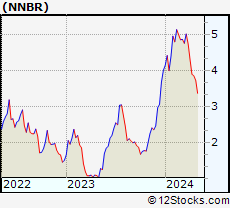 | NNBR NN, Inc. |
| Sector: Industrials | |
| SubSector: Machine Tools & Accessories | |
| MarketCap: 103.348 Millions | |
| Recent Price: 2.16 Smart Investing & Trading Score: 68 | |
| Day Percent Change: 2.37% Day Change: 0.05 | |
| Week Change: 2.37% Year-to-date Change: -33.9% | |
| NNBR Links: Profile News Message Board | |
| Charts:- Daily , Weekly | |
| Add NNBR to Watchlist: View: Get Complete NNBR Trend Analysis ➞ | |
 | SST System1, Inc. |
| Sector: Industrials | |
| SubSector: Specialty Business Services | |
| MarketCap: 504 Millions | |
| Recent Price: 6.33 Smart Investing & Trading Score: 76 | |
| Day Percent Change: 2.26% Day Change: 0.14 | |
| Week Change: 2.26% Year-to-date Change: 604.7% | |
| SST Links: Profile News Message Board | |
| Charts:- Daily , Weekly | |
| Add SST to Watchlist: View: Get Complete SST Trend Analysis ➞ | |
 | HEI HEICO Corporation |
| Sector: Industrials | |
| SubSector: Aerospace/Defense Products & Services | |
| MarketCap: 10023.1 Millions | |
| Recent Price: 321.60 Smart Investing & Trading Score: 68 | |
| Day Percent Change: 2.16% Day Change: 6.79 | |
| Week Change: 2.16% Year-to-date Change: 35.3% | |
| HEI Links: Profile News Message Board | |
| Charts:- Daily , Weekly | |
| Add HEI to Watchlist: View: Get Complete HEI Trend Analysis ➞ | |
 | CDRE Cadre Holdings, Inc. |
| Sector: Industrials | |
| SubSector: Aerospace & Defense | |
| MarketCap: 817 Millions | |
| Recent Price: 33.45 Smart Investing & Trading Score: 100 | |
| Day Percent Change: 2.08% Day Change: 0.68 | |
| Week Change: 2.08% Year-to-date Change: 3.8% | |
| CDRE Links: Profile News Message Board | |
| Charts:- Daily , Weekly | |
| Add CDRE to Watchlist: View: Get Complete CDRE Trend Analysis ➞ | |
 | TDG TransDigm Group Incorporated |
| Sector: Industrials | |
| SubSector: Aerospace/Defense Products & Services | |
| MarketCap: 18441 Millions | |
| Recent Price: 1574.85 Smart Investing & Trading Score: 100 | |
| Day Percent Change: 2.06% Day Change: 31.81 | |
| Week Change: 2.06% Year-to-date Change: 24.3% | |
| TDG Links: Profile News Message Board | |
| Charts:- Daily , Weekly | |
| Add TDG to Watchlist: View: Get Complete TDG Trend Analysis ➞ | |
 | SKYH Sky Harbour Group Corporation |
| Sector: Industrials | |
| SubSector: Aerospace & Defense | |
| MarketCap: 271 Millions | |
| Recent Price: 10.20 Smart Investing & Trading Score: 64 | |
| Day Percent Change: 2% Day Change: 0.2 | |
| Week Change: 2% Year-to-date Change: -14.5% | |
| SKYH Links: Profile News Message Board | |
| Charts:- Daily , Weekly | |
| Add SKYH to Watchlist: View: Get Complete SKYH Trend Analysis ➞ | |
| For tabular summary view of above stock list: Summary View ➞ 0 - 25 , 25 - 50 , 50 - 75 , 75 - 100 , 100 - 125 , 125 - 150 , 150 - 175 , 175 - 200 , 200 - 225 , 225 - 250 | ||
| Click To Change The Sort Order: By Market Cap or Company Size Performance: Year-to-date, Week and Day | |
| Select Chart Type: | ||
|
Best Stocks Today 12Stocks.com |
© 2025 12Stocks.com Terms & Conditions Privacy Contact Us
All Information Provided Only For Education And Not To Be Used For Investing or Trading. See Terms & Conditions


One More Thing ... Get Best Stocks Delivered Daily!
Never Ever Miss A Move With Our Top Ten Stocks Lists
Find Best Stocks In Any Market - Bull or Bear Market
Take A Peek At Our Top Ten Stocks Lists: Daily, Weekly, Year-to-Date & Top Trends
Find Best Stocks In Any Market - Bull or Bear Market
Take A Peek At Our Top Ten Stocks Lists: Daily, Weekly, Year-to-Date & Top Trends
Industrial Stocks With Best Up Trends [0-bearish to 100-bullish]: Rocket Lab[100], Redwire [100], Joby Aviation[100], Cadre [100], TransDigm [100], Spirit AeroSystems[100], Boeing [100], Northrop Grumman[100], NuScale Power[95], Amprius Technologies[95], Enovix [95]
Best Industrial Stocks Year-to-Date:
System1 [604.66%], Amprius Technologies[140.36%], NuScale Power[134.91%], Astronics [124.19%], Hertz Global[116.12%], Tutor Perini[104.59%], AeroVironment [72.2%], Rocket Lab[69.65%], American Superconductor[65.29%], Allegheny Technologies[64.59%], Carpenter Technology[64.42%] Best Industrial Stocks This Week:
NuScale Power[12.38%], Rocket Lab[10.71%], Solid Power[7.23%], Redwire [6.55%], Hertz Global[4.91%], Joby Aviation[4.9%], Amprius Technologies[4.5%], Enovix [4.12%], Argan [4%], American Superconductor[3.93%], Ducommun [3.21%] Best Industrial Stocks Daily:
NuScale Power[12.38%], Rocket Lab[10.71%], Solid Power[7.23%], Redwire [6.55%], Hertz Global[4.91%], Joby Aviation[4.9%], Amprius Technologies[4.5%], Enovix [4.12%], Argan [4%], American Superconductor[3.93%], Ducommun [3.21%]