
 Login Sign Up


| |||||
 |  | ||||

| 12Stocks.com Market Intelligence |
Best Industrial Stocks
| In a hurry? Industrial Stocks Lists: Performance Trends Table, Stock Charts
Sort Industrial stocks: Daily, Weekly, Year-to-Date, Market Cap & Trends. Filter Industrial stocks list by size:All Industrial Large Mid-Range Small |
| 12Stocks.com Industrial Stocks Performances & Trends Daily | |||||||||
|
|  The overall Smart Investing & Trading Score is 80 (0-bearish to 100-bullish) which puts Industrial sector in short term neutral to bullish trend. The Smart Investing & Trading Score from previous trading session is 80 and an improvement of trend continues.
| ||||||||
Here are the Smart Investing & Trading Scores of the most requested Industrial stocks at 12Stocks.com (click stock name for detailed review):
|

| 12Stocks.com: Investing in Industrial sector with Stocks | |
|
The following table helps investors and traders sort through current performance and trends (as measured by Smart Investing & Trading Score) of various
stocks in the Industrial sector. Quick View: Move mouse or cursor over stock symbol (ticker) to view short-term Technical chart and over stock name to view long term chart. Click on  to add stock symbol to your watchlist and to add stock symbol to your watchlist and  to view watchlist. Click on any ticker or stock name for detailed market intelligence report for that stock. to view watchlist. Click on any ticker or stock name for detailed market intelligence report for that stock. |
12Stocks.com Performance of Stocks in Industrial Sector
| Ticker | Stock Name | Watchlist | Category | Recent Price | Smart Investing & Trading Score | Change % | Weekly Change% |
| CCS | Century Communities |   | Residential | 63.06 | 80 | 36.23% | 3.96% |
| FIX | Comfort Systems | | Contractors | 718.61 | 100 | 86.98% | 3.93% |
| PSN | Parsons | | Machinery | 80.01 | 100 | 0.10% | 3.91% |
| KBH | KB Home | | Residential | 61.30 | 90 | 5.16% | 3.87% |
| MTZ | MasTec | | Heavy Construction | 184.39 | 70 | 2.17% | 3.76% |
| APOG | Apogee Enterprises | | Building Materials | 43.28 | 80 | 5.03% | 3.76% |
| NPK | National Presto | | Aerospace/Defense | 102.78 | 80 | -8.24% | 3.72% |
| EXP | Eagle Materials | | Cement | 233.73 | 80 | 40.27% | 3.67% |
| MIR | Mirion Technologies | | Specialty Industrial Machinery | 22.29 | 90 | 1.01% | 3.67% |
| LEN | Lennar | | Residential | 124.47 | 100 | 3.50% | 3.64% |
| PL | Planet Labs | | Aerospace & Defense | 6.62 | 70 | 5.38% | 3.60% |
| BA | Boeing | | Aerospace/Defense | 232.61 | 80 | -26.50% | 3.45% |
| WTS | Watts Water | | Equipment | 272.75 | 100 | 2.35% | 3.42% |
| BLDR | Builders FirstSource | | Building Materials | 137.45 | 80 | 20.11% | 3.38% |
| RYI | Ryerson Holding | | Fabrication | 22.08 | 80 | -28.23% | 3.37% |
| RYI | Ryerson Holding | | Fabrication | 9.45 | 80 | -28.23% | 3.37% |
| DHR | Danaher | | Machinery | 205.72 | 80 | 0.76% | 3.36% |
| FSS | Federal Signal | | Pollution & Treatment Controls | 129.80 | 100 | 56.94% | 3.33% |
| SSD | Simpson | | Small Tools & Accessories | 188.38 | 100 | 4.50% | 3.22% |
| VMI | Valmont Industries | | Fabrication | 379.15 | 100 | 1.94% | 3.21% |
| LNN | Lindsay | | Machinery | 140.15 | 90 | 0.85% | 3.12% |
| SPR | Spirit AeroSystems | | Aerospace/Defense | 40.51 | 80 | 0.96% | 3.11% |
| VMC | Vulcan Materials | | Building Materials | 291.89 | 100 | 2.61% | 3.08% |
| TKR | Timken | | Machine Tools | 76.91 | 80 | 2.74% | 3.03% |
| SWK | Stanley Black | | Machine Tools | 71.43 | 80 | 2.52% | 2.98% |
| For chart view version of above stock list: Chart View ➞ 0 - 25 , 25 - 50 , 50 - 75 , 75 - 100 , 100 - 125 , 125 - 150 , 150 - 175 , 175 - 200 , 200 - 225 , 225 - 250 , 250 - 275 | ||
 | Click To Change The Sort Order: By Market Cap or Company Size Performance: Year-to-date, Week and Day |  |
|
Get the most comprehensive stock market coverage daily at 12Stocks.com ➞ Best Stocks Today ➞ Best Stocks Weekly ➞ Best Stocks Year-to-Date ➞ Best Stocks Trends ➞  Best Stocks Today 12Stocks.com Best Nasdaq Stocks ➞ Best S&P 500 Stocks ➞ Best Tech Stocks ➞ Best Biotech Stocks ➞ |
| Detailed Overview of Industrial Stocks |
| Industrial Technical Overview, Leaders & Laggards, Top Industrial ETF Funds & Detailed Industrial Stocks List, Charts, Trends & More |
| Industrial Sector: Technical Analysis, Trends & YTD Performance | |
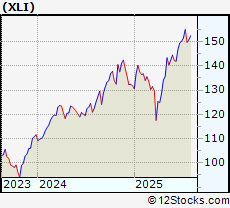
| Industrial sector is composed of stocks
from industrial machinery, aerospace, defense, farm/construction
and industrial services subsectors. Industrial sector, as represented by XLI, an exchange-traded fund [ETF] that holds basket of Industrial stocks (e.g, Caterpillar, Boeing) is up by 16.04% and is currently outperforming the overall market by 6.24% year-to-date. Below is a quick view of Technical charts and trends: |
|
 XLI Weekly Chart |
|
| Long Term Trend: Very Good | |
| Medium Term Trend: Deteriorating | |
 XLI Daily Chart |
|
| Short Term Trend: Very Good | |
| Overall Trend Score: 80 | |
| YTD Performance: 16.04% | |
| **Trend Scores & Views Are Only For Educational Purposes And Not For Investing | |
| 12Stocks.com: Top Performing Industrial Sector Stocks | ||||||||||||||||||||||||||||||||||||||||||||||||
 The top performing Industrial sector stocks year to date are
Now, more recently, over last week, the top performing Industrial sector stocks on the move are


|
||||||||||||||||||||||||||||||||||||||||||||||||
| 12Stocks.com: Investing in Industrial Sector using Exchange Traded Funds | |
|
The following table shows list of key exchange traded funds (ETF) that
help investors track Industrial Index. For detailed view, check out our ETF Funds section of our website. Quick View: Move mouse or cursor over ETF symbol (ticker) to view short-term Technical chart and over ETF name to view long term chart. Click on ticker or stock name for detailed view. Click on to add stock symbol to your watchlist and to view watchlist. |
12Stocks.com List of ETFs that track Industrial Index
| Ticker | ETF Name | Watchlist | Recent Price | Smart Investing & Trading Score | Change % | Week % | Year-to-date % |
| XLI | Industrial | | 151.97 | 80 | 1.17 | 0.77 | 16.04% |
| UXI | Industrials | | 45.17 | 80 | 31.9 | 1.12 | 24.88% |
| PPA | Aerospace & Defense | | 147.75 | 70 | 0.64 | 0.36 | 28.98% |
| ITA | Aerospace & Defense | | 198.24 | 60 | 0.67 | 0.35 | 36.74% |
| ITB | Home Construction | | 106.46 | 100 | 4.39 | 2.77 | 4.43% |
| XHB | Homebuilders | | 111.40 | 100 | 4.45 | 3.86 | 7.12% |
| SIJ | Short Industrials | | 12.04 | 30 | -1.1 | -1.23 | -27.12% |
| IYJ | Industrials | | 144.21 | 70 | 1.02 | 0.68 | 8.44% |
| EXI | Global Industrials | | 169.64 | 80 | 1.32 | 1.68 | 21.12% |
| VIS | Industrials | | 290.99 | 80 | 19.27 | 0.91 | 15.03% |
| PSCI | SmallCap Industrials | | 146.87 | 100 | 2.89 | 3.5 | 9.65% |
| ARKQ | ARK Industrial Innovation | | 101.58 | 100 | 2.92 | 9999 | NA |
| 12Stocks.com: Charts, Trends, Fundamental Data and Performances of Industrial Stocks | |
|
We now take in-depth look at all Industrial stocks including charts, multi-period performances and overall trends (as measured by Smart Investing & Trading Score). One can sort Industrial stocks (click link to choose) by Daily, Weekly and by Year-to-Date performances. Also, one can sort by size of the company or by market capitalization. |
| Select Your Default Chart Type: | |||||
| |||||
| Click on stock symbol or name for detailed view. Click on to add stock symbol to your watchlist and to view watchlist. Quick View: Move mouse or cursor over "Daily" to quickly view daily Technical stock chart and over "Weekly" to view weekly Technical stock chart. | |||||

 | CCS Century Communities, Inc. |
| Sector: Industrials | |
| SubSector: Residential Construction | |
| MarketCap: 459.206 Millions | |
| Recent Price: 63.06 Smart Investing & Trading Score: 80 | |
| Day Percent Change: 36.23% Day Change: 27.63 | |
| Week Change: 3.96% Year-to-date Change: -13.3% | |
| CCS Links: Profile News Message Board | |
| Charts:- Daily , Weekly | |
| Add CCS to Watchlist: View: Get Complete CCS Trend Analysis ➞ | |
 | FIX Comfort Systems USA, Inc. |
| Sector: Industrials | |
| SubSector: General Contractors | |
| MarketCap: 1440.63 Millions | |
| Recent Price: 718.61 Smart Investing & Trading Score: 100 | |
| Day Percent Change: 86.98% Day Change: 157.46 | |
| Week Change: 3.93% Year-to-date Change: 69.8% | |
| FIX Links: Profile News Message Board | |
| Charts:- Daily , Weekly | |
| Add FIX to Watchlist: View: Get Complete FIX Trend Analysis ➞ | |
 | PSN Parsons Corporation |
| Sector: Industrials | |
| SubSector: Diversified Machinery | |
| MarketCap: 3021.16 Millions | |
| Recent Price: 80.01 Smart Investing & Trading Score: 100 | |
| Day Percent Change: 0.1% Day Change: 0.09 | |
| Week Change: 3.91% Year-to-date Change: -13.3% | |
| PSN Links: Profile News Message Board | |
| Charts:- Daily , Weekly | |
| Add PSN to Watchlist: View: Get Complete PSN Trend Analysis ➞ | |
 | KBH KB Home |
| Sector: Industrials | |
| SubSector: Residential Construction | |
| MarketCap: 1249.66 Millions | |
| Recent Price: 61.30 Smart Investing & Trading Score: 90 | |
| Day Percent Change: 5.16% Day Change: 4.22 | |
| Week Change: 3.87% Year-to-date Change: -5.5% | |
| KBH Links: Profile News Message Board | |
| Charts:- Daily , Weekly | |
| Add KBH to Watchlist: View: Get Complete KBH Trend Analysis ➞ | |
 | MTZ MasTec, Inc. |
| Sector: Industrials | |
| SubSector: Heavy Construction | |
| MarketCap: 2596.95 Millions | |
| Recent Price: 184.39 Smart Investing & Trading Score: 70 | |
| Day Percent Change: 2.17% Day Change: 2.38 | |
| Week Change: 3.76% Year-to-date Change: 35.4% | |
| MTZ Links: Profile News Message Board | |
| Charts:- Daily , Weekly | |
| Add MTZ to Watchlist: View: Get Complete MTZ Trend Analysis ➞ | |
 | APOG Apogee Enterprises, Inc. |
| Sector: Industrials | |
| SubSector: General Building Materials | |
| MarketCap: 510.653 Millions | |
| Recent Price: 43.28 Smart Investing & Trading Score: 80 | |
| Day Percent Change: 5.03% Day Change: 3.22 | |
| Week Change: 3.76% Year-to-date Change: -38.3% | |
| APOG Links: Profile News Message Board | |
| Charts:- Daily , Weekly | |
| Add APOG to Watchlist: View: Get Complete APOG Trend Analysis ➞ | |
 | NPK National Presto Industries, Inc. |
| Sector: Industrials | |
| SubSector: Aerospace/Defense Products & Services | |
| MarketCap: 540.401 Millions | |
| Recent Price: 102.78 Smart Investing & Trading Score: 80 | |
| Day Percent Change: -8.24% Day Change: -6.68 | |
| Week Change: 3.72% Year-to-date Change: 5.5% | |
| NPK Links: Profile News Message Board | |
| Charts:- Daily , Weekly | |
| Add NPK to Watchlist: View: Get Complete NPK Trend Analysis ➞ | |
 | EXP Eagle Materials Inc. |
| Sector: Industrials | |
| SubSector: Cement | |
| MarketCap: 2234.73 Millions | |
| Recent Price: 233.73 Smart Investing & Trading Score: 80 | |
| Day Percent Change: 40.27% Day Change: 76.32 | |
| Week Change: 3.67% Year-to-date Change: -5.1% | |
| EXP Links: Profile News Message Board | |
| Charts:- Daily , Weekly | |
| Add EXP to Watchlist: View: Get Complete EXP Trend Analysis ➞ | |
 | MIR Mirion Technologies, Inc. |
| Sector: Industrials | |
| SubSector: Specialty Industrial Machinery | |
| MarketCap: 1920 Millions | |
| Recent Price: 22.29 Smart Investing & Trading Score: 90 | |
| Day Percent Change: 1.01% Day Change: 0.11 | |
| Week Change: 3.67% Year-to-date Change: 27.7% | |
| MIR Links: Profile News Message Board | |
| Charts:- Daily , Weekly | |
| Add MIR to Watchlist: View: Get Complete MIR Trend Analysis ➞ | |
 | LEN Lennar Corporation |
| Sector: Industrials | |
| SubSector: Residential Construction | |
| MarketCap: 11926.6 Millions | |
| Recent Price: 124.47 Smart Investing & Trading Score: 100 | |
| Day Percent Change: 3.5% Day Change: 6.26 | |
| Week Change: 3.64% Year-to-date Change: 3.6% | |
| LEN Links: Profile News Message Board | |
| Charts:- Daily , Weekly | |
| Add LEN to Watchlist: View: Get Complete LEN Trend Analysis ➞ | |
 | PL Planet Labs PBC |
| Sector: Industrials | |
| SubSector: Aerospace & Defense | |
| MarketCap: 874 Millions | |
| Recent Price: 6.62 Smart Investing & Trading Score: 70 | |
| Day Percent Change: 5.38% Day Change: 0.14 | |
| Week Change: 3.6% Year-to-date Change: 63.9% | |
| PL Links: Profile News Message Board | |
| Charts:- Daily , Weekly | |
| Add PL to Watchlist: View: Get Complete PL Trend Analysis ➞ | |
 | BA The Boeing Company |
| Sector: Industrials | |
| SubSector: Aerospace/Defense Products & Services | |
| MarketCap: 65336.4 Millions | |
| Recent Price: 232.61 Smart Investing & Trading Score: 80 | |
| Day Percent Change: -26.5% Day Change: -63.08 | |
| Week Change: 3.45% Year-to-date Change: 31.4% | |
| BA Links: Profile News Message Board | |
| Charts:- Daily , Weekly | |
| Add BA to Watchlist: View: Get Complete BA Trend Analysis ➞ | |
 | WTS Watts Water Technologies, Inc. |
| Sector: Industrials | |
| SubSector: Industrial Equipment & Components | |
| MarketCap: 2903.29 Millions | |
| Recent Price: 272.75 Smart Investing & Trading Score: 100 | |
| Day Percent Change: 2.35% Day Change: 4.39 | |
| Week Change: 3.42% Year-to-date Change: 34.7% | |
| WTS Links: Profile News Message Board | |
| Charts:- Daily , Weekly | |
| Add WTS to Watchlist: View: Get Complete WTS Trend Analysis ➞ | |
 | BLDR Builders FirstSource, Inc. |
| Sector: Industrials | |
| SubSector: General Building Materials | |
| MarketCap: 1714.63 Millions | |
| Recent Price: 137.45 Smart Investing & Trading Score: 80 | |
| Day Percent Change: 20.11% Day Change: 30.51 | |
| Week Change: 3.38% Year-to-date Change: -3.8% | |
| BLDR Links: Profile News Message Board | |
| Charts:- Daily , Weekly | |
| Add BLDR to Watchlist: View: Get Complete BLDR Trend Analysis ➞ | |
 | RYI Ryerson Holding Corporation |
| Sector: Industrials | |
| SubSector: Metal Fabrication | |
| MarketCap: 202.55 Millions | |
| Recent Price: 22.08 Smart Investing & Trading Score: 80 | |
| Day Percent Change: -28.23% Day Change: -7.97 | |
| Week Change: 3.37% Year-to-date Change: 21.2% | |
| RYI Links: Profile News Message Board | |
| Charts:- Daily , Weekly | |
| Add RYI to Watchlist: View: Get Complete RYI Trend Analysis ➞ | |
| RYI Ryerson Holding Corporation |
| Sector: Industrials | |
| SubSector: Metal Fabrication | |
| MarketCap: 202.55 Millions | |
| Recent Price: 9.45 Smart Investing & Trading Score: 80 | |
| Day Percent Change: -28.23% Day Change: -7.97 | |
| Week Change: 3.37% Year-to-date Change: 21.2% | |
| RYI Links: Profile News Message Board | |
| Charts:- Daily , Weekly | |
| Add RYI to Watchlist: View: Get Complete RYI Trend Analysis ➞ | |
 | DHR Danaher Corporation |
| Sector: Industrials | |
| SubSector: Diversified Machinery | |
| MarketCap: 93210.3 Millions | |
| Recent Price: 205.72 Smart Investing & Trading Score: 80 | |
| Day Percent Change: 0.76% Day Change: 2.04 | |
| Week Change: 3.36% Year-to-date Change: -10.1% | |
| DHR Links: Profile News Message Board | |
| Charts:- Daily , Weekly | |
| Add DHR to Watchlist: View: Get Complete DHR Trend Analysis ➞ | |
 | FSS Federal Signal Corporation |
| Sector: Industrials | |
| SubSector: Pollution & Treatment Controls | |
| MarketCap: 1694.05 Millions | |
| Recent Price: 129.80 Smart Investing & Trading Score: 100 | |
| Day Percent Change: 56.94% Day Change: 34.09 | |
| Week Change: 3.33% Year-to-date Change: 41.0% | |
| FSS Links: Profile News Message Board | |
| Charts:- Daily , Weekly | |
| Add FSS to Watchlist: View: Get Complete FSS Trend Analysis ➞ | |
 | SSD Simpson Manufacturing Co., Inc. |
| Sector: Industrials | |
| SubSector: Small Tools & Accessories | |
| MarketCap: 2850.16 Millions | |
| Recent Price: 188.38 Smart Investing & Trading Score: 100 | |
| Day Percent Change: 4.5% Day Change: 8.01 | |
| Week Change: 3.22% Year-to-date Change: 14.2% | |
| SSD Links: Profile News Message Board | |
| Charts:- Daily , Weekly | |
| Add SSD to Watchlist: View: Get Complete SSD Trend Analysis ➞ | |
 | VMI Valmont Industries, Inc. |
| Sector: Industrials | |
| SubSector: Metal Fabrication | |
| MarketCap: 2251.6 Millions | |
| Recent Price: 379.15 Smart Investing & Trading Score: 100 | |
| Day Percent Change: 1.94% Day Change: 5.5 | |
| Week Change: 3.21% Year-to-date Change: 24.2% | |
| VMI Links: Profile News Message Board | |
| Charts:- Daily , Weekly | |
| Add VMI to Watchlist: View: Get Complete VMI Trend Analysis ➞ | |
 | LNN Lindsay Corporation |
| Sector: Industrials | |
| SubSector: Farm & Construction Machinery | |
| MarketCap: 1097.57 Millions | |
| Recent Price: 140.15 Smart Investing & Trading Score: 90 | |
| Day Percent Change: 0.85% Day Change: 1.03 | |
| Week Change: 3.12% Year-to-date Change: 19.1% | |
| LNN Links: Profile News Message Board | |
| Charts:- Daily , Weekly | |
| Add LNN to Watchlist: View: Get Complete LNN Trend Analysis ➞ | |
 | SPR Spirit AeroSystems Holdings, Inc. |
| Sector: Industrials | |
| SubSector: Aerospace/Defense Products & Services | |
| MarketCap: 2283.01 Millions | |
| Recent Price: 40.51 Smart Investing & Trading Score: 80 | |
| Day Percent Change: 0.96% Day Change: 0.34 | |
| Week Change: 3.11% Year-to-date Change: 18.9% | |
| SPR Links: Profile News Message Board | |
| Charts:- Daily , Weekly | |
| Add SPR to Watchlist: View: Get Complete SPR Trend Analysis ➞ | |
 | VMC Vulcan Materials Company |
| Sector: Industrials | |
| SubSector: General Building Materials | |
| MarketCap: 12304.7 Millions | |
| Recent Price: 291.89 Smart Investing & Trading Score: 100 | |
| Day Percent Change: 2.61% Day Change: 6.49 | |
| Week Change: 3.08% Year-to-date Change: 13.9% | |
| VMC Links: Profile News Message Board | |
| Charts:- Daily , Weekly | |
| Add VMC to Watchlist: View: Get Complete VMC Trend Analysis ➞ | |
 | TKR The Timken Company |
| Sector: Industrials | |
| SubSector: Machine Tools & Accessories | |
| MarketCap: 2277.48 Millions | |
| Recent Price: 76.91 Smart Investing & Trading Score: 80 | |
| Day Percent Change: 2.74% Day Change: 2.26 | |
| Week Change: 3.03% Year-to-date Change: 8.7% | |
| TKR Links: Profile News Message Board | |
| Charts:- Daily , Weekly | |
| Add TKR to Watchlist: View: Get Complete TKR Trend Analysis ➞ | |
 | SWK Stanley Black & Decker, Inc. |
| Sector: Industrials | |
| SubSector: Machine Tools & Accessories | |
| MarketCap: 14274.8 Millions | |
| Recent Price: 71.43 Smart Investing & Trading Score: 80 | |
| Day Percent Change: 2.52% Day Change: 2.47 | |
| Week Change: 2.98% Year-to-date Change: -9.0% | |
| SWK Links: Profile News Message Board | |
| Charts:- Daily , Weekly | |
| Add SWK to Watchlist: View: Get Complete SWK Trend Analysis ➞ | |
| For tabular summary view of above stock list: Summary View ➞ 0 - 25 , 25 - 50 , 50 - 75 , 75 - 100 , 100 - 125 , 125 - 150 , 150 - 175 , 175 - 200 , 200 - 225 , 225 - 250 , 250 - 275 | ||
| Click To Change The Sort Order: By Market Cap or Company Size Performance: Year-to-date, Week and Day | |
| Select Chart Type: | ||
|
Best Stocks Today 12Stocks.com |
© 2025 12Stocks.com Terms & Conditions Privacy Contact Us
All Information Provided Only For Education And Not To Be Used For Investing or Trading. See Terms & Conditions


One More Thing ... Get Best Stocks Delivered Daily!
Never Ever Miss A Move With Our Top Ten Stocks Lists
Find Best Stocks In Any Market - Bull or Bear Market
Take A Peek At Our Top Ten Stocks Lists: Daily, Weekly, Year-to-Date & Top Trends
Find Best Stocks In Any Market - Bull or Bear Market
Take A Peek At Our Top Ten Stocks Lists: Daily, Weekly, Year-to-Date & Top Trends
Industrial Stocks With Best Up Trends [0-bearish to 100-bullish]: Construction Partners[100], Comfort Systems[100], Granite Construction[100], Armstrong World[100], Federal Signal[100], Legacy Housing[100], Arcosa [100], Donaldson [100], Evolv Technologies[100], Powell Industries[100], TopBuild [100]
Best Industrial Stocks Year-to-Date:
China Yuchai[204.95%], Amprius Technologies[177.14%], Tutor Perini[142.85%], American Superconductor[126.9%], Joby Aviation[121.53%], Solid Power[118.52%], NuScale Power[112.88%], Astronics [105.58%], Evolv Technologies[89.87%], Sterling Construction[83.08%], IES [76.01%] Best Industrial Stocks This Week:
CompoSecure [33.1%], LegalZoom.com [26.63%], Frontier [24.53%], Tutor Perini[23.31%], Installed Building[22.1%], Construction Partners[21.29%], China Yuchai[21.11%], JELD-WEN Holding[20.69%], Montrose Environmental[20.11%], Sun Country[17.38%], Arcosa [16.57%] Best Industrial Stocks Daily:
Embraer S.A[128.34%], Virgin Galactic[105.78%], Graham [92.69%], Argan [92.17%], AeroVironment [91.63%], Construction Partners[90.54%], Comfort Systems[86.98%], Toll Brothers[84.15%], Granite Construction[74.15%], Eastern [68.24%], Armstrong World[62.49%]