
 Login Sign Up


| |||||
 |  | ||||

| 12Stocks.com Market Intelligence |
Best Industrial Stocks
| In a hurry? Industrial Stocks Lists: Performance Trends Table, Stock Charts
Sort Industrial stocks: Daily, Weekly, Year-to-Date, Market Cap & Trends. Filter Industrial stocks list by size:All Industrial Large Mid-Range Small |
| 12Stocks.com Industrial Stocks Performances & Trends Daily | |||||||||
|
|  The overall Smart Investing & Trading Score is 30 (0-bearish to 100-bullish) which puts Industrial sector in short term bearish to neutral trend. The Smart Investing & Trading Score from previous trading session is 60 and hence a deterioration of trend.
| ||||||||
Here are the Smart Investing & Trading Scores of the most requested Industrial stocks at 12Stocks.com (click stock name for detailed review):
|


| 12Stocks.com: Investing in Industrial sector with Stocks | |
|
The following table helps investors and traders sort through current performance and trends (as measured by Smart Investing & Trading Score) of various
stocks in the Industrial sector. Quick View: Move mouse or cursor over stock symbol (ticker) to view short-term Technical chart and over stock name to view long term chart. Click on  to add stock symbol to your watchlist and to add stock symbol to your watchlist and  to view watchlist. Click on any ticker or stock name for detailed market intelligence report for that stock. to view watchlist. Click on any ticker or stock name for detailed market intelligence report for that stock. |
12Stocks.com Performance of Stocks in Industrial Sector
| Ticker | Stock Name | Watchlist | Category | Recent Price | Smart Investing & Trading Score | Change % | YTD Change% |
| PINS |   | Conglomerates | 35.78 | 50 | 1.32 | 23.38% | |
| AME | AMETEK | | Machinery | 181.36 | 30 | 1.31 | 4.05% |
| GE | General Electric | | Machinery | 267.85 | 20 | 1.31 | 61.73% |
| LOMA | Loma Negra | | Building Materials | 10.50 | 0 | 1.25 | -8.71% |
| CMI | Cummins | | Machinery | 399.42 | 90 | 1.23 | 17.92% |
| DE | Deere & | | Machinery | 488.80 | 20 | 1.21 | 22.01% |
| PH | Parker-Hannifin | | Equipment | 729.96 | 50 | 1.15 | 20.43% |
| CAE | CAE | | Aerospace/Defense | 27.48 | 20 | 1.10 | 9.85% |
| HII | Huntington Ingalls | | Aerospace/Defense | 266.25 | 40 | 1.04 | 44.56% |
| MIR | Mirion Technologies | | Specialty Industrial Machinery | 20.55 | 30 | 1.01 | 26.82% |
| JOBY | Joby Aviation | | Airports & Air | 16.63 | 30 | 0.99 | 118.82% |
| TTC | Toro | | Small Tools & Accessories | 76.86 | 100 | 0.98 | -2.46% |
| SPR | Spirit AeroSystems | | Aerospace/Defense | 41.08 | 90 | 0.96 | 19.78% |
| ULCC | Frontier | | Airlines | 4.52 | 90 | 0.88 | -35.02% |
| FIP | FTAI Infrastructure | | Industrials | 4.70 | 78 | 0.87 | -31.97% |
| GGG | Graco | | Machinery | 84.40 | 20 | 0.86 | 4.86% |
| LNN | Lindsay | | Machinery | 138.47 | 30 | 0.85 | 21.58% |
| DHR | Danaher | | Machinery | 210.93 | 100 | 0.76 | -8.61% |
| CLH | Clean Harbors | | Waste Mgmt | 243.13 | 60 | 0.59 | 8.82% |
| OTIS | Otis Worldwide | | Specialty Industrial Machinery | 87.43 | 20 | 0.57 | -2.85% |
| ESLT | Elbit Systems | | Aerospace/Defense | 464.00 | 70 | 0.51 | 79.41% |
| ROP | Roper Technologies | | Machinery | 529.64 | 40 | 0.46 | 0.97% |
| MYRG | MYR | | Contractors | 181.01 | 20 | 0.36 | 25.45% |
| CMPO | CompoSecure | | Fabrication | 18.57 | 70 | 0.35 | 51.34% |
| HEI | HEICO | | Aerospace/Defense | 307.91 | 20 | 0.34 | 31.74% |
| For chart view version of above stock list: Chart View ➞ 0 - 25 , 25 - 50 , 50 - 75 , 75 - 100 , 100 - 125 , 125 - 150 , 150 - 175 , 175 - 200 , 200 - 225 , 225 - 250 , 250 - 275 , 275 - 300 | ||
 | Click To Change The Sort Order: By Market Cap or Company Size Performance: Year-to-date, Week and Day |  |
|
Get the most comprehensive stock market coverage daily at 12Stocks.com ➞ Best Stocks Today ➞ Best Stocks Weekly ➞ Best Stocks Year-to-Date ➞ Best Stocks Trends ➞  Best Stocks Today 12Stocks.com Best Nasdaq Stocks ➞ Best S&P 500 Stocks ➞ Best Tech Stocks ➞ Best Biotech Stocks ➞ |
| Detailed Overview of Industrial Stocks |
| Industrial Technical Overview, Leaders & Laggards, Top Industrial ETF Funds & Detailed Industrial Stocks List, Charts, Trends & More |
| Industrial Sector: Technical Analysis, Trends & YTD Performance | |
| Industrial sector is composed of stocks
from industrial machinery, aerospace, defense, farm/construction
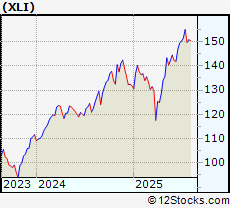
and industrial services subsectors. Industrial sector, as represented by XLI, an exchange-traded fund [ETF] that holds basket of Industrial stocks (e.g, Caterpillar, Boeing) is up by 16.43% and is currently outperforming the overall market by 6.1% year-to-date. Below is a quick view of Technical charts and trends: |
|
 XLI Weekly Chart |
|
| Long Term Trend: Very Good | |
| Medium Term Trend: Deteriorating | |
 XLI Daily Chart |
|
| Short Term Trend: Not Good | |
| Overall Trend Score: 30 | |
| YTD Performance: 16.43% | |
| **Trend Scores & Views Are Only For Educational Purposes And Not For Investing | |
| 12Stocks.com: Top Performing Industrial Sector Stocks | ||||||||||||||||||||||||||||||||||||||||||||||||
 The top performing Industrial sector stocks year to date are
Now, more recently, over last week, the top performing Industrial sector stocks on the move are


|
||||||||||||||||||||||||||||||||||||||||||||||||
| 12Stocks.com: Investing in Industrial Sector using Exchange Traded Funds | |
|
The following table shows list of key exchange traded funds (ETF) that
help investors track Industrial Index. For detailed view, check out our ETF Funds section of our website. Quick View: Move mouse or cursor over ETF symbol (ticker) to view short-term Technical chart and over ETF name to view long term chart. Click on ticker or stock name for detailed view. Click on to add stock symbol to your watchlist and to view watchlist. |
12Stocks.com List of ETFs that track Industrial Index
| Ticker | ETF Name | Watchlist | Recent Price | Smart Investing & Trading Score | Change % | Week % | Year-to-date % |
| XLI | Industrial | | 150.44 | 30 | 1.17 | 1.03 | 16.43% |
| UXI | Industrials | | 44.33 | 30 | 31.9 | 2 | 26.16% |
| PPA | Aerospace & Defense | | 146.23 | 20 | 0.64 | 0.39 | 29.15% |
| ITA | Aerospace & Defense | | 195.08 | 20 | 0.67 | -0.3 | 35.76% |
| ITB | Home Construction | | 109.62 | 100 | 4.39 | 7.99 | 9.08% |
| XHB | Homebuilders | | 113.34 | 100 | 4.45 | 8.64 | 11.28% |
| SIJ | Short Industrials | | 12.29 | 70 | -1.1 | -1.91 | -27.73% |
| IYJ | Industrials | | 143.75 | 30 | 1.02 | 1.74 | 9.55% |
| EXI | Global Industrials | | 169.04 | 50 | 1.32 | 1.47 | 21.49% |
| VIS | Industrials | | 288.11 | 30 | 19.27 | 1.49 | 15.62% |
| PSCI | SmallCap Industrials | | 145.06 | 60 | 2.89 | 5.67 | 11.45% |
| XAR | Aerospace & Defense | | 215.51 | 30 | 0.99 | 0.99 | 32.3% |
| ARKQ | ARK Industrial Innovation | | 99.95 | 80 | 2.92 | 3.86 | 32.12% |
| 12Stocks.com: Charts, Trends, Fundamental Data and Performances of Industrial Stocks | |
|
We now take in-depth look at all Industrial stocks including charts, multi-period performances and overall trends (as measured by Smart Investing & Trading Score). One can sort Industrial stocks (click link to choose) by Daily, Weekly and by Year-to-Date performances. Also, one can sort by size of the company or by market capitalization. |
| Select Your Default Chart Type: | |||||
| |||||
| Click on stock symbol or name for detailed view. Click on to add stock symbol to your watchlist and to view watchlist. Quick View: Move mouse or cursor over "Daily" to quickly view daily Technical stock chart and over "Weekly" to view weekly Technical stock chart. | |||||

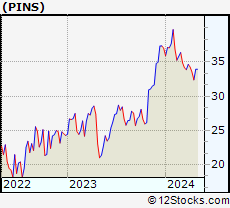 | PINS Pinterest, Inc. |
| Sector: Industrials | |
| SubSector: Conglomerates | |
| MarketCap: 8115.78 Millions | |
| Recent Price: 35.78 Smart Investing & Trading Score: 50 | |
| Day Percent Change: 1.32% Day Change: 0.42 | |
| Week Change: -8.49% Year-to-date Change: 23.4% | |
| PINS Links: Profile News Message Board | |
| Charts:- Daily , Weekly | |
| Add PINS to Watchlist: View: Get Complete PINS Trend Analysis ➞ | |
 | AME AMETEK, Inc. |
| Sector: Industrials | |
| SubSector: Diversified Machinery | |
| MarketCap: 16611.8 Millions | |
| Recent Price: 181.36 Smart Investing & Trading Score: 30 | |
| Day Percent Change: 1.31% Day Change: 2.16 | |
| Week Change: 0.78% Year-to-date Change: 4.1% | |
| AME Links: Profile News Message Board | |
| Charts:- Daily , Weekly | |
| Add AME to Watchlist: View: Get Complete AME Trend Analysis ➞ | |
 | GE General Electric Company |
| Sector: Industrials | |
| SubSector: Diversified Machinery | |
| MarketCap: 64710.6 Millions | |
| Recent Price: 267.85 Smart Investing & Trading Score: 20 | |
| Day Percent Change: 1.31% Day Change: 2.21 | |
| Week Change: -1.26% Year-to-date Change: 61.7% | |
| GE Links: Profile News Message Board | |
| Charts:- Daily , Weekly | |
| Add GE to Watchlist: View: Get Complete GE Trend Analysis ➞ | |
 | LOMA Loma Negra Compania Industrial Argentina Sociedad Anonima |
| Sector: Industrials | |
| SubSector: General Building Materials | |
| MarketCap: 408.853 Millions | |
| Recent Price: 10.50 Smart Investing & Trading Score: 0 | |
| Day Percent Change: 1.25% Day Change: 0.08 | |
| Week Change: -12.66% Year-to-date Change: -8.7% | |
| LOMA Links: Profile News Message Board | |
| Charts:- Daily , Weekly | |
| Add LOMA to Watchlist: View: Get Complete LOMA Trend Analysis ➞ | |
 | CMI Cummins Inc. |
| Sector: Industrials | |
| SubSector: Diversified Machinery | |
| MarketCap: 19127.1 Millions | |
| Recent Price: 399.42 Smart Investing & Trading Score: 90 | |
| Day Percent Change: 1.23% Day Change: 3.75 | |
| Week Change: 6.58% Year-to-date Change: 17.9% | |
| CMI Links: Profile News Message Board | |
| Charts:- Daily , Weekly | |
| Add CMI to Watchlist: View: Get Complete CMI Trend Analysis ➞ | |
 | DE Deere & Company |
| Sector: Industrials | |
| SubSector: Farm & Construction Machinery | |
| MarketCap: 39168.7 Millions | |
| Recent Price: 488.80 Smart Investing & Trading Score: 20 | |
| Day Percent Change: 1.21% Day Change: 4.55 | |
| Week Change: 0.77% Year-to-date Change: 22.0% | |
| DE Links: Profile News Message Board | |
| Charts:- Daily , Weekly | |
| Add DE to Watchlist: View: Get Complete DE Trend Analysis ➞ | |
 | PH Parker-Hannifin Corporation |
| Sector: Industrials | |
| SubSector: Industrial Equipment & Components | |
| MarketCap: 14888.9 Millions | |
| Recent Price: 729.96 Smart Investing & Trading Score: 50 | |
| Day Percent Change: 1.15% Day Change: 6.77 | |
| Week Change: 9.31% Year-to-date Change: 20.4% | |
| PH Links: Profile News Message Board | |
| Charts:- Daily , Weekly | |
| Add PH to Watchlist: View: Get Complete PH Trend Analysis ➞ | |
 | CAE CAE Inc. |
| Sector: Industrials | |
| SubSector: Aerospace/Defense Products & Services | |
| MarketCap: 3739.61 Millions | |
| Recent Price: 27.48 Smart Investing & Trading Score: 20 | |
| Day Percent Change: 1.1% Day Change: 0.2 | |
| Week Change: -3.7% Year-to-date Change: 9.9% | |
| CAE Links: Profile News Message Board | |
| Charts:- Daily , Weekly | |
| Add CAE to Watchlist: View: Get Complete CAE Trend Analysis ➞ | |
 | HII Huntington Ingalls Industries, Inc. |
| Sector: Industrials | |
| SubSector: Aerospace/Defense Products & Services | |
| MarketCap: 7276.11 Millions | |
| Recent Price: 266.25 Smart Investing & Trading Score: 40 | |
| Day Percent Change: 1.04% Day Change: 2.82 | |
| Week Change: 0.73% Year-to-date Change: 44.6% | |
| HII Links: Profile News Message Board | |
| Charts:- Daily , Weekly | |
| Add HII to Watchlist: View: Get Complete HII Trend Analysis ➞ | |
 | MIR Mirion Technologies, Inc. |
| Sector: Industrials | |
| SubSector: Specialty Industrial Machinery | |
| MarketCap: 1920 Millions | |
| Recent Price: 20.55 Smart Investing & Trading Score: 30 | |
| Day Percent Change: 1.01% Day Change: 0.11 | |
| Week Change: 2.74% Year-to-date Change: 26.8% | |
| MIR Links: Profile News Message Board | |
| Charts:- Daily , Weekly | |
| Add MIR to Watchlist: View: Get Complete MIR Trend Analysis ➞ | |
 | JOBY Joby Aviation, Inc. |
| Sector: Industrials | |
| SubSector: Airports & Air Services | |
| MarketCap: 5810 Millions | |
| Recent Price: 16.63 Smart Investing & Trading Score: 30 | |
| Day Percent Change: 0.99% Day Change: 0.05 | |
| Week Change: -6.02% Year-to-date Change: 118.8% | |
| JOBY Links: Profile News Message Board | |
| Charts:- Daily , Weekly | |
| Add JOBY to Watchlist: View: Get Complete JOBY Trend Analysis ➞ | |
 | TTC The Toro Company |
| Sector: Industrials | |
| SubSector: Small Tools & Accessories | |
| MarketCap: 6426.96 Millions | |
| Recent Price: 76.86 Smart Investing & Trading Score: 100 | |
| Day Percent Change: 0.98% Day Change: 0.88 | |
| Week Change: 3.98% Year-to-date Change: -2.5% | |
| TTC Links: Profile News Message Board | |
| Charts:- Daily , Weekly | |
| Add TTC to Watchlist: View: Get Complete TTC Trend Analysis ➞ | |
 | SPR Spirit AeroSystems Holdings, Inc. |
| Sector: Industrials | |
| SubSector: Aerospace/Defense Products & Services | |
| MarketCap: 2283.01 Millions | |
| Recent Price: 41.08 Smart Investing & Trading Score: 90 | |
| Day Percent Change: 0.96% Day Change: 0.34 | |
| Week Change: 3.08% Year-to-date Change: 19.8% | |
| SPR Links: Profile News Message Board | |
| Charts:- Daily , Weekly | |
| Add SPR to Watchlist: View: Get Complete SPR Trend Analysis ➞ | |
 | ULCC Frontier Group Holdings, Inc. |
| Sector: Industrials | |
| SubSector: Airlines | |
| MarketCap: 2160 Millions | |
| Recent Price: 4.52 Smart Investing & Trading Score: 90 | |
| Day Percent Change: 0.88% Day Change: 0.03 | |
| Week Change: 37.7% Year-to-date Change: -35.0% | |
| ULCC Links: Profile News Message Board | |
| Charts:- Daily , Weekly | |
| Add ULCC to Watchlist: View: Get Complete ULCC Trend Analysis ➞ | |
 | FIP FTAI Infrastructure Inc. |
| Sector: Industrials | |
| SubSector: Industrials | |
| MarketCap: 368 Millions | |
| Recent Price: 4.70 Smart Investing & Trading Score: 78 | |
| Day Percent Change: 0.87% Day Change: 0.08 | |
| Week Change: -31.94% Year-to-date Change: -32.0% | |
| FIP Links: Profile News Message Board | |
| Charts:- Daily , Weekly | |
| Add FIP to Watchlist: View: Get Complete FIP Trend Analysis ➞ | |
 | GGG Graco Inc. |
| Sector: Industrials | |
| SubSector: Diversified Machinery | |
| MarketCap: 7739.76 Millions | |
| Recent Price: 84.40 Smart Investing & Trading Score: 20 | |
| Day Percent Change: 0.86% Day Change: 0.7 | |
| Week Change: 4.93% Year-to-date Change: 4.9% | |
| GGG Links: Profile News Message Board | |
| Charts:- Daily , Weekly | |
| Add GGG to Watchlist: View: Get Complete GGG Trend Analysis ➞ | |
 | LNN Lindsay Corporation |
| Sector: Industrials | |
| SubSector: Farm & Construction Machinery | |
| MarketCap: 1097.57 Millions | |
| Recent Price: 138.47 Smart Investing & Trading Score: 30 | |
| Day Percent Change: 0.85% Day Change: 1.03 | |
| Week Change: 5.65% Year-to-date Change: 21.6% | |
| LNN Links: Profile News Message Board | |
| Charts:- Daily , Weekly | |
| Add LNN to Watchlist: View: Get Complete LNN Trend Analysis ➞ | |
 | DHR Danaher Corporation |
| Sector: Industrials | |
| SubSector: Diversified Machinery | |
| MarketCap: 93210.3 Millions | |
| Recent Price: 210.93 Smart Investing & Trading Score: 100 | |
| Day Percent Change: 0.76% Day Change: 2.04 | |
| Week Change: 7.16% Year-to-date Change: -8.6% | |
| DHR Links: Profile News Message Board | |
| Charts:- Daily , Weekly | |
| Add DHR to Watchlist: View: Get Complete DHR Trend Analysis ➞ | |
 | CLH Clean Harbors, Inc. |
| Sector: Industrials | |
| SubSector: Waste Management | |
| MarketCap: 2391.28 Millions | |
| Recent Price: 243.13 Smart Investing & Trading Score: 60 | |
| Day Percent Change: 0.59% Day Change: 1.44 | |
| Week Change: 3.31% Year-to-date Change: 8.8% | |
| CLH Links: Profile News Message Board | |
| Charts:- Daily , Weekly | |
| Add CLH to Watchlist: View: Get Complete CLH Trend Analysis ➞ | |
 | OTIS Otis Worldwide Corporation |
| Sector: Industrials | |
| SubSector: Specialty Industrial Machinery | |
| MarketCap: 27727 Millions | |
| Recent Price: 87.43 Smart Investing & Trading Score: 20 | |
| Day Percent Change: 0.57% Day Change: 0.53 | |
| Week Change: 2.6% Year-to-date Change: -2.9% | |
| OTIS Links: Profile News Message Board | |
| Charts:- Daily , Weekly | |
| Add OTIS to Watchlist: View: Get Complete OTIS Trend Analysis ➞ | |
 | ESLT Elbit Systems Ltd. |
| Sector: Industrials | |
| SubSector: Aerospace/Defense Products & Services | |
| MarketCap: 5770.01 Millions | |
| Recent Price: 464.00 Smart Investing & Trading Score: 70 | |
| Day Percent Change: 0.51% Day Change: 1 | |
| Week Change: -4.66% Year-to-date Change: 79.4% | |
| ESLT Links: Profile News Message Board | |
| Charts:- Daily , Weekly | |
| Add ESLT to Watchlist: View: Get Complete ESLT Trend Analysis ➞ | |
 | ROP Roper Technologies, Inc. |
| Sector: Industrials | |
| SubSector: Diversified Machinery | |
| MarketCap: 33366.2 Millions | |
| Recent Price: 529.64 Smart Investing & Trading Score: 40 | |
| Day Percent Change: 0.46% Day Change: 2.5 | |
| Week Change: -3.56% Year-to-date Change: 1.0% | |
| ROP Links: Profile News Message Board | |
| Charts:- Daily , Weekly | |
| Add ROP to Watchlist: View: Get Complete ROP Trend Analysis ➞ | |
 | MYRG MYR Group Inc. |
| Sector: Industrials | |
| SubSector: General Contractors | |
| MarketCap: 405.363 Millions | |
| Recent Price: 181.01 Smart Investing & Trading Score: 20 | |
| Day Percent Change: 0.36% Day Change: 0.37 | |
| Week Change: 0.5% Year-to-date Change: 25.5% | |
| MYRG Links: Profile News Message Board | |
| Charts:- Daily , Weekly | |
| Add MYRG to Watchlist: View: Get Complete MYRG Trend Analysis ➞ | |
 | CMPO CompoSecure, Inc. |
| Sector: Industrials | |
| SubSector: Metal Fabrication | |
| MarketCap: 535 Millions | |
| Recent Price: 18.57 Smart Investing & Trading Score: 70 | |
| Day Percent Change: 0.35% Day Change: 0.04 | |
| Week Change: 34.1% Year-to-date Change: 51.3% | |
| CMPO Links: Profile News Message Board | |
| Charts:- Daily , Weekly | |
| Add CMPO to Watchlist: View: Get Complete CMPO Trend Analysis ➞ | |
 | HEI HEICO Corporation |
| Sector: Industrials | |
| SubSector: Aerospace/Defense Products & Services | |
| MarketCap: 10023.1 Millions | |
| Recent Price: 307.91 Smart Investing & Trading Score: 20 | |
| Day Percent Change: 0.34% Day Change: 0.84 | |
| Week Change: -1.14% Year-to-date Change: 31.7% | |
| HEI Links: Profile News Message Board | |
| Charts:- Daily , Weekly | |
| Add HEI to Watchlist: View: Get Complete HEI Trend Analysis ➞ | |
| For tabular summary view of above stock list: Summary View ➞ 0 - 25 , 25 - 50 , 50 - 75 , 75 - 100 , 100 - 125 , 125 - 150 , 150 - 175 , 175 - 200 , 200 - 225 , 225 - 250 , 250 - 275 , 275 - 300 | ||
| Click To Change The Sort Order: By Market Cap or Company Size Performance: Year-to-date, Week and Day | |
| Select Chart Type: | ||
|
Best Stocks Today 12Stocks.com |
© 2025 12Stocks.com Terms & Conditions Privacy Contact Us
All Information Provided Only For Education And Not To Be Used For Investing or Trading. See Terms & Conditions


One More Thing ... Get Best Stocks Delivered Daily!
Never Ever Miss A Move With Our Top Ten Stocks Lists
Find Best Stocks In Any Market - Bull or Bear Market
Take A Peek At Our Top Ten Stocks Lists: Daily, Weekly, Year-to-Date & Top Trends
Find Best Stocks In Any Market - Bull or Bear Market
Take A Peek At Our Top Ten Stocks Lists: Daily, Weekly, Year-to-Date & Top Trends
Industrial Stocks With Best Up Trends [0-bearish to 100-bullish]: Toll Brothers[100], Pulte [100], Taylor Morrison[100], Century Communities[100], Masco [100], Legacy Housing[100], Evolv Technologies[100], Solid Power[100], Meritage Homes[100], Proto Labs[100], Installed Building[100]
Best Industrial Stocks Year-to-Date:
China Yuchai[215.15%], Amprius Technologies[173.93%], Solid Power[155.03%], Tutor Perini[138.64%], Symbotic [126.4%], American Superconductor[119.61%], Joby Aviation[118.82%], Astronics [114.6%], NuScale Power[108.03%], Evolv Technologies[89.62%], Elbit Systems[79.41%] Best Industrial Stocks This Week:
Solid Power[40.52%], Frontier [37.7%], Hillenbrand [34.71%], CompoSecure [34.1%], Installed Building[28.67%], LegalZoom.com [25.35%], Construction Partners[24.32%], China Yuchai[24.26%], Montrose Environmental[23.35%], Sun Country[22.92%], Tutor Perini[22.14%] Best Industrial Stocks Daily:
Embraer S.A[128.34%], Virgin Galactic[105.78%], Graham [92.69%], Argan [92.17%], AeroVironment [91.63%], Construction Partners[90.54%], Comfort Systems[86.98%], Toll Brothers[84.15%], Granite Construction[74.15%], Eastern [68.24%], Armstrong World[62.49%]