
 Login Sign Up


| |||||
 |  | ||||

| 12Stocks.com Market Intelligence |
Best Industrial Stocks
| In a hurry? Industrial Stocks Lists: Performance Trends Table, Stock Charts
Sort Industrial stocks: Daily, Weekly, Year-to-Date, Market Cap & Trends. Filter Industrial stocks list by size:All Industrial Large Mid-Range Small |
| 12Stocks.com Industrial Stocks Performances & Trends Daily | |||||||||
|
|  The overall Smart Investing & Trading Score is 80 (0-bearish to 100-bullish) which puts Industrial sector in short term neutral to bullish trend. The Smart Investing & Trading Score from previous trading session is 20 and hence an improvement of trend.
| ||||||||
Here are the Smart Investing & Trading Scores of the most requested Industrial stocks at 12Stocks.com (click stock name for detailed review):
|


| 12Stocks.com: Investing in Industrial sector with Stocks | |
|
The following table helps investors and traders sort through current performance and trends (as measured by Smart Investing & Trading Score) of various
stocks in the Industrial sector. Quick View: Move mouse or cursor over stock symbol (ticker) to view short-term Technical chart and over stock name to view long term chart. Click on  to add stock symbol to your watchlist and to add stock symbol to your watchlist and  to view watchlist. Click on any ticker or stock name for detailed market intelligence report for that stock. to view watchlist. Click on any ticker or stock name for detailed market intelligence report for that stock. |
12Stocks.com Performance of Stocks in Industrial Sector
| Ticker | Stock Name | Watchlist | Category | Recent Price | Smart Investing & Trading Score | Change % | YTD Change% |
| LZ | LegalZoom.com |   | Specialty | 10.51 | 70 | 3.68% | 39.95% |
| PCH | PotlatchDeltic | | Lumber, Wood | 43.15 | 80 | 7.81% | 12.31% |
| SPR | Spirit AeroSystems | | Aerospace/Defense | 40.51 | 80 | 0.96% | 18.87% |
| TOL | Toll Brothers | | Residential | 128.29 | 80 | 84.15% | 2.53% |
| TKR | Timken | | Machine Tools | 76.91 | 80 | 2.74% | 8.74% |
| UFPI | Universal Forest | | Lumber, Wood | 102.54 | 70 | 4.97% | -8.35% |
| VMI | Valmont Industries | | Fabrication | 379.15 | 100 | 1.94% | 24.17% |
| EXP | Eagle Materials | | Cement | 233.73 | 80 | 40.27% | -5.05% |
| B | Barnes | | Equipment | 23.50 | 90 | 1.46% | 53.28% |
| FA | First Advantage | | Specialty | 16.36 | 0 | 2.12% | -12.65% |
| ULCC | Frontier | | Airlines | 4.29 | 80 | 0.88% | -39.66% |
| GTES | Gates | | Machinery | 24.45 | 70 | 40.85% | 18.86% |
| BLDP | Ballard Power | | Electrical Equipment | 1.73 | 20 | -57.66% | 4.22% |
| CWST | Casella Waste | | Waste Mgmt | 99.65 | 10 | 1.79% | -5.82% |
| EAF | GrafTech | | Machinery | 1.24 | 30 | -82.91% | -28.32% |
| ENS | EnerSys | | Electrical Equipment | 98.60 | 100 | 2.10% | 7.24% |
| PRLB | Proto Labs | | Machine Tools | 47.65 | 90 | 6.69% | 21.90% |
| MIR | Mirion Technologies | | Specialty Industrial Machinery | 22.29 | 90 | 1.01% | 27.74% |
| ATMU | Atmus Filtration | | Pollution & Treatment Controls | 43.96 | 56 | 2.81% | 12.35% |
| HLMN | Hillman | | Tools & Accessories | 9.86 | 80 | 3.59% | 1.23% |
| BLDR | Builders FirstSource | | Building Materials | 137.45 | 80 | 20.11% | -3.83% |
| FSS | Federal Signal | | Pollution & Treatment Controls | 129.80 | 100 | 56.94% | 40.96% |
| ACA | Arcosa | | Machinery | 99.25 | 100 | 19.85% | 2.71% |
| ERJ | Embraer S.A | | Aerospace/Defense | 58.71 | 80 | 128.34% | 60.22% |
| PCT | PureCycle Technologies | | Pollution & Treatment Controls | 13.28 | 60 | -0.17% | 29.56% |
| For chart view version of above stock list: Chart View ➞ 0 - 25 , 25 - 50 , 50 - 75 , 75 - 100 , 100 - 125 , 125 - 150 , 150 - 175 , 175 - 200 , 200 - 225 , 225 - 250 , 250 - 275 | ||
 | Click To Change The Sort Order: By Market Cap or Company Size Performance: Year-to-date, Week and Day |  |
|
Get the most comprehensive stock market coverage daily at 12Stocks.com ➞ Best Stocks Today ➞ Best Stocks Weekly ➞ Best Stocks Year-to-Date ➞ Best Stocks Trends ➞  Best Stocks Today 12Stocks.com Best Nasdaq Stocks ➞ Best S&P 500 Stocks ➞ Best Tech Stocks ➞ Best Biotech Stocks ➞ |
| Detailed Overview of Industrial Stocks |
| Industrial Technical Overview, Leaders & Laggards, Top Industrial ETF Funds & Detailed Industrial Stocks List, Charts, Trends & More |
| Industrial Sector: Technical Analysis, Trends & YTD Performance | |
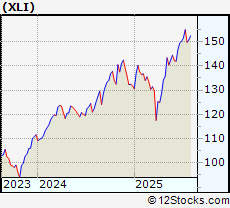
| Industrial sector is composed of stocks
from industrial machinery, aerospace, defense, farm/construction
and industrial services subsectors. Industrial sector, as represented by XLI, an exchange-traded fund [ETF] that holds basket of Industrial stocks (e.g, Caterpillar, Boeing) is up by 16.04% and is currently outperforming the overall market by 6.24% year-to-date. Below is a quick view of Technical charts and trends: |
|
 XLI Weekly Chart |
|
| Long Term Trend: Very Good | |
| Medium Term Trend: Deteriorating | |
 XLI Daily Chart |
|
| Short Term Trend: Very Good | |
| Overall Trend Score: 80 | |
| YTD Performance: 16.04% | |
| **Trend Scores & Views Are Only For Educational Purposes And Not For Investing | |
| 12Stocks.com: Top Performing Industrial Sector Stocks | ||||||||||||||||||||||||||||||||||||||||||||||||
 The top performing Industrial sector stocks year to date are
Now, more recently, over last week, the top performing Industrial sector stocks on the move are


|
||||||||||||||||||||||||||||||||||||||||||||||||
| 12Stocks.com: Investing in Industrial Sector using Exchange Traded Funds | |
|
The following table shows list of key exchange traded funds (ETF) that
help investors track Industrial Index. For detailed view, check out our ETF Funds section of our website. Quick View: Move mouse or cursor over ETF symbol (ticker) to view short-term Technical chart and over ETF name to view long term chart. Click on ticker or stock name for detailed view. Click on to add stock symbol to your watchlist and to view watchlist. |
12Stocks.com List of ETFs that track Industrial Index
| Ticker | ETF Name | Watchlist | Recent Price | Smart Investing & Trading Score | Change % | Week % | Year-to-date % |
| XLI | Industrial | | 151.97 | 80 | 1.17 | 0.77 | 16.04% |
| UXI | Industrials | | 45.17 | 80 | 31.9 | 1.12 | 24.88% |
| PPA | Aerospace & Defense | | 147.75 | 70 | 0.64 | 0.36 | 28.98% |
| ITA | Aerospace & Defense | | 198.24 | 60 | 0.67 | 0.35 | 36.74% |
| ITB | Home Construction | | 106.46 | 100 | 4.39 | 2.77 | 4.43% |
| XHB | Homebuilders | | 111.40 | 100 | 4.45 | 3.86 | 7.12% |
| SIJ | Short Industrials | | 12.04 | 30 | -1.1 | -1.23 | -27.12% |
| IYJ | Industrials | | 144.21 | 70 | 1.02 | 0.68 | 8.44% |
| EXI | Global Industrials | | 169.64 | 80 | 1.32 | 1.68 | 21.12% |
| VIS | Industrials | | 290.99 | 80 | 19.27 | 0.91 | 15.03% |
| PSCI | SmallCap Industrials | | 146.87 | 100 | 2.89 | 3.5 | 9.65% |
| ARKQ | ARK Industrial Innovation | | 101.58 | 100 | 2.92 | 9999 | NA |
| 12Stocks.com: Charts, Trends, Fundamental Data and Performances of Industrial Stocks | |
|
We now take in-depth look at all Industrial stocks including charts, multi-period performances and overall trends (as measured by Smart Investing & Trading Score). One can sort Industrial stocks (click link to choose) by Daily, Weekly and by Year-to-Date performances. Also, one can sort by size of the company or by market capitalization. |
| Select Your Default Chart Type: | |||||
| |||||
| Click on stock symbol or name for detailed view. Click on to add stock symbol to your watchlist and to view watchlist. Quick View: Move mouse or cursor over "Daily" to quickly view daily Technical stock chart and over "Weekly" to view weekly Technical stock chart. | |||||

 | LZ LegalZoom.com, Inc. |
| Sector: Industrials | |
| SubSector: Specialty Business Services | |
| MarketCap: 2330 Millions | |
| Recent Price: 10.51 Smart Investing & Trading Score: 70 | |
| Day Percent Change: 3.68% Day Change: 0.24 | |
| Week Change: 26.63% Year-to-date Change: 40.0% | |
| LZ Links: Profile News Message Board | |
| Charts:- Daily , Weekly | |
| Add LZ to Watchlist: View: Get Complete LZ Trend Analysis ➞ | |
 | PCH PotlatchDeltic Corporation |
| Sector: Industrials | |
| SubSector: Lumber, Wood Production | |
| MarketCap: 2314.68 Millions | |
| Recent Price: 43.15 Smart Investing & Trading Score: 80 | |
| Day Percent Change: 7.81% Day Change: 3.2 | |
| Week Change: 0.21% Year-to-date Change: 12.3% | |
| PCH Links: Profile News Message Board | |
| Charts:- Daily , Weekly | |
| Add PCH to Watchlist: View: Get Complete PCH Trend Analysis ➞ | |
 | SPR Spirit AeroSystems Holdings, Inc. |
| Sector: Industrials | |
| SubSector: Aerospace/Defense Products & Services | |
| MarketCap: 2283.01 Millions | |
| Recent Price: 40.51 Smart Investing & Trading Score: 80 | |
| Day Percent Change: 0.96% Day Change: 0.34 | |
| Week Change: 3.11% Year-to-date Change: 18.9% | |
| SPR Links: Profile News Message Board | |
| Charts:- Daily , Weekly | |
| Add SPR to Watchlist: View: Get Complete SPR Trend Analysis ➞ | |
 | TOL Toll Brothers, Inc. |
| Sector: Industrials | |
| SubSector: Residential Construction | |
| MarketCap: 2278.26 Millions | |
| Recent Price: 128.29 Smart Investing & Trading Score: 80 | |
| Day Percent Change: 84.15% Day Change: 67.96 | |
| Week Change: 0.88% Year-to-date Change: 2.5% | |
| TOL Links: Profile News Message Board | |
| Charts:- Daily , Weekly | |
| Add TOL to Watchlist: View: Get Complete TOL Trend Analysis ➞ | |
 | TKR The Timken Company |
| Sector: Industrials | |
| SubSector: Machine Tools & Accessories | |
| MarketCap: 2277.48 Millions | |
| Recent Price: 76.91 Smart Investing & Trading Score: 80 | |
| Day Percent Change: 2.74% Day Change: 2.26 | |
| Week Change: 3.03% Year-to-date Change: 8.7% | |
| TKR Links: Profile News Message Board | |
| Charts:- Daily , Weekly | |
| Add TKR to Watchlist: View: Get Complete TKR Trend Analysis ➞ | |
 | UFPI Universal Forest Products, Inc. |
| Sector: Industrials | |
| SubSector: Lumber, Wood Production | |
| MarketCap: 2263.38 Millions | |
| Recent Price: 102.54 Smart Investing & Trading Score: 70 | |
| Day Percent Change: 4.97% Day Change: 5.92 | |
| Week Change: 2.95% Year-to-date Change: -8.4% | |
| UFPI Links: Profile News Message Board | |
| Charts:- Daily , Weekly | |
| Add UFPI to Watchlist: View: Get Complete UFPI Trend Analysis ➞ | |
 | VMI Valmont Industries, Inc. |
| Sector: Industrials | |
| SubSector: Metal Fabrication | |
| MarketCap: 2251.6 Millions | |
| Recent Price: 379.15 Smart Investing & Trading Score: 100 | |
| Day Percent Change: 1.94% Day Change: 5.5 | |
| Week Change: 3.21% Year-to-date Change: 24.2% | |
| VMI Links: Profile News Message Board | |
| Charts:- Daily , Weekly | |
| Add VMI to Watchlist: View: Get Complete VMI Trend Analysis ➞ | |
 | EXP Eagle Materials Inc. |
| Sector: Industrials | |
| SubSector: Cement | |
| MarketCap: 2234.73 Millions | |
| Recent Price: 233.73 Smart Investing & Trading Score: 80 | |
| Day Percent Change: 40.27% Day Change: 76.32 | |
| Week Change: 3.67% Year-to-date Change: -5.1% | |
| EXP Links: Profile News Message Board | |
| Charts:- Daily , Weekly | |
| Add EXP to Watchlist: View: Get Complete EXP Trend Analysis ➞ | |
 | B Barnes Group Inc. |
| Sector: Industrials | |
| SubSector: Industrial Equipment & Components | |
| MarketCap: 2189.79 Millions | |
| Recent Price: 23.50 Smart Investing & Trading Score: 90 | |
| Day Percent Change: 1.46% Day Change: 0.55 | |
| Week Change: 4.26% Year-to-date Change: 53.3% | |
| B Links: Profile News Message Board | |
| Charts:- Daily , Weekly | |
| Add B to Watchlist: View: Get Complete B Trend Analysis ➞ | |
 | FA First Advantage Corporation |
| Sector: Industrials | |
| SubSector: Specialty Business Services | |
| MarketCap: 2170 Millions | |
| Recent Price: 16.36 Smart Investing & Trading Score: 0 | |
| Day Percent Change: 2.12% Day Change: 0.39 | |
| Week Change: 1.93% Year-to-date Change: -12.7% | |
| FA Links: Profile News Message Board | |
| Charts:- Daily , Weekly | |
| Add FA to Watchlist: View: Get Complete FA Trend Analysis ➞ | |
 | ULCC Frontier Group Holdings, Inc. |
| Sector: Industrials | |
| SubSector: Airlines | |
| MarketCap: 2160 Millions | |
| Recent Price: 4.29 Smart Investing & Trading Score: 80 | |
| Day Percent Change: 0.88% Day Change: 0.03 | |
| Week Change: 24.53% Year-to-date Change: -39.7% | |
| ULCC Links: Profile News Message Board | |
| Charts:- Daily , Weekly | |
| Add ULCC to Watchlist: View: Get Complete ULCC Trend Analysis ➞ | |
 | GTES Gates Industrial Corporation plc |
| Sector: Industrials | |
| SubSector: Diversified Machinery | |
| MarketCap: 2152.36 Millions | |
| Recent Price: 24.45 Smart Investing & Trading Score: 70 | |
| Day Percent Change: 40.85% Day Change: 5.22 | |
| Week Change: 0.95% Year-to-date Change: 18.9% | |
| GTES Links: Profile News Message Board | |
| Charts:- Daily , Weekly | |
| Add GTES to Watchlist: View: Get Complete GTES Trend Analysis ➞ | |
 | BLDP Ballard Power Systems Inc. |
| Sector: Industrials | |
| SubSector: Industrial Electrical Equipment | |
| MarketCap: 2124.79 Millions | |
| Recent Price: 1.73 Smart Investing & Trading Score: 20 | |
| Day Percent Change: -57.66% Day Change: -2.71 | |
| Week Change: -6.99% Year-to-date Change: 4.2% | |
| BLDP Links: Profile News Message Board | |
| Charts:- Daily , Weekly | |
| Add BLDP to Watchlist: View: Get Complete BLDP Trend Analysis ➞ | |
 | CWST Casella Waste Systems, Inc. |
| Sector: Industrials | |
| SubSector: Waste Management | |
| MarketCap: 2093.38 Millions | |
| Recent Price: 99.65 Smart Investing & Trading Score: 10 | |
| Day Percent Change: 1.79% Day Change: 1.88 | |
| Week Change: 0.45% Year-to-date Change: -5.8% | |
| CWST Links: Profile News Message Board | |
| Charts:- Daily , Weekly | |
| Add CWST to Watchlist: View: Get Complete CWST Trend Analysis ➞ | |
 | EAF GrafTech International Ltd. |
| Sector: Industrials | |
| SubSector: Diversified Machinery | |
| MarketCap: 2084.36 Millions | |
| Recent Price: 1.24 Smart Investing & Trading Score: 30 | |
| Day Percent Change: -82.91% Day Change: -3.56 | |
| Week Change: 5.98% Year-to-date Change: -28.3% | |
| EAF Links: Profile News Message Board | |
| Charts:- Daily , Weekly | |
| Add EAF to Watchlist: View: Get Complete EAF Trend Analysis ➞ | |
 | ENS EnerSys |
| Sector: Industrials | |
| SubSector: Industrial Electrical Equipment | |
| MarketCap: 2068.79 Millions | |
| Recent Price: 98.60 Smart Investing & Trading Score: 100 | |
| Day Percent Change: 2.1% Day Change: 2.03 | |
| Week Change: 7.88% Year-to-date Change: 7.2% | |
| ENS Links: Profile News Message Board | |
| Charts:- Daily , Weekly | |
| Add ENS to Watchlist: View: Get Complete ENS Trend Analysis ➞ | |
 | PRLB Proto Labs, Inc. |
| Sector: Industrials | |
| SubSector: Machine Tools & Accessories | |
| MarketCap: 1944.78 Millions | |
| Recent Price: 47.65 Smart Investing & Trading Score: 90 | |
| Day Percent Change: 6.69% Day Change: 1.92 | |
| Week Change: 7.81% Year-to-date Change: 21.9% | |
| PRLB Links: Profile News Message Board | |
| Charts:- Daily , Weekly | |
| Add PRLB to Watchlist: View: Get Complete PRLB Trend Analysis ➞ | |
 | MIR Mirion Technologies, Inc. |
| Sector: Industrials | |
| SubSector: Specialty Industrial Machinery | |
| MarketCap: 1920 Millions | |
| Recent Price: 22.29 Smart Investing & Trading Score: 90 | |
| Day Percent Change: 1.01% Day Change: 0.11 | |
| Week Change: 3.67% Year-to-date Change: 27.7% | |
| MIR Links: Profile News Message Board | |
| Charts:- Daily , Weekly | |
| Add MIR to Watchlist: View: Get Complete MIR Trend Analysis ➞ | |
 | ATMU Atmus Filtration Technologies Inc. |
| Sector: Industrials | |
| SubSector: Pollution & Treatment Controls | |
| MarketCap: 1830 Millions | |
| Recent Price: 43.96 Smart Investing & Trading Score: 56 | |
| Day Percent Change: 2.81% Day Change: 0.94 | |
| Week Change: 15.47% Year-to-date Change: 12.4% | |
| ATMU Links: Profile News Message Board | |
| Charts:- Daily , Weekly | |
| Add ATMU to Watchlist: View: Get Complete ATMU Trend Analysis ➞ | |
 | HLMN Hillman Solutions Corp. |
| Sector: Industrials | |
| SubSector: Tools & Accessories | |
| MarketCap: 1720 Millions | |
| Recent Price: 9.86 Smart Investing & Trading Score: 80 | |
| Day Percent Change: 3.59% Day Change: 0.33 | |
| Week Change: 1.86% Year-to-date Change: 1.2% | |
| HLMN Links: Profile News Message Board | |
| Charts:- Daily , Weekly | |
| Add HLMN to Watchlist: View: Get Complete HLMN Trend Analysis ➞ | |
 | BLDR Builders FirstSource, Inc. |
| Sector: Industrials | |
| SubSector: General Building Materials | |
| MarketCap: 1714.63 Millions | |
| Recent Price: 137.45 Smart Investing & Trading Score: 80 | |
| Day Percent Change: 20.11% Day Change: 30.51 | |
| Week Change: 3.38% Year-to-date Change: -3.8% | |
| BLDR Links: Profile News Message Board | |
| Charts:- Daily , Weekly | |
| Add BLDR to Watchlist: View: Get Complete BLDR Trend Analysis ➞ | |
 | FSS Federal Signal Corporation |
| Sector: Industrials | |
| SubSector: Pollution & Treatment Controls | |
| MarketCap: 1694.05 Millions | |
| Recent Price: 129.80 Smart Investing & Trading Score: 100 | |
| Day Percent Change: 56.94% Day Change: 34.09 | |
| Week Change: 3.33% Year-to-date Change: 41.0% | |
| FSS Links: Profile News Message Board | |
| Charts:- Daily , Weekly | |
| Add FSS to Watchlist: View: Get Complete FSS Trend Analysis ➞ | |
 | ACA Arcosa, Inc. |
| Sector: Industrials | |
| SubSector: Farm & Construction Machinery | |
| MarketCap: 1692.57 Millions | |
| Recent Price: 99.25 Smart Investing & Trading Score: 100 | |
| Day Percent Change: 19.85% Day Change: 15.14 | |
| Week Change: 16.57% Year-to-date Change: 2.7% | |
| ACA Links: Profile News Message Board | |
| Charts:- Daily , Weekly | |
| Add ACA to Watchlist: View: Get Complete ACA Trend Analysis ➞ | |
 | ERJ Embraer S.A. |
| Sector: Industrials | |
| SubSector: Aerospace/Defense Products & Services | |
| MarketCap: 1623.71 Millions | |
| Recent Price: 58.71 Smart Investing & Trading Score: 80 | |
| Day Percent Change: 128.34% Day Change: 18.93 | |
| Week Change: 2.69% Year-to-date Change: 60.2% | |
| ERJ Links: Profile News Message Board | |
| Charts:- Daily , Weekly | |
| Add ERJ to Watchlist: View: Get Complete ERJ Trend Analysis ➞ | |
 | PCT PureCycle Technologies, Inc. |
| Sector: Industrials | |
| SubSector: Pollution & Treatment Controls | |
| MarketCap: 1610 Millions | |
| Recent Price: 13.28 Smart Investing & Trading Score: 60 | |
| Day Percent Change: -0.17% Day Change: -0.01 | |
| Week Change: 0.3% Year-to-date Change: 29.6% | |
| PCT Links: Profile News Message Board | |
| Charts:- Daily , Weekly | |
| Add PCT to Watchlist: View: Get Complete PCT Trend Analysis ➞ | |
| For tabular summary view of above stock list: Summary View ➞ 0 - 25 , 25 - 50 , 50 - 75 , 75 - 100 , 100 - 125 , 125 - 150 , 150 - 175 , 175 - 200 , 200 - 225 , 225 - 250 , 250 - 275 | ||
| Click To Change The Sort Order: By Market Cap or Company Size Performance: Year-to-date, Week and Day | |
| Select Chart Type: | ||
|
Best Stocks Today 12Stocks.com |
© 2025 12Stocks.com Terms & Conditions Privacy Contact Us
All Information Provided Only For Education And Not To Be Used For Investing or Trading. See Terms & Conditions


One More Thing ... Get Best Stocks Delivered Daily!
Never Ever Miss A Move With Our Top Ten Stocks Lists
Find Best Stocks In Any Market - Bull or Bear Market
Take A Peek At Our Top Ten Stocks Lists: Daily, Weekly, Year-to-Date & Top Trends
Find Best Stocks In Any Market - Bull or Bear Market
Take A Peek At Our Top Ten Stocks Lists: Daily, Weekly, Year-to-Date & Top Trends
Industrial Stocks With Best Up Trends [0-bearish to 100-bullish]: Construction Partners[100], Comfort Systems[100], Granite Construction[100], Armstrong World[100], Federal Signal[100], Legacy Housing[100], Arcosa [100], Donaldson [100], Evolv Technologies[100], Powell Industries[100], TopBuild [100]
Best Industrial Stocks Year-to-Date:
China Yuchai[204.95%], Amprius Technologies[177.14%], Tutor Perini[142.85%], American Superconductor[126.9%], Joby Aviation[121.53%], Solid Power[118.52%], NuScale Power[112.88%], Astronics [105.58%], Evolv Technologies[89.87%], Sterling Construction[83.08%], IES [76.01%] Best Industrial Stocks This Week:
CompoSecure [33.1%], LegalZoom.com [26.63%], Frontier [24.53%], Tutor Perini[23.31%], Installed Building[22.1%], Construction Partners[21.29%], China Yuchai[21.11%], JELD-WEN Holding[20.69%], Montrose Environmental[20.11%], Sun Country[17.38%], Arcosa [16.57%] Best Industrial Stocks Daily:
Embraer S.A[128.34%], Virgin Galactic[105.78%], Graham [92.69%], Argan [92.17%], AeroVironment [91.63%], Construction Partners[90.54%], Comfort Systems[86.98%], Toll Brothers[84.15%], Granite Construction[74.15%], Eastern [68.24%], Armstrong World[62.49%]