
 Login Sign Up


| |||||
 |  | ||||

| 12Stocks.com Market Intelligence |
Best Healthcare Stocks
 | "Discover best trending healthcare stocks with 12Stocks.com." |
| - Subu Vdaygiri, Founder, 12Stocks.com |
| In a hurry? Healthcare Stocks Lists: Performance Trends Table, Stock Charts
Sort Healthcare stocks: Daily, Weekly, Year-to-Date, Market Cap & Trends. Filter Healthcare stocks list by size:All Healthcare Large Mid-Range Small |
| 12Stocks.com Healthcare Stocks Performances & Trends Daily | |||||||||
|
|  The overall Smart Investing & Trading Score is 100 (0-bearish to 100-bullish) which puts Healthcare sector in short term bullish trend. The Smart Investing & Trading Score from previous trading session is 70 and an improvement of trend continues.
| ||||||||
Here are the Smart Investing & Trading Scores of the most requested Healthcare stocks at 12Stocks.com (click stock name for detailed review):
|


| 12Stocks.com: Investing in Healthcare sector with Stocks | |
|
The following table helps investors and traders sort through current performance and trends (as measured by Smart Investing & Trading Score) of various
stocks in the Healthcare sector. Quick View: Move mouse or cursor over stock symbol (ticker) to view short-term Technical chart and over stock name to view long term chart. Click on  to add stock symbol to your watchlist and to add stock symbol to your watchlist and  to view watchlist. Click on any ticker or stock name for detailed market intelligence report for that stock. to view watchlist. Click on any ticker or stock name for detailed market intelligence report for that stock. |
12Stocks.com Performance of Stocks in Healthcare Sector
| Ticker | Stock Name | Watchlist | Category | Recent Price | Smart Investing & Trading Score | Change % | YTD Change% |
| BVXV | BiondVax |   | Biotechnology | 6.90 | 40 | 7.81% | 0.00% |
| BSGM | Biosig Technologies | | Medical Devices | 5.18 | 40 | 7.69% | 270.00% |
| PETS | Petmed Express | | Pharmaceutical Retailers | 2.63 | 40 | 7.35% | -43.32% |
| BCEL | Atreca | | Biotechnology | 0.09 | 40 | 4.65% | 0.00% |
| EYPT | EyePoint | | Biotechnology | 13.49 | 40 | 4.49% | 68.06% |
| HUM | Humana | | Healthcare Plans | 256.62 | 40 | 3.99% | 2.28% |
| SXTC | China SXT | | Drug Manufacturers - Specialty & Generic | 1.65 | 40 | 3.13% | -57.71% |
| CCCC | C4 | | Biotechnology | 2.21 | 40 | 2.79% | -39.62% |
| MASI | Masimo Corp | | Medical Devices | 146.09 | 40 | 2.49% | -13.34% |
| IDXX | Idexx | | Diagnostics & Research | 633.84 | 40 | 2.21% | 55.03% |
| VCEL | Vericel Corp | | Biotechnology | 31.52 | 40 | 1.97% | -42.81% |
| SMMT | Summit | | Biotechnology | 20.87 | 40 | 1.85% | 13.73% |
| RMTI | Rockwell | | Drug Manufacturers - Specialty & Generic | 1.21 | 40 | 1.68% | -45.50% |
| PEN | Penumbra | | Medical Devices | 253.49 | 40 | 1.55% | 5.63% |
| SRRK | Scholar Rock | | Biotechnology | 35.20 | 40 | 1.50% | -20.29% |
| KRON | Kronos Bio | | Biotechnology | 0.88 | 40 | 1.49% | -9.29% |
| KPTI | Karyopharm | | Biotechnology | 6.30 | 40 | 1.45% | -48.25% |
| NDRM | NeuroDerm | | Biotechnology | 28.30 | 40 | 1.04% | 0.00% |
| OCS | Oculis Holding | | Biotechnology | 17.52 | 40 | 0.69% | 3.48% |
| GNMK | GenMark Diagnostics | | Equipment | 44.55 | 40 | 0.54% | 0.00% |
| WBA | Walgreens Boots | | Pharmaceutical Retailers | 11.98 | 40 | 0.50% | 30.36% |
| AST | Asterias Bio | | Biotechnology | 14.23 | 40 | 0.49% | 0.00% |
| BGNE | BeiGene | | Biotechnology | 184.71 | 40 | 0.49% | 0.00% |
| MMSI | Merit | | Instruments | 82.44 | 40 | 0.44% | -14.19% |
| IVTY | Invuity | | Instruments | 5.75 | 40 | 0.35% | 0.00% |
| For chart view version of above stock list: Chart View ➞ 0 - 25 , 25 - 50 , 50 - 75 , 75 - 100 , 100 - 125 , 125 - 150 , 150 - 175 , 175 - 200 , 200 - 225 , 225 - 250 , 250 - 275 , 275 - 300 , 300 - 325 , 325 - 350 , 350 - 375 , 375 - 400 , 400 - 425 , 425 - 450 , 450 - 475 , 475 - 500 , 500 - 525 , 525 - 550 , 550 - 575 , 575 - 600 , 600 - 625 , 625 - 650 , 650 - 675 , 675 - 700 , 700 - 725 , 725 - 750 , 750 - 775 , 775 - 800 , 800 - 825 , 825 - 850 , 850 - 875 , 875 - 900 , 900 - 925 , 925 - 950 , 950 - 975 , 975 - 1000 | ||
 | Click To Change The Sort Order: By Market Cap or Company Size Performance: Year-to-date, Week and Day |  |
|
Get the most comprehensive stock market coverage daily at 12Stocks.com ➞ Best Stocks Today ➞ Best Stocks Weekly ➞ Best Stocks Year-to-Date ➞ Best Stocks Trends ➞  Best Stocks Today 12Stocks.com Best Nasdaq Stocks ➞ Best S&P 500 Stocks ➞ Best Tech Stocks ➞ Best Biotech Stocks ➞ |
| Detailed Overview of Healthcare Stocks |
| Healthcare Technical Overview, Leaders & Laggards, Top Healthcare ETF Funds & Detailed Healthcare Stocks List, Charts, Trends & More |
| Healthcare Sector: Technical Analysis, Trends & YTD Performance | |
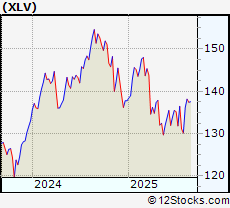
| Healthcare sector is composed of stocks
from pharmaceutical, biotech, diagnostics labs, insurance providers
and healthcare services. Healthcare sector, as represented by XLV, an exchange-traded fund [ETF] that holds basket of Healthcare stocks (e.g, Merck, Amgen) is up by 4.95646% and is currently underperforming the overall market by -9.80144% year-to-date. Below is a quick view of Technical charts and trends: |
|
 XLV Weekly Chart |
|
| Long Term Trend: Very Good | |
| Medium Term Trend: Very Good | |
 XLV Daily Chart |
|
| Short Term Trend: Very Good | |
| Overall Trend Score: 100 | |
| YTD Performance: 4.95646% | |
| **Trend Scores & Views Are Only For Educational Purposes And Not For Investing | |
| 12Stocks.com: Top Performing Healthcare Sector Stocks | ||||||||||||||||||||||||||||||||||||||||||||||
 The top performing Healthcare sector stocks year to date are
Now, more recently, over last week, the top performing Healthcare sector stocks on the move are


|
||||||||||||||||||||||||||||||||||||||||||||||
| 12Stocks.com: Investing in Healthcare Sector using Exchange Traded Funds | |
|
The following table shows list of key exchange traded funds (ETF) that
help investors track Healthcare Index. For detailed view, check out our ETF Funds section of our website. Quick View: Move mouse or cursor over ETF symbol (ticker) to view short-term Technical chart and over ETF name to view long term chart. Click on ticker or stock name for detailed view. Click on to add stock symbol to your watchlist and to view watchlist. |
12Stocks.com List of ETFs that track Healthcare Index
| Ticker | ETF Name | Watchlist | Recent Price | Smart Investing & Trading Score | Change % | Week % | Year-to-date % |
| BTEC | Principal Healthcare Innovators | | 39.49 | 30 | 0 | 1.02328 | 0% |
| 12Stocks.com: Charts, Trends, Fundamental Data and Performances of Healthcare Stocks | |
|
We now take in-depth look at all Healthcare stocks including charts, multi-period performances and overall trends (as measured by Smart Investing & Trading Score). One can sort Healthcare stocks (click link to choose) by Daily, Weekly and by Year-to-Date performances. Also, one can sort by size of the company or by market capitalization. |
| Select Your Default Chart Type: | |||||
| |||||
| Click on stock symbol or name for detailed view. Click on to add stock symbol to your watchlist and to view watchlist. Quick View: Move mouse or cursor over "Daily" to quickly view daily Technical stock chart and over "Weekly" to view weekly Technical stock chart. | |||||

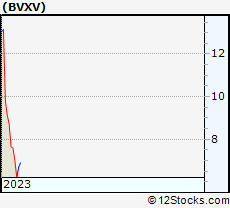 | BVXV BiondVax Pharmaceuticals Ltd. |
| Sector: Health Care | |
| SubSector: Biotechnology | |
| MarketCap: 76.3785 Millions | |
| Recent Price: 6.90 Smart Investing & Trading Score: 40 | |
| Day Percent Change: 7.8125% Day Change: -9999 | |
| Week Change: 8.32025% Year-to-date Change: 0.0% | |
| BVXV Links: Profile News Message Board | |
| Charts:- Daily , Weekly | |
| Add BVXV to Watchlist: View: Get Complete BVXV Trend Analysis ➞ | |
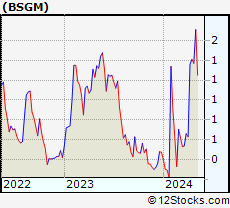 | BSGM Biosig Technologies Inc |
| Sector: Health Care | |
| SubSector: Medical Devices | |
| MarketCap: 155.54 Millions | |
| Recent Price: 5.18 Smart Investing & Trading Score: 40 | |
| Day Percent Change: 7.69231% Day Change: -9999 | |
| Week Change: 40.7609% Year-to-date Change: 270.0% | |
| BSGM Links: Profile News Message Board | |
| Charts:- Daily , Weekly | |
| Add BSGM to Watchlist: View: Get Complete BSGM Trend Analysis ➞ | |
 | PETS Petmed Express, Inc |
| Sector: Health Care | |
| SubSector: Pharmaceutical Retailers | |
| MarketCap: 63 Millions | |
| Recent Price: 2.63 Smart Investing & Trading Score: 40 | |
| Day Percent Change: 7.34694% Day Change: -0.03 | |
| Week Change: -0.378788% Year-to-date Change: -43.3% | |
| PETS Links: Profile News Message Board | |
| Charts:- Daily , Weekly | |
| Add PETS to Watchlist: View: Get Complete PETS Trend Analysis ➞ | |
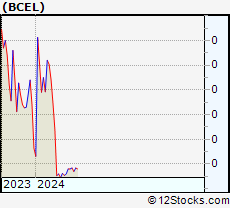 | BCEL Atreca, Inc. |
| Sector: Health Care | |
| SubSector: Biotechnology | |
| MarketCap: 466.985 Millions | |
| Recent Price: 0.09 Smart Investing & Trading Score: 40 | |
| Day Percent Change: 4.65116% Day Change: -9999 | |
| Week Change: 0% Year-to-date Change: 0.0% | |
| BCEL Links: Profile News Message Board | |
| Charts:- Daily , Weekly | |
| Add BCEL to Watchlist: View: Get Complete BCEL Trend Analysis ➞ | |
 | EYPT EyePoint Pharmaceuticals Inc |
| Sector: Health Care | |
| SubSector: Biotechnology | |
| MarketCap: 965.67 Millions | |
| Recent Price: 13.49 Smart Investing & Trading Score: 40 | |
| Day Percent Change: 4.4909% Day Change: 0.09 | |
| Week Change: -4.15483% Year-to-date Change: 68.1% | |
| EYPT Links: Profile News Message Board | |
| Charts:- Daily , Weekly | |
| Add EYPT to Watchlist: View: Get Complete EYPT Trend Analysis ➞ | |
 | HUM Humana Inc |
| Sector: Health Care | |
| SubSector: Healthcare Plans | |
| MarketCap: 37034.1 Millions | |
| Recent Price: 256.62 Smart Investing & Trading Score: 40 | |
| Day Percent Change: 3.99157% Day Change: 7.65 | |
| Week Change: -2.04222% Year-to-date Change: 2.3% | |
| HUM Links: Profile News Message Board | |
| Charts:- Daily , Weekly | |
| Add HUM to Watchlist: View: Get Complete HUM Trend Analysis ➞ | |
 | SXTC China SXT Pharmaceuticals Inc |
| Sector: Health Care | |
| SubSector: Drug Manufacturers - Specialty & Generic | |
| MarketCap: 186.8 Millions | |
| Recent Price: 1.65 Smart Investing & Trading Score: 40 | |
| Day Percent Change: 3.125% Day Change: -0.03 | |
| Week Change: -14.9485% Year-to-date Change: -57.7% | |
| SXTC Links: Profile News Message Board | |
| Charts:- Daily , Weekly | |
| Add SXTC to Watchlist: View: Get Complete SXTC Trend Analysis ➞ | |
 | CCCC C4 Therapeutics Inc |
| Sector: Health Care | |
| SubSector: Biotechnology | |
| MarketCap: 193.58 Millions | |
| Recent Price: 2.21 Smart Investing & Trading Score: 40 | |
| Day Percent Change: 2.7907% Day Change: 0.01 | |
| Week Change: -8.67769% Year-to-date Change: -39.6% | |
| CCCC Links: Profile News Message Board | |
| Charts:- Daily , Weekly | |
| Add CCCC to Watchlist: View: Get Complete CCCC Trend Analysis ➞ | |
 | MASI Masimo Corp |
| Sector: Health Care | |
| SubSector: Medical Devices | |
| MarketCap: 7996.07 Millions | |
| Recent Price: 146.09 Smart Investing & Trading Score: 40 | |
| Day Percent Change: 2.49053% Day Change: 3.23 | |
| Week Change: 4.03789% Year-to-date Change: -13.3% | |
| MASI Links: Profile News Message Board | |
| Charts:- Daily , Weekly | |
| Add MASI to Watchlist: View: Get Complete MASI Trend Analysis ➞ | |
 | IDXX Idexx Laboratories, Inc |
| Sector: Health Care | |
| SubSector: Diagnostics & Research | |
| MarketCap: 51442.2 Millions | |
| Recent Price: 633.84 Smart Investing & Trading Score: 40 | |
| Day Percent Change: 2.21412% Day Change: 10.88 | |
| Week Change: 1.06351% Year-to-date Change: 55.0% | |
| IDXX Links: Profile News Message Board | |
| Charts:- Daily , Weekly | |
| Add IDXX to Watchlist: View: Get Complete IDXX Trend Analysis ➞ | |
 | VCEL Vericel Corp |
| Sector: Health Care | |
| SubSector: Biotechnology | |
| MarketCap: 1718.17 Millions | |
| Recent Price: 31.52 Smart Investing & Trading Score: 40 | |
| Day Percent Change: 1.97347% Day Change: 0.08 | |
| Week Change: 4.19835% Year-to-date Change: -42.8% | |
| VCEL Links: Profile News Message Board | |
| Charts:- Daily , Weekly | |
| Add VCEL to Watchlist: View: Get Complete VCEL Trend Analysis ➞ | |
 | SMMT Summit Therapeutics Inc |
| Sector: Health Care | |
| SubSector: Biotechnology | |
| MarketCap: 19294.6 Millions | |
| Recent Price: 20.87 Smart Investing & Trading Score: 40 | |
| Day Percent Change: 1.85456% Day Change: 0.14 | |
| Week Change: 1.80488% Year-to-date Change: 13.7% | |
| SMMT Links: Profile News Message Board | |
| Charts:- Daily , Weekly | |
| Add SMMT to Watchlist: View: Get Complete SMMT Trend Analysis ➞ | |
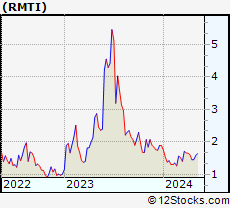 | RMTI Rockwell Medical Inc |
| Sector: Health Care | |
| SubSector: Drug Manufacturers - Specialty & Generic | |
| MarketCap: 55.78 Millions | |
| Recent Price: 1.21 Smart Investing & Trading Score: 40 | |
| Day Percent Change: 1.68067% Day Change: 0.1 | |
| Week Change: -3.96825% Year-to-date Change: -45.5% | |
| RMTI Links: Profile News Message Board | |
| Charts:- Daily , Weekly | |
| Add RMTI to Watchlist: View: Get Complete RMTI Trend Analysis ➞ | |
 | PEN Penumbra Inc |
| Sector: Health Care | |
| SubSector: Medical Devices | |
| MarketCap: 10976.7 Millions | |
| Recent Price: 253.49 Smart Investing & Trading Score: 40 | |
| Day Percent Change: 1.54629% Day Change: 3.3 | |
| Week Change: -0.063079% Year-to-date Change: 5.6% | |
| PEN Links: Profile News Message Board | |
| Charts:- Daily , Weekly | |
| Add PEN to Watchlist: View: Get Complete PEN Trend Analysis ➞ | |
 | SRRK Scholar Rock Holding Corp |
| Sector: Health Care | |
| SubSector: Biotechnology | |
| MarketCap: 3019.36 Millions | |
| Recent Price: 35.20 Smart Investing & Trading Score: 40 | |
| Day Percent Change: 1.49942% Day Change: 0.19 | |
| Week Change: 4.38909% Year-to-date Change: -20.3% | |
| SRRK Links: Profile News Message Board | |
| Charts:- Daily , Weekly | |
| Add SRRK to Watchlist: View: Get Complete SRRK Trend Analysis ➞ | |
 | KRON Kronos Bio, Inc. |
| Sector: Health Care | |
| SubSector: Biotechnology | |
| MarketCap: 17287 Millions | |
| Recent Price: 0.88 Smart Investing & Trading Score: 40 | |
| Day Percent Change: 1.48772% Day Change: -9999 | |
| Week Change: 0.89429% Year-to-date Change: -9.3% | |
| KRON Links: Profile News Message Board | |
| Charts:- Daily , Weekly | |
| Add KRON to Watchlist: View: Get Complete KRON Trend Analysis ➞ | |
 | KPTI Karyopharm Therapeutics Inc |
| Sector: Health Care | |
| SubSector: Biotechnology | |
| MarketCap: 57.23 Millions | |
| Recent Price: 6.30 Smart Investing & Trading Score: 40 | |
| Day Percent Change: 1.44928% Day Change: -0.48 | |
| Week Change: -8.43023% Year-to-date Change: -48.3% | |
| KPTI Links: Profile News Message Board | |
| Charts:- Daily , Weekly | |
| Add KPTI to Watchlist: View: Get Complete KPTI Trend Analysis ➞ | |
 | NDRM NeuroDerm Ltd. |
| Sector: Health Care | |
| SubSector: Biotechnology | |
| MarketCap: 728.6 Millions | |
| Recent Price: 28.30 Smart Investing & Trading Score: 40 | |
| Day Percent Change: 1.03534% Day Change: -9999 | |
| Week Change: -2.88264% Year-to-date Change: 0.0% | |
| NDRM Links: Profile News Message Board | |
| Charts:- Daily , Weekly | |
| Add NDRM to Watchlist: View: Get Complete NDRM Trend Analysis ➞ | |
 | OCS Oculis Holding AG |
| Sector: Health Care | |
| SubSector: Biotechnology | |
| MarketCap: 939.07 Millions | |
| Recent Price: 17.52 Smart Investing & Trading Score: 40 | |
| Day Percent Change: 0.689655% Day Change: 0.25 | |
| Week Change: -1.12867% Year-to-date Change: 3.5% | |
| OCS Links: Profile News Message Board | |
| Charts:- Daily , Weekly | |
| Add OCS to Watchlist: View: Get Complete OCS Trend Analysis ➞ | |
 | GNMK GenMark Diagnostics, Inc. |
| Sector: Health Care | |
| SubSector: Medical Appliances & Equipment | |
| MarketCap: 315.88 Millions | |
| Recent Price: 44.55 Smart Investing & Trading Score: 40 | |
| Day Percent Change: 0.541638% Day Change: -9999 | |
| Week Change: -2.17391% Year-to-date Change: 0.0% | |
| GNMK Links: Profile News Message Board | |
| Charts:- Daily , Weekly | |
| Add GNMK to Watchlist: View: Get Complete GNMK Trend Analysis ➞ | |
 | WBA Walgreens Boots Alliance Inc |
| Sector: Health Care | |
| SubSector: Pharmaceutical Retailers | |
| MarketCap: 10369.4 Millions | |
| Recent Price: 11.98 Smart Investing & Trading Score: 40 | |
| Day Percent Change: 0.503356% Day Change: 0.06 | |
| Week Change: -0.827815% Year-to-date Change: 30.4% | |
| WBA Links: Profile News Message Board | |
| Charts:- Daily , Weekly | |
| Add WBA to Watchlist: View: Get Complete WBA Trend Analysis ➞ | |
 | AST Asterias Biotherapeutics, Inc. |
| Sector: Health Care | |
| SubSector: Biotechnology | |
| MarketCap: 148.51 Millions | |
| Recent Price: 14.23 Smart Investing & Trading Score: 40 | |
| Day Percent Change: 0.49435% Day Change: -9999 | |
| Week Change: -19.6045% Year-to-date Change: 0.0% | |
| AST Links: Profile News Message Board | |
| Charts:- Daily , Weekly | |
| Add AST to Watchlist: View: Get Complete AST Trend Analysis ➞ | |
 | BGNE BeiGene, Ltd. |
| Sector: Health Care | |
| SubSector: Biotechnology | |
| MarketCap: 10838.5 Millions | |
| Recent Price: 184.71 Smart Investing & Trading Score: 40 | |
| Day Percent Change: 0.489636% Day Change: -9999 | |
| Week Change: 4.65156% Year-to-date Change: 0.0% | |
| BGNE Links: Profile News Message Board | |
| Charts:- Daily , Weekly | |
| Add BGNE to Watchlist: View: Get Complete BGNE Trend Analysis ➞ | |
 | MMSI Merit Medical Systems, Inc |
| Sector: Health Care | |
| SubSector: Medical Instruments & Supplies | |
| MarketCap: 5505.6 Millions | |
| Recent Price: 82.44 Smart Investing & Trading Score: 40 | |
| Day Percent Change: 0.438596% Day Change: -0.73 | |
| Week Change: -0.770342% Year-to-date Change: -14.2% | |
| MMSI Links: Profile News Message Board | |
| Charts:- Daily , Weekly | |
| Add MMSI to Watchlist: View: Get Complete MMSI Trend Analysis ➞ | |
 | IVTY Invuity, Inc. |
| Sector: Health Care | |
| SubSector: Medical Instruments & Supplies | |
| MarketCap: 133.96 Millions | |
| Recent Price: 5.75 Smart Investing & Trading Score: 40 | |
| Day Percent Change: 0.34904% Day Change: -9999 | |
| Week Change: 228.571% Year-to-date Change: 0.0% | |
| IVTY Links: Profile News Message Board | |
| Charts:- Daily , Weekly | |
| Add IVTY to Watchlist: View: Get Complete IVTY Trend Analysis ➞ | |
| For tabular summary view of above stock list: Summary View ➞ 0 - 25 , 25 - 50 , 50 - 75 , 75 - 100 , 100 - 125 , 125 - 150 , 150 - 175 , 175 - 200 , 200 - 225 , 225 - 250 , 250 - 275 , 275 - 300 , 300 - 325 , 325 - 350 , 350 - 375 , 375 - 400 , 400 - 425 , 425 - 450 , 450 - 475 , 475 - 500 , 500 - 525 , 525 - 550 , 550 - 575 , 575 - 600 , 600 - 625 , 625 - 650 , 650 - 675 , 675 - 700 , 700 - 725 , 725 - 750 , 750 - 775 , 775 - 800 , 800 - 825 , 825 - 850 , 850 - 875 , 875 - 900 , 900 - 925 , 925 - 950 , 950 - 975 , 975 - 1000 | ||
| Click To Change The Sort Order: By Market Cap or Company Size Performance: Year-to-date, Week and Day | |
| Select Chart Type: | ||
|
Best Stocks Today 12Stocks.com |
© 2025 12Stocks.com Terms & Conditions Privacy Contact Us
All Information Provided Only For Education And Not To Be Used For Investing or Trading. See Terms & Conditions


One More Thing ... Get Best Stocks Delivered Daily!
Never Ever Miss A Move With Our Top Ten Stocks Lists
Find Best Stocks In Any Market - Bull or Bear Market
Take A Peek At Our Top Ten Stocks Lists: Daily, Weekly, Year-to-Date & Top Trends
Find Best Stocks In Any Market - Bull or Bear Market
Take A Peek At Our Top Ten Stocks Lists: Daily, Weekly, Year-to-Date & Top Trends
Healthcare Stocks With Best Up Trends [0-bearish to 100-bullish]: Taysha Gene[100], DBV Technologies[100], Valneva SE[100], ClearPoint Neuro[100], Prime Medicine[100], AlloVir [100], Sarepta [100], Monopar [100], Cara [100], Absci Corp[100], Spruce Biosciences[100]
Best Healthcare Stocks Year-to-Date:
Regencell Bioscience[12636.6%], Kaleido BioSciences[9900%], Vor Biopharma[3175%], Nanobiotix ADR[581.379%], Eagle [542.857%], So-Young [395.711%], I-Mab ADR[357.506%], Monopar [337.489%], Nektar [319.84%], 908 Devices[299.543%], DBV Technologies[276.923%] Best Healthcare Stocks This Week:
Athersys [193287%], Nobilis Health[101349%], VBI Vaccines[86898.5%], ContraFect [47677.8%], Clovis Oncology[39610.5%], Endo [28369.6%], NanoString Technologies[17224.7%], Neptune Wellness[14100%], ViewRay [11470.2%], Mallkrodt [11382.1%], Achillion [10033.3%] Best Healthcare Stocks Daily:
Kaleido BioSciences[9900%], Neoleukin [332.665%], Syros [226.23%], Athenex [103.333%], Taysha Gene[53.4591%], DBV Technologies[21.6485%], Valneva SE[20.197%], ClearPoint Neuro[19.7991%], Prime Medicine[19.4097%], Accelerate Diagnostics[17.6471%], Aptose Biosciences[17.5439%]