
 Login Sign Up


| |||||
 |  | ||||

| 12Stocks.com Market Intelligence |
Best Healthcare Stocks
 | "Discover best trending healthcare stocks with 12Stocks.com." |
| - Subu Vdaygiri, Founder, 12Stocks.com |
| In a hurry? Healthcare Stocks Lists: Performance Trends Table, Stock Charts
Sort Healthcare stocks: Daily, Weekly, Year-to-Date, Market Cap & Trends. Filter Healthcare stocks list by size:All Healthcare Large Mid-Range Small |
| 12Stocks.com Healthcare Stocks Performances & Trends Daily | |||||||||
|
|  The overall Smart Investing & Trading Score is 25 (0-bearish to 100-bullish) which puts Healthcare sector in short term bearish to neutral trend. The Smart Investing & Trading Score from previous trading session is 18 and hence an improvement of trend.
| ||||||||
Here are the Smart Investing & Trading Scores of the most requested Healthcare stocks at 12Stocks.com (click stock name for detailed review):
|


| 12Stocks.com: Investing in Healthcare sector with Stocks | |
|
The following table helps investors and traders sort through current performance and trends (as measured by Smart Investing & Trading Score) of various
stocks in the Healthcare sector. Quick View: Move mouse or cursor over stock symbol (ticker) to view short-term Technical chart and over stock name to view long term chart. Click on  to add stock symbol to your watchlist and to add stock symbol to your watchlist and  to view watchlist. Click on any ticker or stock name for detailed market intelligence report for that stock. to view watchlist. Click on any ticker or stock name for detailed market intelligence report for that stock. |
12Stocks.com Performance of Stocks in Healthcare Sector
| Ticker | Stock Name | Watchlist | Category | Recent Price | Smart Investing & Trading Score | Change % | YTD Change% |
| LNSR | LENSAR |   | Medical Devices | 3.14 | 17 | 1.29% | -10.54% |
| MASS | 908 Devices | | Medical Devices | 5.67 | 17 | 1.16% | -49.33% |
| NHC | National | | Long-Term | 88.93 | 17 | 1.11% | -3.78% |
| USNA | USANA Health | | Pharmaceutical | 43.90 | 17 | 0.99% | -18.10% |
| SNDX | Syndax | | Biotechnology | 20.68 | 17 | 0.90% | -4.33% |
| ALNY | Alnylam | | Biotechnology | 146.32 | 17 | 0.80% | -23.56% |
| TMCI | Treace | | Medical Devices | 11.36 | 17 | 0.53% | -10.83% |
| RLAY | Relay | | Biotechnology | 6.15 | 17 | 0.49% | -44.09% |
| LH | Laboratory | | Laboratories | 200.28 | 17 | 0.42% | -11.88% |
| ZIMV | ZimVie | | Medical Devices | 15.56 | 17 | 0.32% | -12.19% |
| NVRO | Nevro | | Equipment | 12.33 | 17 | 0.08% | -42.70% |
| SLNO | Soleno | | Laboratories | 37.17 | 17 | 0.05% | -7.65% |
| KMDA | Kamada | | Biotechnology | 5.10 | 17 | 0.00% | -16.67% |
| MTEM | Molecular Templates | | Biotechnology | 1.49 | 17 | 0.00% | -60.19% |
| CRBU | Caribou Biosciences | | Biotechnology | 3.91 | 17 | 0.00% | -31.52% |
| CTKB | Cytek Biosciences | | Medical Devices | 5.95 | 17 | 0.00% | -35.29% |
| ACLX | Arcellx | | Biotechnology | 52.39 | 17 | -3.41% | -6.12% |
| TERN | Terns | | Biotechnology | 4.37 | 17 | -3.32% | -33.89% |
| CUE | Cue Biopharma | | Biotechnology | 1.53 | 17 | -2.85% | -41.86% |
| CDMO | Avid Bioservices | | Biotechnology | 6.37 | 17 | -2.68% | -2.08% |
| PLSE | Pulse Biosciences | | Instruments | 7.20 | 17 | -2.17% | -41.18% |
| RCUS | Arcus Biosciences | | Biotechnology | 14.54 | 17 | -2.02% | -23.87% |
| INZY | Inozyme Pharma | | Biotechnology | 4.49 | 17 | -1.86% | 5.41% |
| AKYA | Akoya Biosciences | | Instruments | 3.82 | 17 | -1.04% | -21.88% |
| FULC | Fulcrum | | Biotechnology | 6.99 | 17 | -0.99% | 3.56% |
| For chart view version of above stock list: Chart View ➞ 0 - 25 , 25 - 50 , 50 - 75 , 75 - 100 , 100 - 125 , 125 - 150 , 150 - 175 , 175 - 200 , 200 - 225 , 225 - 250 , 250 - 275 , 275 - 300 , 300 - 325 , 325 - 350 , 350 - 375 , 375 - 400 , 400 - 425 , 425 - 450 , 450 - 475 , 475 - 500 , 500 - 525 , 525 - 550 , 550 - 575 , 575 - 600 , 600 - 625 , 625 - 650 , 650 - 675 | ||
 | Click To Change The Sort Order: By Market Cap or Company Size Performance: Year-to-date, Week and Day |  |
|
Get the most comprehensive stock market coverage daily at 12Stocks.com ➞ Best Stocks Today ➞ Best Stocks Weekly ➞ Best Stocks Year-to-Date ➞ Best Stocks Trends ➞  Best Stocks Today 12Stocks.com Best Nasdaq Stocks ➞ Best S&P 500 Stocks ➞ Best Tech Stocks ➞ Best Biotech Stocks ➞ |
| Detailed Overview of Healthcare Stocks |
| Healthcare Technical Overview, Leaders & Laggards, Top Healthcare ETF Funds & Detailed Healthcare Stocks List, Charts, Trends & More |
| Healthcare Sector: Technical Analysis, Trends & YTD Performance | |
| Healthcare sector is composed of stocks
from pharmaceutical, biotech, diagnostics labs, insurance providers
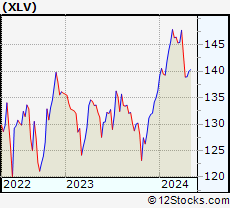
and healthcare services. Healthcare sector, as represented by XLV, an exchange-traded fund [ETF] that holds basket of Healthcare stocks (e.g, Merck, Amgen) is up by 1.84% and is currently underperforming the overall market by -2.24% year-to-date. Below is a quick view of Technical charts and trends: |
|
 XLV Weekly Chart |
|
| Long Term Trend: Not Good | |
| Medium Term Trend: Not Good | |
 XLV Daily Chart |
|
| Short Term Trend: Very Good | |
| Overall Trend Score: 25 | |
| YTD Performance: 1.84% | |
| **Trend Scores & Views Are Only For Educational Purposes And Not For Investing | |
| 12Stocks.com: Top Performing Healthcare Sector Stocks | ||||||||||||||||||||||||||||||||||||||||||||||||
 The top performing Healthcare sector stocks year to date are
Now, more recently, over last week, the top performing Healthcare sector stocks on the move are


|
||||||||||||||||||||||||||||||||||||||||||||||||
| 12Stocks.com: Investing in Healthcare Sector using Exchange Traded Funds | |
|
The following table shows list of key exchange traded funds (ETF) that
help investors track Healthcare Index. For detailed view, check out our ETF Funds section of our website. Quick View: Move mouse or cursor over ETF symbol (ticker) to view short-term Technical chart and over ETF name to view long term chart. Click on ticker or stock name for detailed view. Click on to add stock symbol to your watchlist and to view watchlist. |
12Stocks.com List of ETFs that track Healthcare Index
| Ticker | ETF Name | Watchlist | Recent Price | Smart Investing & Trading Score | Change % | Week % | Year-to-date % |
| XLV | Health Care | | 138.88 | 25 | 0.33 | -0.02 | 1.84% |
| IBB | Biotechnology | | 124.78 | 10 | 0.11 | -3.7 | -8.15% |
| BBH | Biotech | | 152.16 | 10 | -0.12 | -3.45 | -7.95% |
| IHF | Healthcare Providers | | 52.08 | 45 | 1.04 | 3.05 | -0.82% |
| PSCH | SmallCap Health Care | | 40.05 | 10 | -0.07 | -3.33 | -6.43% |
| XHS | Health Care Services | | 86.13 | 10 | -0.07 | -2.14 | -3.17% |
| PTH | DWA Healthcare Momentum | | 39.53 | 23 | -0.10 | -5.5 | 1% |
| BTEC | Principal Healthcare Innovators | | 33.86 | 0 | -0.67 | -5.92 | -6.8% |
| RXL | Health Care | | 93.43 | 25 | 1.08 | 0.19 | 2.22% |
| RXD | Short Health Care | | 11.63 | 81 | -0.39 | 0.24 | -2.49% |
| 12Stocks.com: Charts, Trends, Fundamental Data and Performances of Healthcare Stocks | |
|
We now take in-depth look at all Healthcare stocks including charts, multi-period performances and overall trends (as measured by Smart Investing & Trading Score). One can sort Healthcare stocks (click link to choose) by Daily, Weekly and by Year-to-Date performances. Also, one can sort by size of the company or by market capitalization. |
| Select Your Default Chart Type: | |||||
| |||||
| Click on stock symbol or name for detailed view. Click on to add stock symbol to your watchlist and to view watchlist. Quick View: Move mouse or cursor over "Daily" to quickly view daily Technical stock chart and over "Weekly" to view weekly Technical stock chart. | |||||

 | LNSR LENSAR, Inc. |
| Sector: Health Care | |
| SubSector: Medical Devices | |
| MarketCap: 91487 Millions | |
| Recent Price: 3.14 Smart Investing & Trading Score: 17 | |
| Day Percent Change: 1.29% Day Change: 0.04 | |
| Week Change: -4.27% Year-to-date Change: -10.5% | |
| LNSR Links: Profile News Message Board | |
| Charts:- Daily , Weekly | |
| Add LNSR to Watchlist: View: Get Complete LNSR Trend Analysis ➞ | |
 | MASS 908 Devices Inc. |
| Sector: Health Care | |
| SubSector: Medical Devices | |
| MarketCap: 225 Millions | |
| Recent Price: 5.67 Smart Investing & Trading Score: 17 | |
| Day Percent Change: 1.16% Day Change: 0.06 | |
| Week Change: -6.51% Year-to-date Change: -49.3% | |
| MASS Links: Profile News Message Board | |
| Charts:- Daily , Weekly | |
| Add MASS to Watchlist: View: Get Complete MASS Trend Analysis ➞ | |
 | NHC National HealthCare Corporation |
| Sector: Health Care | |
| SubSector: Long-Term Care Facilities | |
| MarketCap: 1164.86 Millions | |
| Recent Price: 88.93 Smart Investing & Trading Score: 17 | |
| Day Percent Change: 1.11% Day Change: 0.98 | |
| Week Change: -0.24% Year-to-date Change: -3.8% | |
| NHC Links: Profile News Message Board | |
| Charts:- Daily , Weekly | |
| Add NHC to Watchlist: View: Get Complete NHC Trend Analysis ➞ | |
 | USNA USANA Health Sciences, Inc. |
| Sector: Health Care | |
| SubSector: Drug Related Products | |
| MarketCap: 1185.13 Millions | |
| Recent Price: 43.90 Smart Investing & Trading Score: 17 | |
| Day Percent Change: 0.99% Day Change: 0.43 | |
| Week Change: -0.16% Year-to-date Change: -18.1% | |
| USNA Links: Profile News Message Board | |
| Charts:- Daily , Weekly | |
| Add USNA to Watchlist: View: Get Complete USNA Trend Analysis ➞ | |
 | SNDX Syndax Pharmaceuticals, Inc. |
| Sector: Health Care | |
| SubSector: Biotechnology | |
| MarketCap: 365.985 Millions | |
| Recent Price: 20.68 Smart Investing & Trading Score: 17 | |
| Day Percent Change: 0.90% Day Change: 0.19 | |
| Week Change: -4.81% Year-to-date Change: -4.3% | |
| SNDX Links: Profile News Message Board | |
| Charts:- Daily , Weekly | |
| Add SNDX to Watchlist: View: Get Complete SNDX Trend Analysis ➞ | |
 | ALNY Alnylam Pharmaceuticals, Inc. |
| Sector: Health Care | |
| SubSector: Biotechnology | |
| MarketCap: 12793.2 Millions | |
| Recent Price: 146.32 Smart Investing & Trading Score: 17 | |
| Day Percent Change: 0.80% Day Change: 1.16 | |
| Week Change: -1.47% Year-to-date Change: -23.6% | |
| ALNY Links: Profile News Message Board | |
| Charts:- Daily , Weekly | |
| Add ALNY to Watchlist: View: Get Complete ALNY Trend Analysis ➞ | |
 | TMCI Treace Medical Concepts, Inc. |
| Sector: Health Care | |
| SubSector: Medical Devices | |
| MarketCap: 1550 Millions | |
| Recent Price: 11.36 Smart Investing & Trading Score: 17 | |
| Day Percent Change: 0.53% Day Change: 0.06 | |
| Week Change: -4.38% Year-to-date Change: -10.8% | |
| TMCI Links: Profile News Message Board | |
| Charts:- Daily , Weekly | |
| Add TMCI to Watchlist: View: Get Complete TMCI Trend Analysis ➞ | |
 | RLAY Relay Therapeutics, Inc. |
| Sector: Health Care | |
| SubSector: Biotechnology | |
| MarketCap: 45887 Millions | |
| Recent Price: 6.15 Smart Investing & Trading Score: 17 | |
| Day Percent Change: 0.49% Day Change: 0.03 | |
| Week Change: -12.52% Year-to-date Change: -44.1% | |
| RLAY Links: Profile News Message Board | |
| Charts:- Daily , Weekly | |
| Add RLAY to Watchlist: View: Get Complete RLAY Trend Analysis ➞ | |
 | LH Laboratory Corporation of America Holdings |
| Sector: Health Care | |
| SubSector: Medical Laboratories & Research | |
| MarketCap: 12119.2 Millions | |
| Recent Price: 200.28 Smart Investing & Trading Score: 17 | |
| Day Percent Change: 0.42% Day Change: 0.83 | |
| Week Change: -2.65% Year-to-date Change: -11.9% | |
| LH Links: Profile News Message Board | |
| Charts:- Daily , Weekly | |
| Add LH to Watchlist: View: Get Complete LH Trend Analysis ➞ | |
 | ZIMV ZimVie Inc. |
| Sector: Health Care | |
| SubSector: Medical Devices | |
| MarketCap: 303 Millions | |
| Recent Price: 15.56 Smart Investing & Trading Score: 17 | |
| Day Percent Change: 0.32% Day Change: 0.05 | |
| Week Change: -2.14% Year-to-date Change: -12.2% | |
| ZIMV Links: Profile News Message Board | |
| Charts:- Daily , Weekly | |
| Add ZIMV to Watchlist: View: Get Complete ZIMV Trend Analysis ➞ | |
 | NVRO Nevro Corp. |
| Sector: Health Care | |
| SubSector: Medical Appliances & Equipment | |
| MarketCap: 2489.3 Millions | |
| Recent Price: 12.33 Smart Investing & Trading Score: 17 | |
| Day Percent Change: 0.08% Day Change: 0.01 | |
| Week Change: -6.8% Year-to-date Change: -42.7% | |
| NVRO Links: Profile News Message Board | |
| Charts:- Daily , Weekly | |
| Add NVRO to Watchlist: View: Get Complete NVRO Trend Analysis ➞ | |
 | SLNO Soleno Therapeutics, Inc. |
| Sector: Health Care | |
| SubSector: Medical Laboratories & Research | |
| MarketCap: 94 Millions | |
| Recent Price: 37.17 Smart Investing & Trading Score: 17 | |
| Day Percent Change: 0.05% Day Change: 0.02 | |
| Week Change: 0.08% Year-to-date Change: -7.7% | |
| SLNO Links: Profile News Message Board | |
| Charts:- Daily , Weekly | |
| Add SLNO to Watchlist: View: Get Complete SLNO Trend Analysis ➞ | |
 | KMDA Kamada Ltd. |
| Sector: Health Care | |
| SubSector: Biotechnology | |
| MarketCap: 238.685 Millions | |
| Recent Price: 5.10 Smart Investing & Trading Score: 17 | |
| Day Percent Change: 0.00% Day Change: 0.00 | |
| Week Change: -0.78% Year-to-date Change: -16.7% | |
| KMDA Links: Profile News Message Board | |
| Charts:- Daily , Weekly | |
| Add KMDA to Watchlist: View: Get Complete KMDA Trend Analysis ➞ | |
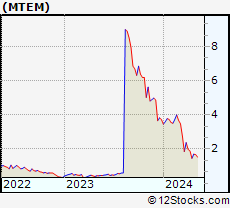 | MTEM Molecular Templates, Inc. |
| Sector: Health Care | |
| SubSector: Biotechnology | |
| MarketCap: 662.785 Millions | |
| Recent Price: 1.49 Smart Investing & Trading Score: 17 | |
| Day Percent Change: 0.00% Day Change: 0.00 | |
| Week Change: -21.43% Year-to-date Change: -60.2% | |
| MTEM Links: Profile News Message Board | |
| Charts:- Daily , Weekly | |
| Add MTEM to Watchlist: View: Get Complete MTEM Trend Analysis ➞ | |
 | CRBU Caribou Biosciences, Inc. |
| Sector: Health Care | |
| SubSector: Biotechnology | |
| MarketCap: 258 Millions | |
| Recent Price: 3.91 Smart Investing & Trading Score: 17 | |
| Day Percent Change: 0.00% Day Change: 0.00 | |
| Week Change: -6.9% Year-to-date Change: -31.5% | |
| CRBU Links: Profile News Message Board | |
| Charts:- Daily , Weekly | |
| Add CRBU to Watchlist: View: Get Complete CRBU Trend Analysis ➞ | |
 | CTKB Cytek Biosciences, Inc. |
| Sector: Health Care | |
| SubSector: Medical Devices | |
| MarketCap: 1140 Millions | |
| Recent Price: 5.95 Smart Investing & Trading Score: 17 | |
| Day Percent Change: 0.00% Day Change: 0.00 | |
| Week Change: -3.57% Year-to-date Change: -35.3% | |
| CTKB Links: Profile News Message Board | |
| Charts:- Daily , Weekly | |
| Add CTKB to Watchlist: View: Get Complete CTKB Trend Analysis ➞ | |
 | ACLX Arcellx, Inc. |
| Sector: Health Care | |
| SubSector: Biotechnology | |
| MarketCap: 1530 Millions | |
| Recent Price: 52.39 Smart Investing & Trading Score: 17 | |
| Day Percent Change: -3.41% Day Change: -1.85 | |
| Week Change: -9.78% Year-to-date Change: -6.1% | |
| ACLX Links: Profile News Message Board | |
| Charts:- Daily , Weekly | |
| Add ACLX to Watchlist: View: Get Complete ACLX Trend Analysis ➞ | |
 | TERN Terns Pharmaceuticals, Inc. |
| Sector: Health Care | |
| SubSector: Biotechnology | |
| MarketCap: 611 Millions | |
| Recent Price: 4.37 Smart Investing & Trading Score: 17 | |
| Day Percent Change: -3.32% Day Change: -0.15 | |
| Week Change: -14.98% Year-to-date Change: -33.9% | |
| TERN Links: Profile News Message Board | |
| Charts:- Daily , Weekly | |
| Add TERN to Watchlist: View: Get Complete TERN Trend Analysis ➞ | |
 | CUE Cue Biopharma, Inc. |
| Sector: Health Care | |
| SubSector: Biotechnology | |
| MarketCap: 352.785 Millions | |
| Recent Price: 1.53 Smart Investing & Trading Score: 17 | |
| Day Percent Change: -2.85% Day Change: -0.05 | |
| Week Change: -12.29% Year-to-date Change: -41.9% | |
| CUE Links: Profile News Message Board | |
| Charts:- Daily , Weekly | |
| Add CUE to Watchlist: View: Get Complete CUE Trend Analysis ➞ | |
 | CDMO Avid Bioservices, Inc. |
| Sector: Health Care | |
| SubSector: Biotechnology | |
| MarketCap: 203.685 Millions | |
| Recent Price: 6.37 Smart Investing & Trading Score: 17 | |
| Day Percent Change: -2.68% Day Change: -0.17 | |
| Week Change: -5.56% Year-to-date Change: -2.1% | |
| CDMO Links: Profile News Message Board | |
| Charts:- Daily , Weekly | |
| Add CDMO to Watchlist: View: Get Complete CDMO Trend Analysis ➞ | |
 | PLSE Pulse Biosciences, Inc. |
| Sector: Health Care | |
| SubSector: Medical Instruments & Supplies | |
| MarketCap: 131.96 Millions | |
| Recent Price: 7.20 Smart Investing & Trading Score: 17 | |
| Day Percent Change: -2.17% Day Change: -0.16 | |
| Week Change: -0.28% Year-to-date Change: -41.2% | |
| PLSE Links: Profile News Message Board | |
| Charts:- Daily , Weekly | |
| Add PLSE to Watchlist: View: Get Complete PLSE Trend Analysis ➞ | |
 | RCUS Arcus Biosciences, Inc. |
| Sector: Health Care | |
| SubSector: Biotechnology | |
| MarketCap: 539.285 Millions | |
| Recent Price: 14.54 Smart Investing & Trading Score: 17 | |
| Day Percent Change: -2.02% Day Change: -0.30 | |
| Week Change: -12.3% Year-to-date Change: -23.9% | |
| RCUS Links: Profile News Message Board | |
| Charts:- Daily , Weekly | |
| Add RCUS to Watchlist: View: Get Complete RCUS Trend Analysis ➞ | |
 | INZY Inozyme Pharma, Inc. |
| Sector: Health Care | |
| SubSector: Biotechnology | |
| MarketCap: 53487 Millions | |
| Recent Price: 4.49 Smart Investing & Trading Score: 17 | |
| Day Percent Change: -1.86% Day Change: -0.08 | |
| Week Change: -12.74% Year-to-date Change: 5.4% | |
| INZY Links: Profile News Message Board | |
| Charts:- Daily , Weekly | |
| Add INZY to Watchlist: View: Get Complete INZY Trend Analysis ➞ | |
 | AKYA Akoya Biosciences, Inc. |
| Sector: Health Care | |
| SubSector: Medical Instruments & Supplies | |
| MarketCap: 340 Millions | |
| Recent Price: 3.82 Smart Investing & Trading Score: 17 | |
| Day Percent Change: -1.04% Day Change: -0.04 | |
| Week Change: -7.51% Year-to-date Change: -21.9% | |
| AKYA Links: Profile News Message Board | |
| Charts:- Daily , Weekly | |
| Add AKYA to Watchlist: View: Get Complete AKYA Trend Analysis ➞ | |
 | FULC Fulcrum Therapeutics, Inc. |
| Sector: Health Care | |
| SubSector: Biotechnology | |
| MarketCap: 274.785 Millions | |
| Recent Price: 6.99 Smart Investing & Trading Score: 17 | |
| Day Percent Change: -0.99% Day Change: -0.07 | |
| Week Change: -10.5% Year-to-date Change: 3.6% | |
| FULC Links: Profile News Message Board | |
| Charts:- Daily , Weekly | |
| Add FULC to Watchlist: View: Get Complete FULC Trend Analysis ➞ | |
| For tabular summary view of above stock list: Summary View ➞ 0 - 25 , 25 - 50 , 50 - 75 , 75 - 100 , 100 - 125 , 125 - 150 , 150 - 175 , 175 - 200 , 200 - 225 , 225 - 250 , 250 - 275 , 275 - 300 , 300 - 325 , 325 - 350 , 350 - 375 , 375 - 400 , 400 - 425 , 425 - 450 , 450 - 475 , 475 - 500 , 500 - 525 , 525 - 550 , 550 - 575 , 575 - 600 , 600 - 625 , 625 - 650 , 650 - 675 | ||
| Click To Change The Sort Order: By Market Cap or Company Size Performance: Year-to-date, Week and Day | |
| Select Chart Type: | ||
|
Best Stocks Today 12Stocks.com |
© 2024 12Stocks.com Terms & Conditions Privacy Contact Us
All Information Provided Only For Education And Not To Be Used For Investing or Trading. See Terms & Conditions


One More Thing ... Get Best Stocks Delivered Daily!
Never Ever Miss A Move With Our Top Ten Stocks Lists
Find Best Stocks In Any Market - Bull or Bear Market
Take A Peek At Our Top Ten Stocks Lists: Daily, Weekly, Year-to-Date & Top Trends
Find Best Stocks In Any Market - Bull or Bear Market
Take A Peek At Our Top Ten Stocks Lists: Daily, Weekly, Year-to-Date & Top Trends
Healthcare Stocks With Best Up Trends [0-bearish to 100-bullish]: Oscar Health[100], ALX Oncology[95], Geron [95], Vanda [93], United [93], NuCana [93], Cullinan Oncology[93], Zhongchao [93], Lantheus [93], Rani [90], Aurora Cannabis[88]
Best Healthcare Stocks Year-to-Date:
Precision BioSciences[2746.58%], Inovio [1809.8%], Assembly Biosciences[1525.41%], Aurora Cannabis[1275.47%], NuCana [1181.27%], Agenus [581.24%], Corbus [523.84%], CareMax [456.7%], Zhongchao [412.19%], Mesoblast [369.09%], Janux [343.37%] Best Healthcare Stocks This Week:
NuCana [1592.72%], Humacyte [39.24%], ProKidney [37.43%], Regencell Bioscience[37.01%], Venus Concept[23.97%], ALX Oncology[22.49%], 23andMe Holding[22.09%], Vanda [21.12%], Galera [17.05%], Rani [16.67%], Oscar Health[15.4%] Best Healthcare Stocks Daily:
Humacyte [23.57%], Adaptimmune [14.09%], Agenus [13.48%], Hyperfine [10.37%], Pacific Biosciences[8.56%], CareMax [7.57%], Venus Concept[7.47%], Belite Bio[7.47%], Aesthetic [6.77%], Accelerate Diagnostics[6.36%], Sangamo [6.18%]