
 Login Sign Up


| |||||
 |  | ||||

| 12Stocks.com Market Intelligence |
Best Healthcare Stocks
 | "Discover best trending healthcare stocks with 12Stocks.com." |
| - Subu Vdaygiri, Founder, 12Stocks.com |
| In a hurry? Healthcare Stocks Lists: Performance Trends Table, Stock Charts
Sort Healthcare stocks: Daily, Weekly, Year-to-Date, Market Cap & Trends. Filter Healthcare stocks list by size:All Healthcare Large Mid-Range Small |
| 12Stocks.com Healthcare Stocks Performances & Trends Daily | |||||||||
|
|  The overall Smart Investing & Trading Score is 52 (0-bearish to 100-bullish) which puts Healthcare sector in short term neutral trend. The Smart Investing & Trading Score from previous trading session is 38 and an improvement of trend continues.
| ||||||||
Here are the Smart Investing & Trading Scores of the most requested Healthcare stocks at 12Stocks.com (click stock name for detailed review):
|


| 12Stocks.com: Investing in Healthcare sector with Stocks | |
|
The following table helps investors and traders sort through current performance and trends (as measured by Smart Investing & Trading Score) of various
stocks in the Healthcare sector. Quick View: Move mouse or cursor over stock symbol (ticker) to view short-term Technical chart and over stock name to view long term chart. Click on  to add stock symbol to your watchlist and to add stock symbol to your watchlist and  to view watchlist. Click on any ticker or stock name for detailed market intelligence report for that stock. to view watchlist. Click on any ticker or stock name for detailed market intelligence report for that stock. |
12Stocks.com Performance of Stocks in Healthcare Sector
| Ticker | Stock Name | Watchlist | Category | Recent Price | Smart Investing & Trading Score | Change % | YTD Change% |
| TNYA | Tenaya |   | Biotechnology | 4.40 | 51 | -1.12% | 38.36% |
| VYGR | Voyager | | Biotechnology | 7.57 | 51 | -1.05% | -10.31% |
| OGI | OrganiGram | | Pharmaceutical | 1.93 | 51 | -1.03% | 47.33% |
| MOH | Molina | | Insurance | 367.41 | 51 | 1.15% | 1.69% |
| AIQ | Alliance | | Laboratories | 32.46 | 51 | 0.40% | 4.11% |
| GLSI | Greenwich LifeSciences | | Biotechnology | 12.60 | 51 | -4.11% | 18.87% |
| LMAT | LeMaitre Vascular | | Instruments | 64.03 | 51 | -0.31% | 12.81% |
| DSGN | Design | | Biotechnology | 3.65 | 50 | 0.27% | 37.66% |
| LNSR | LENSAR | | Medical Devices | 3.18 | 50 | 0.00% | -9.40% |
| KZR | Kezar Life | | Biotechnology | 0.80 | 50 | -2.98% | -15.41% |
| URGN | UroGen Pharma | | Biotechnology | 14.21 | 50 | -2.20% | -5.27% |
| CERE | Cerevel | | Biotechnology | 41.87 | 50 | -0.29% | -1.23% |
| PRVA | Privia Health | | Health Information | 18.50 | 50 | -1.47% | -21.73% |
| BIIB | Biogen | | Biotechnology | 201.99 | 49 | 4.56% | -21.94% |
| NEPH | Nephros | | Instruments | 2.19 | 49 | 3.79% | -35.96% |
| BGNE | BeiGene | | Biotechnology | 144.12 | 49 | 3.69% | -20.09% |
| OFIX | Orthofix | | Equipment | 13.56 | 49 | 2.57% | 0.59% |
| ALKS | Alkermes | | Biotechnology | 24.65 | 49 | 1.61% | -11.14% |
| IONS | Ionis | | Biotechnology | 42.45 | 49 | 1.46% | -16.09% |
| NUVL | Nuvalent | | Biotechnology | 68.18 | 49 | 0.92% | -7.23% |
| MEIP | MEI Pharma | | Biotechnology | 3.26 | 49 | -2.16% | -43.79% |
| SLNO | Soleno | | Laboratories | 39.34 | 49 | -1.99% | -2.26% |
| MD | MEDNAX | | Specialized | 9.24 | 49 | -1.70% | -0.65% |
| CRVS | Corvus | | Biotechnology | 1.51 | 49 | -1.31% | -14.20% |
| SHC | Sotera Health | | Diagnostics & Research | 11.26 | 49 | -1.05% | -33.21% |
| For chart view version of above stock list: Chart View ➞ 0 - 25 , 25 - 50 , 50 - 75 , 75 - 100 , 100 - 125 , 125 - 150 , 150 - 175 , 175 - 200 , 200 - 225 , 225 - 250 , 250 - 275 , 275 - 300 , 300 - 325 , 325 - 350 , 350 - 375 , 375 - 400 , 400 - 425 , 425 - 450 , 450 - 475 , 475 - 500 , 500 - 525 , 525 - 550 , 550 - 575 , 575 - 600 , 600 - 625 , 625 - 650 , 650 - 675 , 675 - 700 , 700 - 725 | ||
 | Click To Change The Sort Order: By Market Cap or Company Size Performance: Year-to-date, Week and Day |  |
|
Get the most comprehensive stock market coverage daily at 12Stocks.com ➞ Best Stocks Today ➞ Best Stocks Weekly ➞ Best Stocks Year-to-Date ➞ Best Stocks Trends ➞  Best Stocks Today 12Stocks.com Best Nasdaq Stocks ➞ Best S&P 500 Stocks ➞ Best Tech Stocks ➞ Best Biotech Stocks ➞ |
| Detailed Overview of Healthcare Stocks |
| Healthcare Technical Overview, Leaders & Laggards, Top Healthcare ETF Funds & Detailed Healthcare Stocks List, Charts, Trends & More |
| Healthcare Sector: Technical Analysis, Trends & YTD Performance | |
| Healthcare sector is composed of stocks
from pharmaceutical, biotech, diagnostics labs, insurance providers
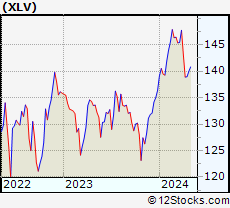
and healthcare services. Healthcare sector, as represented by XLV, an exchange-traded fund [ETF] that holds basket of Healthcare stocks (e.g, Merck, Amgen) is up by 3.28% and is currently underperforming the overall market by -2.38% year-to-date. Below is a quick view of Technical charts and trends: |
|
 XLV Weekly Chart |
|
| Long Term Trend: Good | |
| Medium Term Trend: Not Good | |
 XLV Daily Chart |
|
| Short Term Trend: Very Good | |
| Overall Trend Score: 52 | |
| YTD Performance: 3.28% | |
| **Trend Scores & Views Are Only For Educational Purposes And Not For Investing | |
| 12Stocks.com: Top Performing Healthcare Sector Stocks | ||||||||||||||||||||||||||||||||||||||||||||||||
 The top performing Healthcare sector stocks year to date are
Now, more recently, over last week, the top performing Healthcare sector stocks on the move are


|
||||||||||||||||||||||||||||||||||||||||||||||||
| 12Stocks.com: Investing in Healthcare Sector using Exchange Traded Funds | |
|
The following table shows list of key exchange traded funds (ETF) that
help investors track Healthcare Index. For detailed view, check out our ETF Funds section of our website. Quick View: Move mouse or cursor over ETF symbol (ticker) to view short-term Technical chart and over ETF name to view long term chart. Click on ticker or stock name for detailed view. Click on to add stock symbol to your watchlist and to view watchlist. |
12Stocks.com List of ETFs that track Healthcare Index
| Ticker | ETF Name | Watchlist | Recent Price | Smart Investing & Trading Score | Change % | Week % | Year-to-date % |
| XLV | Health Care | | 140.86 | 52 | -0.31 | 1.37 | 3.28% |
| XBI | Biotech | | 83.94 | 25 | -0.89 | 1.34 | -5.99% |
| IBB | Biotechnology | | 127.76 | 32 | -0.20 | 2.44 | -5.96% |
| BBH | Biotech | | 157.33 | 49 | 0.03 | 3.26 | -4.83% |
| VHT | Health Care | | 257.26 | 45 | -0.22 | 1.55 | 2.62% |
| IYH | Healthcare | | 59.09 | 45 | -0.20 | 1.6 | 3.22% |
| IHF | Healthcare Providers | | 52.26 | 55 | -0.11 | 0.1 | -0.48% |
| IHI | Medical Devices | | 55.64 | 50 | 0.23 | 2.35 | 3.09% |
| BIB | Biotechnology | | 50.18 | 32 | -0.30 | 4.11 | -12.04% |
| BIS | Short Biotech | | 20.09 | 61 | 0.75 | -3.85 | 11.18% |
| XHE | Health Care Equipment | | 83.21 | 35 | 0.24 | 2.39 | -1.25% |
| CURE | Healthcare Bull 3X | | 107.85 | 32 | -0.25 | 4.37 | 6.01% |
| LABU | Biotech Bull 3X | | 89.40 | 25 | -2.80 | 3.89 | -26.7% |
| LABD | Biotech Bear 3X | | 10.37 | 75 | 2.98 | -3.98 | 7.02% |
| PSCH | SmallCap Health Care | | 41.12 | 41 | -0.23 | 2.35 | -3.92% |
| XHS | Health Care Services | | 88.70 | 53 | -0.06 | 1.85 | -0.28% |
| PTH | DWA Healthcare Momentum | | 39.63 | 46 | -1.34 | 0.25 | 1.25% |
| BTEC | Principal Healthcare Innovators | | 34.20 | 18 | -1.73 | 1.02 | -5.85% |
| RXL | Health Care | | 96.00 | 45 | -0.15 | 2.99 | 5.03% |
| RXD | Short Health Care | | 11.34 | 45 | 0.88 | -2.54 | -4.87% |
| 12Stocks.com: Charts, Trends, Fundamental Data and Performances of Healthcare Stocks | |
|
We now take in-depth look at all Healthcare stocks including charts, multi-period performances and overall trends (as measured by Smart Investing & Trading Score). One can sort Healthcare stocks (click link to choose) by Daily, Weekly and by Year-to-Date performances. Also, one can sort by size of the company or by market capitalization. |
| Select Your Default Chart Type: | |||||
| |||||
| Click on stock symbol or name for detailed view. Click on to add stock symbol to your watchlist and to view watchlist. Quick View: Move mouse or cursor over "Daily" to quickly view daily Technical stock chart and over "Weekly" to view weekly Technical stock chart. | |||||

 | TNYA Tenaya Therapeutics, Inc. |
| Sector: Health Care | |
| SubSector: Biotechnology | |
| MarketCap: 395 Millions | |
| Recent Price: 4.40 Smart Investing & Trading Score: 51 | |
| Day Percent Change: -1.12% Day Change: -0.05 | |
| Week Change: 1.85% Year-to-date Change: 38.4% | |
| TNYA Links: Profile News Message Board | |
| Charts:- Daily , Weekly | |
| Add TNYA to Watchlist: View: Get Complete TNYA Trend Analysis ➞ | |
 | VYGR Voyager Therapeutics, Inc. |
| Sector: Health Care | |
| SubSector: Biotechnology | |
| MarketCap: 321.085 Millions | |
| Recent Price: 7.57 Smart Investing & Trading Score: 51 | |
| Day Percent Change: -1.05% Day Change: -0.08 | |
| Week Change: 0.93% Year-to-date Change: -10.3% | |
| VYGR Links: Profile News Message Board | |
| Charts:- Daily , Weekly | |
| Add VYGR to Watchlist: View: Get Complete VYGR Trend Analysis ➞ | |
 | OGI OrganiGram Holdings Inc. |
| Sector: Health Care | |
| SubSector: Drugs - Generic | |
| MarketCap: 256.885 Millions | |
| Recent Price: 1.93 Smart Investing & Trading Score: 51 | |
| Day Percent Change: -1.03% Day Change: -0.02 | |
| Week Change: 2.66% Year-to-date Change: 47.3% | |
| OGI Links: Profile News Message Board | |
| Charts:- Daily , Weekly | |
| Add OGI to Watchlist: View: Get Complete OGI Trend Analysis ➞ | |
 | MOH Molina Healthcare, Inc. |
| Sector: Health Care | |
| SubSector: Health Care Plans | |
| MarketCap: 7235.6 Millions | |
| Recent Price: 367.41 Smart Investing & Trading Score: 51 | |
| Day Percent Change: 1.15% Day Change: 4.19 | |
| Week Change: -0.03% Year-to-date Change: 1.7% | |
| MOH Links: Profile News Message Board | |
| Charts:- Daily , Weekly | |
| Add MOH to Watchlist: View: Get Complete MOH Trend Analysis ➞ | |
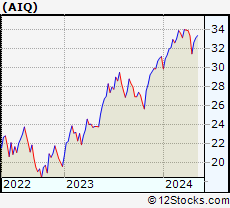 | AIQ Alliance Healthcare Services, Inc. |
| Sector: Health Care | |
| SubSector: Medical Laboratories & Research | |
| MarketCap: 105.79 Millions | |
| Recent Price: 32.46 Smart Investing & Trading Score: 51 | |
| Day Percent Change: 0.40% Day Change: 0.13 | |
| Week Change: 3.18% Year-to-date Change: 4.1% | |
| AIQ Links: Profile News Message Board | |
| Charts:- Daily , Weekly | |
| Add AIQ to Watchlist: View: Get Complete AIQ Trend Analysis ➞ | |
 | GLSI Greenwich LifeSciences, Inc. |
| Sector: Health Care | |
| SubSector: Biotechnology | |
| MarketCap: 86487 Millions | |
| Recent Price: 12.60 Smart Investing & Trading Score: 51 | |
| Day Percent Change: -4.11% Day Change: -0.54 | |
| Week Change: -3.15% Year-to-date Change: 18.9% | |
| GLSI Links: Profile News Message Board | |
| Charts:- Daily , Weekly | |
| Add GLSI to Watchlist: View: Get Complete GLSI Trend Analysis ➞ | |
 | LMAT LeMaitre Vascular, Inc. |
| Sector: Health Care | |
| SubSector: Medical Instruments & Supplies | |
| MarketCap: 522.16 Millions | |
| Recent Price: 64.03 Smart Investing & Trading Score: 51 | |
| Day Percent Change: -0.31% Day Change: -0.20 | |
| Week Change: 1.22% Year-to-date Change: 12.8% | |
| LMAT Links: Profile News Message Board | |
| Charts:- Daily , Weekly | |
| Add LMAT to Watchlist: View: Get Complete LMAT Trend Analysis ➞ | |
 | DSGN Design Therapeutics, Inc. |
| Sector: Health Care | |
| SubSector: Biotechnology | |
| MarketCap: 367 Millions | |
| Recent Price: 3.65 Smart Investing & Trading Score: 50 | |
| Day Percent Change: 0.27% Day Change: 0.01 | |
| Week Change: -1.22% Year-to-date Change: 37.7% | |
| DSGN Links: Profile News Message Board | |
| Charts:- Daily , Weekly | |
| Add DSGN to Watchlist: View: Get Complete DSGN Trend Analysis ➞ | |
 | LNSR LENSAR, Inc. |
| Sector: Health Care | |
| SubSector: Medical Devices | |
| MarketCap: 91487 Millions | |
| Recent Price: 3.18 Smart Investing & Trading Score: 50 | |
| Day Percent Change: 0.00% Day Change: 0.00 | |
| Week Change: 1.27% Year-to-date Change: -9.4% | |
| LNSR Links: Profile News Message Board | |
| Charts:- Daily , Weekly | |
| Add LNSR to Watchlist: View: Get Complete LNSR Trend Analysis ➞ | |
 | KZR Kezar Life Sciences, Inc. |
| Sector: Health Care | |
| SubSector: Biotechnology | |
| MarketCap: 174.885 Millions | |
| Recent Price: 0.80 Smart Investing & Trading Score: 50 | |
| Day Percent Change: -2.98% Day Change: -0.02 | |
| Week Change: 1.77% Year-to-date Change: -15.4% | |
| KZR Links: Profile News Message Board | |
| Charts:- Daily , Weekly | |
| Add KZR to Watchlist: View: Get Complete KZR Trend Analysis ➞ | |
 | URGN UroGen Pharma Ltd. |
| Sector: Health Care | |
| SubSector: Biotechnology | |
| MarketCap: 373.485 Millions | |
| Recent Price: 14.21 Smart Investing & Trading Score: 50 | |
| Day Percent Change: -2.20% Day Change: -0.32 | |
| Week Change: 3.12% Year-to-date Change: -5.3% | |
| URGN Links: Profile News Message Board | |
| Charts:- Daily , Weekly | |
| Add URGN to Watchlist: View: Get Complete URGN Trend Analysis ➞ | |
 | CERE Cerevel Therapeutics Holdings, Inc. |
| Sector: Health Care | |
| SubSector: Biotechnology | |
| MarketCap: 21587 Millions | |
| Recent Price: 41.87 Smart Investing & Trading Score: 50 | |
| Day Percent Change: -0.29% Day Change: -0.12 | |
| Week Change: -0.68% Year-to-date Change: -1.2% | |
| CERE Links: Profile News Message Board | |
| Charts:- Daily , Weekly | |
| Add CERE to Watchlist: View: Get Complete CERE Trend Analysis ➞ | |
 | PRVA Privia Health Group, Inc. |
| Sector: Health Care | |
| SubSector: Health Information Services | |
| MarketCap: 3130 Millions | |
| Recent Price: 18.50 Smart Investing & Trading Score: 50 | |
| Day Percent Change: -1.47% Day Change: -0.27 | |
| Week Change: 2.3% Year-to-date Change: -21.7% | |
| PRVA Links: Profile News Message Board | |
| Charts:- Daily , Weekly | |
| Add PRVA to Watchlist: View: Get Complete PRVA Trend Analysis ➞ | |
 | BIIB Biogen Inc. |
| Sector: Health Care | |
| SubSector: Biotechnology | |
| MarketCap: 53102.6 Millions | |
| Recent Price: 201.99 Smart Investing & Trading Score: 49 | |
| Day Percent Change: 4.56% Day Change: 8.81 | |
| Week Change: 3.92% Year-to-date Change: -21.9% | |
| BIIB Links: Profile News Message Board | |
| Charts:- Daily , Weekly | |
| Add BIIB to Watchlist: View: Get Complete BIIB Trend Analysis ➞ | |
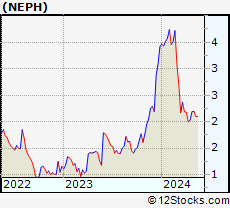 | NEPH Nephros, Inc. |
| Sector: Health Care | |
| SubSector: Medical Instruments & Supplies | |
| MarketCap: 69.486 Millions | |
| Recent Price: 2.19 Smart Investing & Trading Score: 49 | |
| Day Percent Change: 3.79% Day Change: 0.08 | |
| Week Change: 7.88% Year-to-date Change: -36.0% | |
| NEPH Links: Profile News Message Board | |
| Charts:- Daily , Weekly | |
| Add NEPH to Watchlist: View: Get Complete NEPH Trend Analysis ➞ | |
 | BGNE BeiGene, Ltd. |
| Sector: Health Care | |
| SubSector: Biotechnology | |
| MarketCap: 10838.5 Millions | |
| Recent Price: 144.12 Smart Investing & Trading Score: 49 | |
| Day Percent Change: 3.69% Day Change: 5.13 | |
| Week Change: 11.27% Year-to-date Change: -20.1% | |
| BGNE Links: Profile News Message Board | |
| Charts:- Daily , Weekly | |
| Add BGNE to Watchlist: View: Get Complete BGNE Trend Analysis ➞ | |
 | OFIX Orthofix Medical Inc. |
| Sector: Health Care | |
| SubSector: Medical Appliances & Equipment | |
| MarketCap: 508.18 Millions | |
| Recent Price: 13.56 Smart Investing & Trading Score: 49 | |
| Day Percent Change: 2.57% Day Change: 0.34 | |
| Week Change: 3.51% Year-to-date Change: 0.6% | |
| OFIX Links: Profile News Message Board | |
| Charts:- Daily , Weekly | |
| Add OFIX to Watchlist: View: Get Complete OFIX Trend Analysis ➞ | |
 | ALKS Alkermes plc |
| Sector: Health Care | |
| SubSector: Biotechnology | |
| MarketCap: 2311.95 Millions | |
| Recent Price: 24.65 Smart Investing & Trading Score: 49 | |
| Day Percent Change: 1.61% Day Change: 0.39 | |
| Week Change: 3.35% Year-to-date Change: -11.1% | |
| ALKS Links: Profile News Message Board | |
| Charts:- Daily , Weekly | |
| Add ALKS to Watchlist: View: Get Complete ALKS Trend Analysis ➞ | |
 | IONS Ionis Pharmaceuticals, Inc. |
| Sector: Health Care | |
| SubSector: Biotechnology | |
| MarketCap: 6725.05 Millions | |
| Recent Price: 42.45 Smart Investing & Trading Score: 49 | |
| Day Percent Change: 1.46% Day Change: 0.61 | |
| Week Change: 4.35% Year-to-date Change: -16.1% | |
| IONS Links: Profile News Message Board | |
| Charts:- Daily , Weekly | |
| Add IONS to Watchlist: View: Get Complete IONS Trend Analysis ➞ | |
 | NUVL Nuvalent, Inc. |
| Sector: Health Care | |
| SubSector: Biotechnology | |
| MarketCap: 2400 Millions | |
| Recent Price: 68.18 Smart Investing & Trading Score: 49 | |
| Day Percent Change: 0.92% Day Change: 0.62 | |
| Week Change: 8.64% Year-to-date Change: -7.2% | |
| NUVL Links: Profile News Message Board | |
| Charts:- Daily , Weekly | |
| Add NUVL to Watchlist: View: Get Complete NUVL Trend Analysis ➞ | |
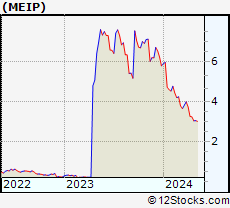 | MEIP MEI Pharma, Inc. |
| Sector: Health Care | |
| SubSector: Biotechnology | |
| MarketCap: 145.185 Millions | |
| Recent Price: 3.26 Smart Investing & Trading Score: 49 | |
| Day Percent Change: -2.16% Day Change: -0.07 | |
| Week Change: 0.31% Year-to-date Change: -43.8% | |
| MEIP Links: Profile News Message Board | |
| Charts:- Daily , Weekly | |
| Add MEIP to Watchlist: View: Get Complete MEIP Trend Analysis ➞ | |
 | SLNO Soleno Therapeutics, Inc. |
| Sector: Health Care | |
| SubSector: Medical Laboratories & Research | |
| MarketCap: 94 Millions | |
| Recent Price: 39.34 Smart Investing & Trading Score: 49 | |
| Day Percent Change: -1.99% Day Change: -0.80 | |
| Week Change: 4.82% Year-to-date Change: -2.3% | |
| SLNO Links: Profile News Message Board | |
| Charts:- Daily , Weekly | |
| Add SLNO to Watchlist: View: Get Complete SLNO Trend Analysis ➞ | |
 | MD MEDNAX, Inc. |
| Sector: Health Care | |
| SubSector: Specialized Health Services | |
| MarketCap: 913.656 Millions | |
| Recent Price: 9.24 Smart Investing & Trading Score: 49 | |
| Day Percent Change: -1.70% Day Change: -0.16 | |
| Week Change: 2.33% Year-to-date Change: -0.7% | |
| MD Links: Profile News Message Board | |
| Charts:- Daily , Weekly | |
| Add MD to Watchlist: View: Get Complete MD Trend Analysis ➞ | |
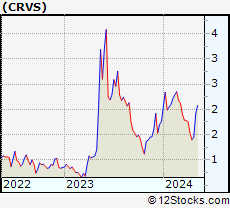 | CRVS Corvus Pharmaceuticals, Inc. |
| Sector: Health Care | |
| SubSector: Biotechnology | |
| MarketCap: 73.7785 Millions | |
| Recent Price: 1.51 Smart Investing & Trading Score: 49 | |
| Day Percent Change: -1.31% Day Change: -0.02 | |
| Week Change: 7.86% Year-to-date Change: -14.2% | |
| CRVS Links: Profile News Message Board | |
| Charts:- Daily , Weekly | |
| Add CRVS to Watchlist: View: Get Complete CRVS Trend Analysis ➞ | |
 | SHC Sotera Health Company |
| Sector: Health Care | |
| SubSector: Diagnostics & Research | |
| MarketCap: 71087 Millions | |
| Recent Price: 11.26 Smart Investing & Trading Score: 49 | |
| Day Percent Change: -1.05% Day Change: -0.12 | |
| Week Change: 4.36% Year-to-date Change: -33.2% | |
| SHC Links: Profile News Message Board | |
| Charts:- Daily , Weekly | |
| Add SHC to Watchlist: View: Get Complete SHC Trend Analysis ➞ | |
| For tabular summary view of above stock list: Summary View ➞ 0 - 25 , 25 - 50 , 50 - 75 , 75 - 100 , 100 - 125 , 125 - 150 , 150 - 175 , 175 - 200 , 200 - 225 , 225 - 250 , 250 - 275 , 275 - 300 , 300 - 325 , 325 - 350 , 350 - 375 , 375 - 400 , 400 - 425 , 425 - 450 , 450 - 475 , 475 - 500 , 500 - 525 , 525 - 550 , 550 - 575 , 575 - 600 , 600 - 625 , 625 - 650 , 650 - 675 , 675 - 700 , 700 - 725 | ||
| Click To Change The Sort Order: By Market Cap or Company Size Performance: Year-to-date, Week and Day | |
| Select Chart Type: | ||
|
Best Stocks Today 12Stocks.com |
© 2024 12Stocks.com Terms & Conditions Privacy Contact Us
All Information Provided Only For Education And Not To Be Used For Investing or Trading. See Terms & Conditions


One More Thing ... Get Best Stocks Delivered Daily!
Never Ever Miss A Move With Our Top Ten Stocks Lists
Find Best Stocks In Any Market - Bull or Bear Market
Take A Peek At Our Top Ten Stocks Lists: Daily, Weekly, Year-to-Date & Top Trends
Find Best Stocks In Any Market - Bull or Bear Market
Take A Peek At Our Top Ten Stocks Lists: Daily, Weekly, Year-to-Date & Top Trends
Healthcare Stocks With Best Up Trends [0-bearish to 100-bullish]: Annovis Bio[100], Boston Scientific[100], Integer [100], Haemonetics [100], Quest Diagnostics[100], AstraZeneca [100], Oscar Health[100], PureTech Health[100], Glaukos [100], Agios [100], Pieris [100]
Best Healthcare Stocks Year-to-Date:
Pieris [6427.47%], Precision BioSciences[2590.41%], Inovio [1892.16%], Assembly Biosciences[1543.7%], Aurora Cannabis[1411.97%], Adverum Biotechnologies[1253.61%], NuCana [1198.17%], Agenus [796.24%], Affimed N.V[680.8%], CareMax [574.23%], Corbus [488.41%] Best Healthcare Stocks This Week:
Pieris [8093.1%], Aesthetic [53.58%], Agenus [39.74%], BeyondSpring [35%], Seres [30.29%], VolitionRx [29.87%], Annovis Bio[27.4%], CareMax [27.24%], ProKidney [23.28%], GeneDx [22.61%], Cullinan Oncology[20.69%] Best Healthcare Stocks Daily:
Aesthetic [44.75%], Agenus [14.86%], Apyx [13.64%], Cullinan Oncology[13.55%], Amneal [12.04%], HOOKIPA Pharma[11.11%], Gritstone Oncology[10.06%], DURECT [9.75%], Sage [8.11%], Relay [7.46%], Annovis Bio[7.24%]