
 Login Sign Up


| |||||
 |  | ||||

| 12Stocks.com Market Intelligence |
Best Healthcare Stocks
 | "Discover best trending healthcare stocks with 12Stocks.com." |
| - Subu Vdaygiri, Founder, 12Stocks.com |
| In a hurry? Healthcare Stocks Lists: Performance Trends Table, Stock Charts
Sort Healthcare stocks: Daily, Weekly, Year-to-Date, Market Cap & Trends. Filter Healthcare stocks list by size:All Healthcare Large Mid-Range Small |
| 12Stocks.com Healthcare Stocks Performances & Trends Daily | |||||||||
|
|  The overall Smart Investing & Trading Score is 100 (0-bearish to 100-bullish) which puts Healthcare sector in short term bullish trend. The Smart Investing & Trading Score from previous trading session is 70 and an improvement of trend continues.
| ||||||||
Here are the Smart Investing & Trading Scores of the most requested Healthcare stocks at 12Stocks.com (click stock name for detailed review):
|


| 12Stocks.com: Investing in Healthcare sector with Stocks | |
|
The following table helps investors and traders sort through current performance and trends (as measured by Smart Investing & Trading Score) of various
stocks in the Healthcare sector. Quick View: Move mouse or cursor over stock symbol (ticker) to view short-term Technical chart and over stock name to view long term chart. Click on  to add stock symbol to your watchlist and to add stock symbol to your watchlist and  to view watchlist. Click on any ticker or stock name for detailed market intelligence report for that stock. to view watchlist. Click on any ticker or stock name for detailed market intelligence report for that stock. |
12Stocks.com Performance of Stocks in Healthcare Sector
| Ticker | Stock Name | Watchlist | Category | Recent Price | Smart Investing & Trading Score | Change % | YTD Change% |
| NEO | Neogenomics |   | Diagnostics & Research | 8.98 | 100 | 3.04% | -45.54% |
| CNC | Centene Corp | | Healthcare Plans | 36.82 | 100 | 3.02% | -39.15% |
| ACHV | Achieve Life | | Biotechnology | 3.19 | 100 | 2.90% | -13.55% |
| CRL | Charles River | | Diagnostics & Research | 175.36 | 100 | 2.86% | -3.99% |
| ACOR | Acorda | | Biotechnology | 35.34 | 100 | 2.79% | 0.00% |
| IMVT | Immunovant | | Biotechnology | 16.74 | 100 | 2.45% | -33.55% |
| BCYC | Bicycle | | Biotechnology | 8.53 | 100 | 2.40% | -40.60% |
| GLPG | Galapagos NV | | Biotechnology | 35.86 | 100 | 2.34% | 28.55% |
| QDEL | QuidelOrtho | | Medical Devices | 31.95 | 100 | 2.24% | -29.06% |
| XGN | Exagen | | Diagnostics & Research | 10.99 | 100 | 2.04% | 255.66% |
| CERT | Certara | | Health Information | 13.64 | 100 | 2.02% | 27.96% |
| ALKS | Alkermes | | Drug Manufacturers - Specialty & Generic | 31.27 | 100 | 2.01% | 8.75% |
| FULC | Fulcrum | | Biotechnology | 9.51 | 100 | 1.93% | 96.49% |
| GNMX | Aevi Genomic | | Biotechnology | 79.46 | 100 | 1.81% | 0.00% |
| TRVI | Trevi | | Biotechnology | 9.56 | 100 | 1.70% | 119.27% |
| PTCT | PTC | | Biotechnology | 63.05 | 100 | 1.68% | 37.42% |
| EPZM | Epizyme | | Biotechnology | 85.84 | 100 | 1.63% | 0.00% |
| ARVN | Arvinas | | Biotechnology | 9.28 | 100 | 1.59% | -50.90% |
| UNH | Unitedhealth | | Healthcare Plans | 353.72 | 100 | 1.56% | -29.09% |
| ALT | Altimmune | | Biotechnology | 3.93 | 100 | 1.55% | -44.73% |
| ROIV | Roivant Sciences | | Biotechnology | 15.98 | 100 | 1.46% | 32.28% |
| USPH | U.S. Physical | | Medical Care Facilities | 87.20 | 100 | 1.40% | 0.41% |
| VNDA | Vanda | | Biotechnology | 5.17 | 100 | 1.37% | 7.26% |
| UTHR | United | | Drug Manufacturers - Specialty & Generic | 443.70 | 100 | 1.26% | 23.17% |
| INMD | Inmode | | Medical Devices | 15.46 | 100 | 1.18% | -8.84% |
| For chart view version of above stock list: Chart View ➞ 0 - 25 , 25 - 50 , 50 - 75 , 75 - 100 , 100 - 125 , 125 - 150 , 150 - 175 , 175 - 200 , 200 - 225 , 225 - 250 , 250 - 275 , 275 - 300 , 300 - 325 , 325 - 350 , 350 - 375 , 375 - 400 , 400 - 425 , 425 - 450 , 450 - 475 , 475 - 500 , 500 - 525 , 525 - 550 , 550 - 575 , 575 - 600 , 600 - 625 , 625 - 650 , 650 - 675 , 675 - 700 , 700 - 725 , 725 - 750 , 750 - 775 , 775 - 800 , 800 - 825 , 825 - 850 , 850 - 875 , 875 - 900 , 900 - 925 , 925 - 950 , 950 - 975 , 975 - 1000 | ||
 | Click To Change The Sort Order: By Market Cap or Company Size Performance: Year-to-date, Week and Day |  |
|
Get the most comprehensive stock market coverage daily at 12Stocks.com ➞ Best Stocks Today ➞ Best Stocks Weekly ➞ Best Stocks Year-to-Date ➞ Best Stocks Trends ➞  Best Stocks Today 12Stocks.com Best Nasdaq Stocks ➞ Best S&P 500 Stocks ➞ Best Tech Stocks ➞ Best Biotech Stocks ➞ |
| Detailed Overview of Healthcare Stocks |
| Healthcare Technical Overview, Leaders & Laggards, Top Healthcare ETF Funds & Detailed Healthcare Stocks List, Charts, Trends & More |
| Healthcare Sector: Technical Analysis, Trends & YTD Performance | |
| Healthcare sector is composed of stocks
from pharmaceutical, biotech, diagnostics labs, insurance providers
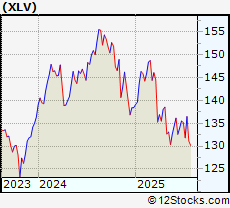
and healthcare services. Healthcare sector, as represented by XLV, an exchange-traded fund [ETF] that holds basket of Healthcare stocks (e.g, Merck, Amgen) is up by 4.95646% and is currently underperforming the overall market by -9.80144% year-to-date. Below is a quick view of Technical charts and trends: |
|
 XLV Weekly Chart |
|
| Long Term Trend: Very Good | |
| Medium Term Trend: Very Good | |
 XLV Daily Chart |
|
| Short Term Trend: Very Good | |
| Overall Trend Score: 100 | |
| YTD Performance: 4.95646% | |
| **Trend Scores & Views Are Only For Educational Purposes And Not For Investing | |
| 12Stocks.com: Top Performing Healthcare Sector Stocks | ||||||||||||||||||||||||||||||||||||||||||||||
 The top performing Healthcare sector stocks year to date are
Now, more recently, over last week, the top performing Healthcare sector stocks on the move are


|
||||||||||||||||||||||||||||||||||||||||||||||
| 12Stocks.com: Investing in Healthcare Sector using Exchange Traded Funds | |
|
The following table shows list of key exchange traded funds (ETF) that
help investors track Healthcare Index. For detailed view, check out our ETF Funds section of our website. Quick View: Move mouse or cursor over ETF symbol (ticker) to view short-term Technical chart and over ETF name to view long term chart. Click on ticker or stock name for detailed view. Click on to add stock symbol to your watchlist and to view watchlist. |
12Stocks.com List of ETFs that track Healthcare Index
| Ticker | ETF Name | Watchlist | Recent Price | Smart Investing & Trading Score | Change % | Week % | Year-to-date % |
| BTEC | Principal Healthcare Innovators | | 39.49 | 30 | 0 | 1.02328 | 0% |
| 12Stocks.com: Charts, Trends, Fundamental Data and Performances of Healthcare Stocks | |
|
We now take in-depth look at all Healthcare stocks including charts, multi-period performances and overall trends (as measured by Smart Investing & Trading Score). One can sort Healthcare stocks (click link to choose) by Daily, Weekly and by Year-to-Date performances. Also, one can sort by size of the company or by market capitalization. |
| Select Your Default Chart Type: | |||||
| |||||
| Click on stock symbol or name for detailed view. Click on to add stock symbol to your watchlist and to view watchlist. Quick View: Move mouse or cursor over "Daily" to quickly view daily Technical stock chart and over "Weekly" to view weekly Technical stock chart. | |||||

 | NEO Neogenomics Inc |
| Sector: Health Care | |
| SubSector: Diagnostics & Research | |
| MarketCap: 1030.85 Millions | |
| Recent Price: 8.98 Smart Investing & Trading Score: 100 | |
| Day Percent Change: 3.04073% Day Change: 0.08 | |
| Week Change: 14.1042% Year-to-date Change: -45.5% | |
| NEO Links: Profile News Message Board | |
| Charts:- Daily , Weekly | |
| Add NEO to Watchlist: View: Get Complete NEO Trend Analysis ➞ | |
 | CNC Centene Corp |
| Sector: Health Care | |
| SubSector: Healthcare Plans | |
| MarketCap: 14233 Millions | |
| Recent Price: 36.82 Smart Investing & Trading Score: 100 | |
| Day Percent Change: 3.02182% Day Change: 1.18 | |
| Week Change: 6.26263% Year-to-date Change: -39.2% | |
| CNC Links: Profile News Message Board | |
| Charts:- Daily , Weekly | |
| Add CNC to Watchlist: View: Get Complete CNC Trend Analysis ➞ | |
 | ACHV Achieve Life Sciences Inc |
| Sector: Health Care | |
| SubSector: Biotechnology | |
| MarketCap: 144.63 Millions | |
| Recent Price: 3.19 Smart Investing & Trading Score: 100 | |
| Day Percent Change: 2.90323% Day Change: 0.31 | |
| Week Change: 3.57143% Year-to-date Change: -13.6% | |
| ACHV Links: Profile News Message Board | |
| Charts:- Daily , Weekly | |
| Add ACHV to Watchlist: View: Get Complete ACHV Trend Analysis ➞ | |
 | CRL Charles River Laboratories International Inc |
| Sector: Health Care | |
| SubSector: Diagnostics & Research | |
| MarketCap: 8070.63 Millions | |
| Recent Price: 175.36 Smart Investing & Trading Score: 100 | |
| Day Percent Change: 2.86251% Day Change: 6.32 | |
| Week Change: 17.3369% Year-to-date Change: -4.0% | |
| CRL Links: Profile News Message Board | |
| Charts:- Daily , Weekly | |
| Add CRL to Watchlist: View: Get Complete CRL Trend Analysis ➞ | |
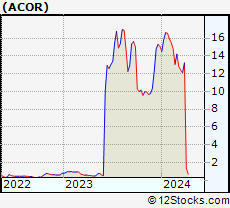 | ACOR Acorda Therapeutics, Inc. |
| Sector: Health Care | |
| SubSector: Biotechnology | |
| MarketCap: 55.5785 Millions | |
| Recent Price: 35.34 Smart Investing & Trading Score: 100 | |
| Day Percent Change: 2.79232% Day Change: -9999 | |
| Week Change: 3364.71% Year-to-date Change: 0.0% | |
| ACOR Links: Profile News Message Board | |
| Charts:- Daily , Weekly | |
| Add ACOR to Watchlist: View: Get Complete ACOR Trend Analysis ➞ | |
 | IMVT Immunovant Inc |
| Sector: Health Care | |
| SubSector: Biotechnology | |
| MarketCap: 2987.79 Millions | |
| Recent Price: 16.74 Smart Investing & Trading Score: 100 | |
| Day Percent Change: 2.44798% Day Change: 0.02 | |
| Week Change: 8.27943% Year-to-date Change: -33.5% | |
| IMVT Links: Profile News Message Board | |
| Charts:- Daily , Weekly | |
| Add IMVT to Watchlist: View: Get Complete IMVT Trend Analysis ➞ | |
 | BCYC Bicycle Therapeutics Plc ADR |
| Sector: Health Care | |
| SubSector: Biotechnology | |
| MarketCap: 495.83 Millions | |
| Recent Price: 8.53 Smart Investing & Trading Score: 100 | |
| Day Percent Change: 2.40096% Day Change: 0.06 | |
| Week Change: 20.3103% Year-to-date Change: -40.6% | |
| BCYC Links: Profile News Message Board | |
| Charts:- Daily , Weekly | |
| Add BCYC to Watchlist: View: Get Complete BCYC Trend Analysis ➞ | |
 | GLPG Galapagos NV ADR |
| Sector: Health Care | |
| SubSector: Biotechnology | |
| MarketCap: 2198.42 Millions | |
| Recent Price: 35.86 Smart Investing & Trading Score: 100 | |
| Day Percent Change: 2.34018% Day Change: 0.16 | |
| Week Change: 8.53511% Year-to-date Change: 28.6% | |
| GLPG Links: Profile News Message Board | |
| Charts:- Daily , Weekly | |
| Add GLPG to Watchlist: View: Get Complete GLPG Trend Analysis ➞ | |
 | QDEL QuidelOrtho Corporation |
| Sector: Health Care | |
| SubSector: Medical Devices | |
| MarketCap: 1947.39 Millions | |
| Recent Price: 31.95 Smart Investing & Trading Score: 100 | |
| Day Percent Change: 2.24% Day Change: 0.86 | |
| Week Change: 19.7078% Year-to-date Change: -29.1% | |
| QDEL Links: Profile News Message Board | |
| Charts:- Daily , Weekly | |
| Add QDEL to Watchlist: View: Get Complete QDEL Trend Analysis ➞ | |
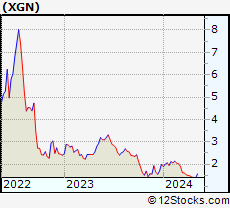 | XGN Exagen Inc |
| Sector: Health Care | |
| SubSector: Diagnostics & Research | |
| MarketCap: 212.78 Millions | |
| Recent Price: 10.99 Smart Investing & Trading Score: 100 | |
| Day Percent Change: 2.04271% Day Change: 0.14 | |
| Week Change: 11.5736% Year-to-date Change: 255.7% | |
| XGN Links: Profile News Message Board | |
| Charts:- Daily , Weekly | |
| Add XGN to Watchlist: View: Get Complete XGN Trend Analysis ➞ | |
 | CERT Certara Inc |
| Sector: Health Care | |
| SubSector: Health Information Services | |
| MarketCap: 1689.76 Millions | |
| Recent Price: 13.64 Smart Investing & Trading Score: 100 | |
| Day Percent Change: 2.01945% Day Change: 0.04 | |
| Week Change: 19.0227% Year-to-date Change: 28.0% | |
| CERT Links: Profile News Message Board | |
| Charts:- Daily , Weekly | |
| Add CERT to Watchlist: View: Get Complete CERT Trend Analysis ➞ | |
 | ALKS Alkermes plc |
| Sector: Health Care | |
| SubSector: Drug Manufacturers - Specialty & Generic | |
| MarketCap: 4942.44 Millions | |
| Recent Price: 31.27 Smart Investing & Trading Score: 100 | |
| Day Percent Change: 2.00653% Day Change: 0.29 | |
| Week Change: 12.4236% Year-to-date Change: 8.7% | |
| ALKS Links: Profile News Message Board | |
| Charts:- Daily , Weekly | |
| Add ALKS to Watchlist: View: Get Complete ALKS Trend Analysis ➞ | |
 | FULC Fulcrum Therapeutics Inc |
| Sector: Health Care | |
| SubSector: Biotechnology | |
| MarketCap: 414.34 Millions | |
| Recent Price: 9.51 Smart Investing & Trading Score: 100 | |
| Day Percent Change: 1.92926% Day Change: -0.05 | |
| Week Change: 15.2727% Year-to-date Change: 96.5% | |
| FULC Links: Profile News Message Board | |
| Charts:- Daily , Weekly | |
| Add FULC to Watchlist: View: Get Complete FULC Trend Analysis ➞ | |
 | GNMX Aevi Genomic Medicine, Inc. |
| Sector: Health Care | |
| SubSector: Biotechnology | |
| MarketCap: 189.1 Millions | |
| Recent Price: 79.46 Smart Investing & Trading Score: 100 | |
| Day Percent Change: 1.80653% Day Change: -9999 | |
| Week Change: 291.621% Year-to-date Change: 0.0% | |
| GNMX Links: Profile News Message Board | |
| Charts:- Daily , Weekly | |
| Add GNMX to Watchlist: View: Get Complete GNMX Trend Analysis ➞ | |
 | TRVI Trevi Therapeutics Inc |
| Sector: Health Care | |
| SubSector: Biotechnology | |
| MarketCap: 853.66 Millions | |
| Recent Price: 9.56 Smart Investing & Trading Score: 100 | |
| Day Percent Change: 1.70213% Day Change: 0.07 | |
| Week Change: 12.8689% Year-to-date Change: 119.3% | |
| TRVI Links: Profile News Message Board | |
| Charts:- Daily , Weekly | |
| Add TRVI to Watchlist: View: Get Complete TRVI Trend Analysis ➞ | |
 | PTCT PTC Therapeutics Inc |
| Sector: Health Care | |
| SubSector: Biotechnology | |
| MarketCap: 4548.63 Millions | |
| Recent Price: 63.05 Smart Investing & Trading Score: 100 | |
| Day Percent Change: 1.67715% Day Change: 0.07 | |
| Week Change: 5.96639% Year-to-date Change: 37.4% | |
| PTCT Links: Profile News Message Board | |
| Charts:- Daily , Weekly | |
| Add PTCT to Watchlist: View: Get Complete PTCT Trend Analysis ➞ | |
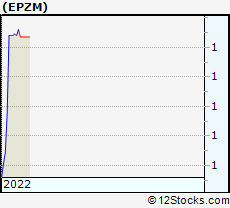 | EPZM Epizyme, Inc. |
| Sector: Health Care | |
| SubSector: Biotechnology | |
| MarketCap: 1739.35 Millions | |
| Recent Price: 85.84 Smart Investing & Trading Score: 100 | |
| Day Percent Change: 1.63391% Day Change: -9999 | |
| Week Change: 5739.46% Year-to-date Change: 0.0% | |
| EPZM Links: Profile News Message Board | |
| Charts:- Daily , Weekly | |
| Add EPZM to Watchlist: View: Get Complete EPZM Trend Analysis ➞ | |
 | ARVN Arvinas Inc |
| Sector: Health Care | |
| SubSector: Biotechnology | |
| MarketCap: 574.86 Millions | |
| Recent Price: 9.28 Smart Investing & Trading Score: 100 | |
| Day Percent Change: 1.58817% Day Change: 0.2 | |
| Week Change: 19.9871% Year-to-date Change: -50.9% | |
| ARVN Links: Profile News Message Board | |
| Charts:- Daily , Weekly | |
| Add ARVN to Watchlist: View: Get Complete ARVN Trend Analysis ➞ | |
 | UNH Unitedhealth Group Inc |
| Sector: Health Care | |
| SubSector: Healthcare Plans | |
| MarketCap: 285640 Millions | |
| Recent Price: 353.72 Smart Investing & Trading Score: 100 | |
| Day Percent Change: 1.55613% Day Change: 5.44 | |
| Week Change: 0.542907% Year-to-date Change: -29.1% | |
| UNH Links: Profile News Message Board | |
| Charts:- Daily , Weekly | |
| Add UNH to Watchlist: View: Get Complete UNH Trend Analysis ➞ | |
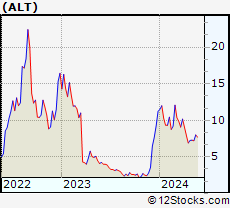 | ALT Altimmune Inc |
| Sector: Health Care | |
| SubSector: Biotechnology | |
| MarketCap: 333.61 Millions | |
| Recent Price: 3.93 Smart Investing & Trading Score: 100 | |
| Day Percent Change: 1.55039% Day Change: -0.1 | |
| Week Change: 0.255102% Year-to-date Change: -44.7% | |
| ALT Links: Profile News Message Board | |
| Charts:- Daily , Weekly | |
| Add ALT to Watchlist: View: Get Complete ALT Trend Analysis ➞ | |
 | ROIV Roivant Sciences Ltd |
| Sector: Health Care | |
| SubSector: Biotechnology | |
| MarketCap: 8822.83 Millions | |
| Recent Price: 15.98 Smart Investing & Trading Score: 100 | |
| Day Percent Change: 1.46032% Day Change: 0.18 | |
| Week Change: 8.70748% Year-to-date Change: 32.3% | |
| ROIV Links: Profile News Message Board | |
| Charts:- Daily , Weekly | |
| Add ROIV to Watchlist: View: Get Complete ROIV Trend Analysis ➞ | |
 | USPH U.S. Physical Therapy, Inc |
| Sector: Health Care | |
| SubSector: Medical Care Facilities | |
| MarketCap: 1302.08 Millions | |
| Recent Price: 87.20 Smart Investing & Trading Score: 100 | |
| Day Percent Change: 1.39535% Day Change: 0.36 | |
| Week Change: 6.48431% Year-to-date Change: 0.4% | |
| USPH Links: Profile News Message Board | |
| Charts:- Daily , Weekly | |
| Add USPH to Watchlist: View: Get Complete USPH Trend Analysis ➞ | |
 | VNDA Vanda Pharmaceuticals Inc |
| Sector: Health Care | |
| SubSector: Biotechnology | |
| MarketCap: 272.4 Millions | |
| Recent Price: 5.17 Smart Investing & Trading Score: 100 | |
| Day Percent Change: 1.37255% Day Change: -0.09 | |
| Week Change: 5.5102% Year-to-date Change: 7.3% | |
| VNDA Links: Profile News Message Board | |
| Charts:- Daily , Weekly | |
| Add VNDA to Watchlist: View: Get Complete VNDA Trend Analysis ➞ | |
 | UTHR United Therapeutics Corp |
| Sector: Health Care | |
| SubSector: Drug Manufacturers - Specialty & Generic | |
| MarketCap: 18114 Millions | |
| Recent Price: 443.70 Smart Investing & Trading Score: 100 | |
| Day Percent Change: 1.25976% Day Change: 3.43 | |
| Week Change: 1.12821% Year-to-date Change: 23.2% | |
| UTHR Links: Profile News Message Board | |
| Charts:- Daily , Weekly | |
| Add UTHR to Watchlist: View: Get Complete UTHR Trend Analysis ➞ | |
 | INMD Inmode Ltd |
| Sector: Health Care | |
| SubSector: Medical Devices | |
| MarketCap: 1041.99 Millions | |
| Recent Price: 15.46 Smart Investing & Trading Score: 100 | |
| Day Percent Change: 1.17801% Day Change: 0.02 | |
| Week Change: 3.41137% Year-to-date Change: -8.8% | |
| INMD Links: Profile News Message Board | |
| Charts:- Daily , Weekly | |
| Add INMD to Watchlist: View: Get Complete INMD Trend Analysis ➞ | |
| For tabular summary view of above stock list: Summary View ➞ 0 - 25 , 25 - 50 , 50 - 75 , 75 - 100 , 100 - 125 , 125 - 150 , 150 - 175 , 175 - 200 , 200 - 225 , 225 - 250 , 250 - 275 , 275 - 300 , 300 - 325 , 325 - 350 , 350 - 375 , 375 - 400 , 400 - 425 , 425 - 450 , 450 - 475 , 475 - 500 , 500 - 525 , 525 - 550 , 550 - 575 , 575 - 600 , 600 - 625 , 625 - 650 , 650 - 675 , 675 - 700 , 700 - 725 , 725 - 750 , 750 - 775 , 775 - 800 , 800 - 825 , 825 - 850 , 850 - 875 , 875 - 900 , 900 - 925 , 925 - 950 , 950 - 975 , 975 - 1000 | ||
| Click To Change The Sort Order: By Market Cap or Company Size Performance: Year-to-date, Week and Day | |
| Select Chart Type: | ||
|
Best Stocks Today 12Stocks.com |
© 2025 12Stocks.com Terms & Conditions Privacy Contact Us
All Information Provided Only For Education And Not To Be Used For Investing or Trading. See Terms & Conditions


One More Thing ... Get Best Stocks Delivered Daily!
Never Ever Miss A Move With Our Top Ten Stocks Lists
Find Best Stocks In Any Market - Bull or Bear Market
Take A Peek At Our Top Ten Stocks Lists: Daily, Weekly, Year-to-Date & Top Trends
Find Best Stocks In Any Market - Bull or Bear Market
Take A Peek At Our Top Ten Stocks Lists: Daily, Weekly, Year-to-Date & Top Trends
Healthcare Stocks With Best Up Trends [0-bearish to 100-bullish]: Taysha Gene[100], DBV Technologies[100], Valneva SE[100], ClearPoint Neuro[100], Prime Medicine[100], AlloVir [100], Sarepta [100], Monopar [100], Cara [100], Absci Corp[100], Spruce Biosciences[100]
Best Healthcare Stocks Year-to-Date:
Regencell Bioscience[12636.6%], Kaleido BioSciences[9900%], Vor Biopharma[3175%], Nanobiotix ADR[581.379%], Eagle [542.857%], So-Young [395.711%], I-Mab ADR[357.506%], Monopar [337.489%], Nektar [319.84%], 908 Devices[299.543%], DBV Technologies[276.923%] Best Healthcare Stocks This Week:
Athersys [193287%], Nobilis Health[101349%], VBI Vaccines[86898.5%], ContraFect [47677.8%], Clovis Oncology[39610.5%], Endo [28369.6%], NanoString Technologies[17224.7%], Neptune Wellness[14100%], ViewRay [11470.2%], Mallkrodt [11382.1%], Achillion [10033.3%] Best Healthcare Stocks Daily:
Kaleido BioSciences[9900%], Neoleukin [332.665%], Syros [226.23%], Athenex [103.333%], Taysha Gene[53.4591%], DBV Technologies[21.6485%], Valneva SE[20.197%], ClearPoint Neuro[19.7991%], Prime Medicine[19.4097%], Accelerate Diagnostics[17.6471%], Aptose Biosciences[17.5439%]