
 Login Sign Up


| |||||
 |  | ||||

| 12Stocks.com Market Intelligence |
Best Healthcare Stocks
 | "Discover best trending healthcare stocks with 12Stocks.com." |
| - Subu Vdaygiri, Founder, 12Stocks.com |
| In a hurry? Healthcare Stocks Lists: Performance Trends Table, Stock Charts
Sort Healthcare stocks: Daily, Weekly, Year-to-Date, Market Cap & Trends. Filter Healthcare stocks list by size:All Healthcare Large Mid-Range Small |
| 12Stocks.com Healthcare Stocks Performances & Trends Daily | |||||||||
|
|  The overall Smart Investing & Trading Score is 100 (0-bearish to 100-bullish) which puts Healthcare sector in short term bullish trend. The Smart Investing & Trading Score from previous trading session is 70 and an improvement of trend continues.
| ||||||||
Here are the Smart Investing & Trading Scores of the most requested Healthcare stocks at 12Stocks.com (click stock name for detailed review):
|


| 12Stocks.com: Investing in Healthcare sector with Stocks | |
|
The following table helps investors and traders sort through current performance and trends (as measured by Smart Investing & Trading Score) of various
stocks in the Healthcare sector. Quick View: Move mouse or cursor over stock symbol (ticker) to view short-term Technical chart and over stock name to view long term chart. Click on  to add stock symbol to your watchlist and to add stock symbol to your watchlist and  to view watchlist. Click on any ticker or stock name for detailed market intelligence report for that stock. to view watchlist. Click on any ticker or stock name for detailed market intelligence report for that stock. |
12Stocks.com Performance of Stocks in Healthcare Sector
| Ticker | Stock Name | Watchlist | Category | Recent Price | Smart Investing & Trading Score | Change % | YTD Change% |
| LLY | Lilly(Eli) & Co |   | Drug Manufacturers - General | 819.85 | 100 | -0.67% | 5.77% |
| JNJ | Johnson & Johnson | | Drug Manufacturers - General | 185.98 | 100 | -0.04% | 31.28% |
| ABBV | Abbvie | | Drug Manufacturers - General | 236.56 | 100 | -3.20% | 35.47% |
| UNH | Unitedhealth | | Healthcare Plans | 353.72 | 100 | 1.56% | -29.09% |
| AZN | Astrazeneca | | Drug Manufacturers - General | 83.66 | 100 | -0.83% | 29.65% |
| NVS | Novartis AG | | Drug Manufacturers - General | 130.97 | 100 | -0.57% | 39.68% |
| ABT | Abbott | | Medical Devices | 132.99 | 20 | -0.36% | 18.93% |
| MRK | Merck & Co | | Drug Manufacturers - General | 89.51 | 100 | -0.69% | -8.05% |
| TMO | Thermo Fisher | | Diagnostics & Research | 524.96 | 100 | -1.09% | 0.65% |
| NVO | Novo Nordisk | | Drug Manufacturers - General | 58.74 | 90 | -0.73% | -31.80% |
| ISRG | Intuitive Surgical | | Instruments | 443.01 | 30 | 1.13% | -15.46% |
| BSX | Boston Scientific | | Medical Devices | 96.22 | 10 | 0.39% | 7.65% |
| AMGN | AMGEN | | Drug Manufacturers - General | 297.40 | 100 | -0.37% | 16.65% |
| SYK | Stryker Corp | | Medical Devices | 366.40 | 10 | 0.62% | 2.60% |
| DHR | Danaher Corp | | Diagnostics & Research | 210.33 | 100 | -1.20% | -8.19% |
| GILD | Gilead Sciences | | Drug Manufacturers - General | 110.56 | 0 | -0.53% | 22.04% |
| PFE | Pfizer | | Drug Manufacturers - General | 27.08 | 100 | -0.48% | 7.24% |
| MDT | Medtronic | | Medical Devices | 95.48 | 60 | 0.71% | 20.96% |
| SNY | Sanofi ADR | | Drug Manufacturers - General | 50.15 | 90 | 0.78% | 8.68% |
| VRTX | Vertex | | Biotechnology | 408.85 | 80 | 1.15% | 0.76% |
| CELG | Celgene | | Biotechnology | 55.13 | 20 | 1.30% | 0.00% |
| HCA | HCA | | Medical Care Facilities | 426.69 | 100 | 0.15% | 43.91% |
| BMY | Bristol-Myers | | Drug Manufacturers - General | 45.73 | 80 | -3.58% | -16.62% |
| CVS | CVS Health | | Healthcare Plans | 77.45 | 100 | 0.75% | 81.16% |
| MCK | Mckesson | | Medical Distribution | 758.70 | 50 | -0.83% | 34.28% |
| For chart view version of above stock list: Chart View ➞ 0 - 25 , 25 - 50 , 50 - 75 , 75 - 100 , 100 - 125 , 125 - 150 | ||
 | Click To Change The Sort Order: By Market Cap or Company Size Performance: Year-to-date, Week and Day |  |
|
Get the most comprehensive stock market coverage daily at 12Stocks.com ➞ Best Stocks Today ➞ Best Stocks Weekly ➞ Best Stocks Year-to-Date ➞ Best Stocks Trends ➞  Best Stocks Today 12Stocks.com Best Nasdaq Stocks ➞ Best S&P 500 Stocks ➞ Best Tech Stocks ➞ Best Biotech Stocks ➞ |
| Detailed Overview of Healthcare Stocks |
| Healthcare Technical Overview, Leaders & Laggards, Top Healthcare ETF Funds & Detailed Healthcare Stocks List, Charts, Trends & More |
| Healthcare Sector: Technical Analysis, Trends & YTD Performance | |
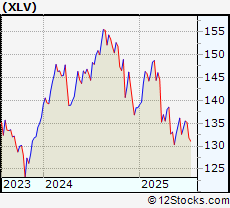
| Healthcare sector is composed of stocks
from pharmaceutical, biotech, diagnostics labs, insurance providers
and healthcare services. Healthcare sector, as represented by XLV, an exchange-traded fund [ETF] that holds basket of Healthcare stocks (e.g, Merck, Amgen) is up by 4.95646% and is currently underperforming the overall market by -9.80144% year-to-date. Below is a quick view of Technical charts and trends: |
|
 XLV Weekly Chart |
|
| Long Term Trend: Very Good | |
| Medium Term Trend: Very Good | |
 XLV Daily Chart |
|
| Short Term Trend: Very Good | |
| Overall Trend Score: 100 | |
| YTD Performance: 4.95646% | |
| **Trend Scores & Views Are Only For Educational Purposes And Not For Investing | |
| 12Stocks.com: Top Performing Healthcare Sector Stocks | ||||||||||||||||||||||||||||||||||||||||||||||||
 The top performing Healthcare sector stocks year to date are
Now, more recently, over last week, the top performing Healthcare sector stocks on the move are


|
||||||||||||||||||||||||||||||||||||||||||||||||
| 12Stocks.com: Investing in Healthcare Sector using Exchange Traded Funds | |
|
The following table shows list of key exchange traded funds (ETF) that
help investors track Healthcare Index. For detailed view, check out our ETF Funds section of our website. Quick View: Move mouse or cursor over ETF symbol (ticker) to view short-term Technical chart and over ETF name to view long term chart. Click on ticker or stock name for detailed view. Click on to add stock symbol to your watchlist and to view watchlist. |
12Stocks.com List of ETFs that track Healthcare Index
| Ticker | ETF Name | Watchlist | Recent Price | Smart Investing & Trading Score | Change % | Week % | Year-to-date % |
| BTEC | Principal Healthcare Innovators | | 39.49 | 30 | 0 | 1.02328 | 0% |
| 12Stocks.com: Charts, Trends, Fundamental Data and Performances of Healthcare Stocks | |
|
We now take in-depth look at all Healthcare stocks including charts, multi-period performances and overall trends (as measured by Smart Investing & Trading Score). One can sort Healthcare stocks (click link to choose) by Daily, Weekly and by Year-to-Date performances. Also, one can sort by size of the company or by market capitalization. |
| Select Your Default Chart Type: | |||||
| |||||
| Click on stock symbol or name for detailed view. Click on to add stock symbol to your watchlist and to view watchlist. Quick View: Move mouse or cursor over "Daily" to quickly view daily Technical stock chart and over "Weekly" to view weekly Technical stock chart. | |||||

 | LLY Lilly(Eli) & Co |
| Sector: Health Care | |
| SubSector: Drug Manufacturers - General | |
| MarketCap: 688273 Millions | |
| Recent Price: 819.85 Smart Investing & Trading Score: 100 | |
| Day Percent Change: -0.674808% Day Change: -5.2 | |
| Week Change: 10.5143% Year-to-date Change: 5.8% | |
| LLY Links: Profile News Message Board | |
| Charts:- Daily , Weekly | |
| Add LLY to Watchlist: View: Get Complete LLY Trend Analysis ➞ | |
 | JNJ Johnson & Johnson |
| Sector: Health Care | |
| SubSector: Drug Manufacturers - General | |
| MarketCap: 429720 Millions | |
| Recent Price: 185.98 Smart Investing & Trading Score: 100 | |
| Day Percent Change: -0.0376243% Day Change: -0.07 | |
| Week Change: 5.2578% Year-to-date Change: 31.3% | |
| JNJ Links: Profile News Message Board | |
| Charts:- Daily , Weekly | |
| Add JNJ to Watchlist: View: Get Complete JNJ Trend Analysis ➞ | |
 | ABBV Abbvie Inc |
| Sector: Health Care | |
| SubSector: Drug Manufacturers - General | |
| MarketCap: 375500 Millions | |
| Recent Price: 236.56 Smart Investing & Trading Score: 100 | |
| Day Percent Change: -3.19993% Day Change: -6.41 | |
| Week Change: 7.53216% Year-to-date Change: 35.5% | |
| ABBV Links: Profile News Message Board | |
| Charts:- Daily , Weekly | |
| Add ABBV to Watchlist: View: Get Complete ABBV Trend Analysis ➞ | |
 | UNH Unitedhealth Group Inc |
| Sector: Health Care | |
| SubSector: Healthcare Plans | |
| MarketCap: 285640 Millions | |
| Recent Price: 353.72 Smart Investing & Trading Score: 100 | |
| Day Percent Change: 1.55613% Day Change: 5.44 | |
| Week Change: 0.542907% Year-to-date Change: -29.1% | |
| UNH Links: Profile News Message Board | |
| Charts:- Daily , Weekly | |
| Add UNH to Watchlist: View: Get Complete UNH Trend Analysis ➞ | |
 | AZN Astrazeneca plc ADR |
| Sector: Health Care | |
| SubSector: Drug Manufacturers - General | |
| MarketCap: 253309 Millions | |
| Recent Price: 83.66 Smart Investing & Trading Score: 100 | |
| Day Percent Change: -0.829777% Day Change: -0.78 | |
| Week Change: 11.0138% Year-to-date Change: 29.6% | |
| AZN Links: Profile News Message Board | |
| Charts:- Daily , Weekly | |
| Add AZN to Watchlist: View: Get Complete AZN Trend Analysis ➞ | |
 | NVS Novartis AG ADR |
| Sector: Health Care | |
| SubSector: Drug Manufacturers - General | |
| MarketCap: 246173 Millions | |
| Recent Price: 130.97 Smart Investing & Trading Score: 100 | |
| Day Percent Change: -0.56939% Day Change: -1.18 | |
| Week Change: 6.47967% Year-to-date Change: 39.7% | |
| NVS Links: Profile News Message Board | |
| Charts:- Daily , Weekly | |
| Add NVS to Watchlist: View: Get Complete NVS Trend Analysis ➞ | |
 | ABT Abbott Laboratories |
| Sector: Health Care | |
| SubSector: Medical Devices | |
| MarketCap: 231377 Millions | |
| Recent Price: 132.99 Smart Investing & Trading Score: 20 | |
| Day Percent Change: -0.359631% Day Change: -0.27 | |
| Week Change: -0.672194% Year-to-date Change: 18.9% | |
| ABT Links: Profile News Message Board | |
| Charts:- Daily , Weekly | |
| Add ABT to Watchlist: View: Get Complete ABT Trend Analysis ➞ | |
 | MRK Merck & Co Inc |
| Sector: Health Care | |
| SubSector: Drug Manufacturers - General | |
| MarketCap: 211587 Millions | |
| Recent Price: 89.51 Smart Investing & Trading Score: 100 | |
| Day Percent Change: -0.687895% Day Change: -1.1 | |
| Week Change: 12.3509% Year-to-date Change: -8.0% | |
| MRK Links: Profile News Message Board | |
| Charts:- Daily , Weekly | |
| Add MRK to Watchlist: View: Get Complete MRK Trend Analysis ➞ | |
 | TMO Thermo Fisher Scientific Inc |
| Sector: Health Care | |
| SubSector: Diagnostics & Research | |
| MarketCap: 186012 Millions | |
| Recent Price: 524.96 Smart Investing & Trading Score: 100 | |
| Day Percent Change: -1.08718% Day Change: -2.56 | |
| Week Change: 12.1709% Year-to-date Change: 0.6% | |
| TMO Links: Profile News Message Board | |
| Charts:- Daily , Weekly | |
| Add TMO to Watchlist: View: Get Complete TMO Trend Analysis ➞ | |
 | NVO Novo Nordisk ADR |
| Sector: Health Care | |
| SubSector: Drug Manufacturers - General | |
| MarketCap: 185911 Millions | |
| Recent Price: 58.74 Smart Investing & Trading Score: 90 | |
| Day Percent Change: -0.72672% Day Change: -0.91 | |
| Week Change: 0% Year-to-date Change: -31.8% | |
| NVO Links: Profile News Message Board | |
| Charts:- Daily , Weekly | |
| Add NVO to Watchlist: View: Get Complete NVO Trend Analysis ➞ | |
 | ISRG Intuitive Surgical Inc |
| Sector: Health Care | |
| SubSector: Medical Instruments & Supplies | |
| MarketCap: 167358 Millions | |
| Recent Price: 443.01 Smart Investing & Trading Score: 30 | |
| Day Percent Change: 1.1346% Day Change: 5.1 | |
| Week Change: -0.220726% Year-to-date Change: -15.5% | |
| ISRG Links: Profile News Message Board | |
| Charts:- Daily , Weekly | |
| Add ISRG to Watchlist: View: Get Complete ISRG Trend Analysis ➞ | |
 | BSX Boston Scientific Corp |
| Sector: Health Care | |
| SubSector: Medical Devices | |
| MarketCap: 158873 Millions | |
| Recent Price: 96.22 Smart Investing & Trading Score: 10 | |
| Day Percent Change: 0.38602% Day Change: 0.93 | |
| Week Change: -1.8764% Year-to-date Change: 7.7% | |
| BSX Links: Profile News Message Board | |
| Charts:- Daily , Weekly | |
| Add BSX to Watchlist: View: Get Complete BSX Trend Analysis ➞ | |
 | AMGN AMGEN Inc |
| Sector: Health Care | |
| SubSector: Drug Manufacturers - General | |
| MarketCap: 152701 Millions | |
| Recent Price: 297.40 Smart Investing & Trading Score: 100 | |
| Day Percent Change: -0.368509% Day Change: -2.21 | |
| Week Change: 6.51099% Year-to-date Change: 16.7% | |
| AMGN Links: Profile News Message Board | |
| Charts:- Daily , Weekly | |
| Add AMGN to Watchlist: View: Get Complete AMGN Trend Analysis ➞ | |
 | SYK Stryker Corp |
| Sector: Health Care | |
| SubSector: Medical Devices | |
| MarketCap: 149983 Millions | |
| Recent Price: 366.40 Smart Investing & Trading Score: 10 | |
| Day Percent Change: 0.617877% Day Change: 1.65 | |
| Week Change: -1.29842% Year-to-date Change: 2.6% | |
| SYK Links: Profile News Message Board | |
| Charts:- Daily , Weekly | |
| Add SYK to Watchlist: View: Get Complete SYK Trend Analysis ➞ | |
 | DHR Danaher Corp |
| Sector: Health Care | |
| SubSector: Diagnostics & Research | |
| MarketCap: 143361 Millions | |
| Recent Price: 210.33 Smart Investing & Trading Score: 100 | |
| Day Percent Change: -1.19786% Day Change: -1.46 | |
| Week Change: 13.1354% Year-to-date Change: -8.2% | |
| DHR Links: Profile News Message Board | |
| Charts:- Daily , Weekly | |
| Add DHR to Watchlist: View: Get Complete DHR Trend Analysis ➞ | |
 | GILD Gilead Sciences, Inc |
| Sector: Health Care | |
| SubSector: Drug Manufacturers - General | |
| MarketCap: 142755 Millions | |
| Recent Price: 110.56 Smart Investing & Trading Score: 0 | |
| Day Percent Change: -0.530814% Day Change: -1.07 | |
| Week Change: -2.73599% Year-to-date Change: 22.0% | |
| GILD Links: Profile News Message Board | |
| Charts:- Daily , Weekly | |
| Add GILD to Watchlist: View: Get Complete GILD Trend Analysis ➞ | |
 | PFE Pfizer Inc |
| Sector: Health Care | |
| SubSector: Drug Manufacturers - General | |
| MarketCap: 141456 Millions | |
| Recent Price: 27.08 Smart Investing & Trading Score: 100 | |
| Day Percent Change: -0.477766% Day Change: -0.18 | |
| Week Change: 12.4118% Year-to-date Change: 7.2% | |
| PFE Links: Profile News Message Board | |
| Charts:- Daily , Weekly | |
| Add PFE to Watchlist: View: Get Complete PFE Trend Analysis ➞ | |
 | MDT Medtronic Plc |
| Sector: Health Care | |
| SubSector: Medical Devices | |
| MarketCap: 119162 Millions | |
| Recent Price: 95.48 Smart Investing & Trading Score: 60 | |
| Day Percent Change: 0.706676% Day Change: 0.75 | |
| Week Change: -0.271569% Year-to-date Change: 21.0% | |
| MDT Links: Profile News Message Board | |
| Charts:- Daily , Weekly | |
| Add MDT to Watchlist: View: Get Complete MDT Trend Analysis ➞ | |
 | SNY Sanofi ADR |
| Sector: Health Care | |
| SubSector: Drug Manufacturers - General | |
| MarketCap: 113163 Millions | |
| Recent Price: 50.15 Smart Investing & Trading Score: 90 | |
| Day Percent Change: 0.783762% Day Change: 0.05 | |
| Week Change: 8.0819% Year-to-date Change: 8.7% | |
| SNY Links: Profile News Message Board | |
| Charts:- Daily , Weekly | |
| Add SNY to Watchlist: View: Get Complete SNY Trend Analysis ➞ | |
 | VRTX Vertex Pharmaceuticals, Inc |
| Sector: Health Care | |
| SubSector: Biotechnology | |
| MarketCap: 101561 Millions | |
| Recent Price: 408.85 Smart Investing & Trading Score: 80 | |
| Day Percent Change: 1.14792% Day Change: 3.2 | |
| Week Change: 8.5577% Year-to-date Change: 0.8% | |
| VRTX Links: Profile News Message Board | |
| Charts:- Daily , Weekly | |
| Add VRTX to Watchlist: View: Get Complete VRTX Trend Analysis ➞ | |
 | CELG Celgene Corporation |
| Sector: Health Care | |
| SubSector: Biotechnology | |
| MarketCap: 99608.4 Millions | |
| Recent Price: 55.13 Smart Investing & Trading Score: 20 | |
| Day Percent Change: 1.30467% Day Change: -9999 | |
| Week Change: -27.7457% Year-to-date Change: 0.0% | |
| CELG Links: Profile News Message Board | |
| Charts:- Daily , Weekly | |
| Add CELG to Watchlist: View: Get Complete CELG Trend Analysis ➞ | |
 | HCA HCA Healthcare Inc |
| Sector: Health Care | |
| SubSector: Medical Care Facilities | |
| MarketCap: 98457.4 Millions | |
| Recent Price: 426.69 Smart Investing & Trading Score: 100 | |
| Day Percent Change: 0.145516% Day Change: 0.64 | |
| Week Change: 2.41707% Year-to-date Change: 43.9% | |
| HCA Links: Profile News Message Board | |
| Charts:- Daily , Weekly | |
| Add HCA to Watchlist: View: Get Complete HCA Trend Analysis ➞ | |
 | BMY Bristol-Myers Squibb Co |
| Sector: Health Care | |
| SubSector: Drug Manufacturers - General | |
| MarketCap: 95950.5 Millions | |
| Recent Price: 45.73 Smart Investing & Trading Score: 80 | |
| Day Percent Change: -3.58423% Day Change: -1.45 | |
| Week Change: 3.55525% Year-to-date Change: -16.6% | |
| BMY Links: Profile News Message Board | |
| Charts:- Daily , Weekly | |
| Add BMY to Watchlist: View: Get Complete BMY Trend Analysis ➞ | |
 | CVS CVS Health Corp |
| Sector: Health Care | |
| SubSector: Healthcare Plans | |
| MarketCap: 93577.1 Millions | |
| Recent Price: 77.45 Smart Investing & Trading Score: 100 | |
| Day Percent Change: 0.754521% Day Change: 0.66 | |
| Week Change: 1.40089% Year-to-date Change: 81.2% | |
| CVS Links: Profile News Message Board | |
| Charts:- Daily , Weekly | |
| Add CVS to Watchlist: View: Get Complete CVS Trend Analysis ➞ | |
 | MCK Mckesson Corporation |
| Sector: Health Care | |
| SubSector: Medical Distribution | |
| MarketCap: 85501.8 Millions | |
| Recent Price: 758.70 Smart Investing & Trading Score: 50 | |
| Day Percent Change: -0.8339% Day Change: -3.81 | |
| Week Change: -0.24718% Year-to-date Change: 34.3% | |
| MCK Links: Profile News Message Board | |
| Charts:- Daily , Weekly | |
| Add MCK to Watchlist: View: Get Complete MCK Trend Analysis ➞ | |
| For tabular summary view of above stock list: Summary View ➞ 0 - 25 , 25 - 50 , 50 - 75 , 75 - 100 , 100 - 125 , 125 - 150 | ||
| Click To Change The Sort Order: By Market Cap or Company Size Performance: Year-to-date, Week and Day | |
| Select Chart Type: | ||
|
Best Stocks Today 12Stocks.com |
© 2025 12Stocks.com Terms & Conditions Privacy Contact Us
All Information Provided Only For Education And Not To Be Used For Investing or Trading. See Terms & Conditions


One More Thing ... Get Best Stocks Delivered Daily!
Never Ever Miss A Move With Our Top Ten Stocks Lists
Find Best Stocks In Any Market - Bull or Bear Market
Take A Peek At Our Top Ten Stocks Lists: Daily, Weekly, Year-to-Date & Top Trends
Find Best Stocks In Any Market - Bull or Bear Market
Take A Peek At Our Top Ten Stocks Lists: Daily, Weekly, Year-to-Date & Top Trends
Healthcare Stocks With Best Up Trends [0-bearish to 100-bullish]: Taysha Gene[100], DBV Technologies[100], Valneva SE[100], ClearPoint Neuro[100], Prime Medicine[100], AlloVir [100], Sarepta [100], Monopar [100], Cara [100], Absci Corp[100], Spruce Biosciences[100]
Best Healthcare Stocks Year-to-Date:
Regencell Bioscience[12636.6%], Kaleido BioSciences[9900%], Vor Biopharma[3175%], Nanobiotix ADR[581.379%], Eagle [542.857%], So-Young [395.711%], I-Mab ADR[357.506%], Monopar [337.489%], Nektar [319.84%], 908 Devices[299.543%], DBV Technologies[276.923%] Best Healthcare Stocks This Week:
Athersys [193287%], Nobilis Health[101349%], VBI Vaccines[86898.5%], ContraFect [47677.8%], Clovis Oncology[39610.5%], Endo [28369.6%], NanoString Technologies[17224.7%], Neptune Wellness[14100%], ViewRay [11470.2%], Mallkrodt [11382.1%], Achillion [10033.3%] Best Healthcare Stocks Daily:
Kaleido BioSciences[9900%], Neoleukin [332.665%], Syros [226.23%], Athenex [103.333%], Taysha Gene[53.4591%], DBV Technologies[21.6485%], Valneva SE[20.197%], ClearPoint Neuro[19.7991%], Prime Medicine[19.4097%], Accelerate Diagnostics[17.6471%], Aptose Biosciences[17.5439%]