
 Login Sign Up


| |||||
 |  | ||||

| 12Stocks.com Market Intelligence |
Best Healthcare Stocks
 | "Discover best trending healthcare stocks with 12Stocks.com." |
| - Subu Vdaygiri, Founder, 12Stocks.com |
| In a hurry? Healthcare Stocks Lists: Performance Trends Table, Stock Charts
Sort Healthcare stocks: Daily, Weekly, Year-to-Date, Market Cap & Trends. Filter Healthcare stocks list by size:All Healthcare Large Mid-Range Small |
| 12Stocks.com Healthcare Stocks Performances & Trends Daily | |||||||||
|
|  The overall Smart Investing & Trading Score is 52 (0-bearish to 100-bullish) which puts Healthcare sector in short term neutral trend. The Smart Investing & Trading Score from previous trading session is 38 and hence an improvement of trend.
| ||||||||
Here are the Smart Investing & Trading Scores of the most requested Healthcare stocks at 12Stocks.com (click stock name for detailed review):
|


| 12Stocks.com: Investing in Healthcare sector with Stocks | |
|
The following table helps investors and traders sort through current performance and trends (as measured by Smart Investing & Trading Score) of various
stocks in the Healthcare sector. Quick View: Move mouse or cursor over stock symbol (ticker) to view short-term Technical chart and over stock name to view long term chart. Click on  to add stock symbol to your watchlist and to add stock symbol to your watchlist and  to view watchlist. Click on any ticker or stock name for detailed market intelligence report for that stock. to view watchlist. Click on any ticker or stock name for detailed market intelligence report for that stock. |
12Stocks.com Performance of Stocks in Healthcare Sector
| Ticker | Stock Name | Watchlist | Category | Recent Price | Smart Investing & Trading Score | Change % | YTD Change% |
| ZCMD | Zhongchao |   | Health Information | 1.72 | 31 | 7.86% | 369.73% |
| ADXN | Addex | | Biotechnology | 18.74 | 51 | -2.80% | 207.72% |
| ADCT | ADC | | Biotechnology | 4.97 | 83 | 6.20% | 199.40% |
| RNA | Avidity Biosciences | | Biotechnology | 25.14 | 90 | 4.06% | 178.10% |
| ARQT | Arcutis Bio | | Biotechnology | 8.74 | 36 | -2.24% | 170.59% |
| FUSN | Fusion | | Biotechnology | 21.42 | 83 | 0.47% | 123.13% |
| PRAX | Praxis Precision | | Biotechnology | 48.84 | 58 | 2.22% | 117.60% |
| GBIO | Generation Bio | | Biotechnology | 3.26 | 68 | 16.01% | 97.58% |
| DYN | Dyne | | Biotechnology | 25.44 | 27 | 2.29% | 91.28% |
| MNPR | Monopar | | Biotechnology | 0.65 | 51 | 2.85% | 88.95% |
| RNLX | Renalytix AI | | Diagnostics & Research | 0.70 | 31 | -6.30% | 78.90% |
| BDTX | Black Diamond | | Biotechnology | 5.01 | 31 | -0.20% | 78.29% |
| TARS | Tarsus | | Biotechnology | 33.71 | 63 | 4.40% | 66.22% |
| NNOX | Nano X | | Medical Devices | 9.31 | 68 | 3.22% | 46.15% |
| TSHA | Taysha Gene | | Biotechnology | 2.53 | 63 | 2.85% | 42.13% |
| KYMR | Kymera | | Biotechnology | 35.71 | 70 | 3.96% | 40.54% |
| KROS | Keros | | Biotechnology | 55.19 | 13 | -1.06% | 38.53% |
| IMNM | Immunome | | Biotechnology | 14.66 | 0 | -4.06% | 37.14% |
| NRIX | Nurix | | Biotechnology | 14.13 | 68 | 4.05% | 36.79% |
| LTRN | Lantern Pharma | | Biotechnology | 5.77 | 43 | 0.87% | 34.50% |
| STTK | Shattuck Labs | | Biotechnology | 9.49 | 33 | 2.04% | 33.66% |
| LLY | Eli Lilly | | Pharmaceutical | 745.69 | 51 | 1.96% | 27.92% |
| DVA | DaVita | | Specialized | 133.91 | 83 | 1.05% | 27.83% |
| ALGS | Aligos | | Biotechnology | 0.82 | 63 | 2.82% | 26.45% |
| RVMD | Revolution Medicines | | Biotechnology | 36.26 | 90 | -0.47% | 26.43% |
| For chart view version of above stock list: Chart View ➞ 0 - 25 , 25 - 50 , 50 - 75 , 75 - 100 , 100 - 125 , 125 - 150 , 150 - 175 | ||
 | Click To Change The Sort Order: By Market Cap or Company Size Performance: Year-to-date, Week and Day |  |
|
Get the most comprehensive stock market coverage daily at 12Stocks.com ➞ Best Stocks Today ➞ Best Stocks Weekly ➞ Best Stocks Year-to-Date ➞ Best Stocks Trends ➞  Best Stocks Today 12Stocks.com Best Nasdaq Stocks ➞ Best S&P 500 Stocks ➞ Best Tech Stocks ➞ Best Biotech Stocks ➞ |
| Detailed Overview of Healthcare Stocks |
| Healthcare Technical Overview, Leaders & Laggards, Top Healthcare ETF Funds & Detailed Healthcare Stocks List, Charts, Trends & More |
| Healthcare Sector: Technical Analysis, Trends & YTD Performance | |
| Healthcare sector is composed of stocks
from pharmaceutical, biotech, diagnostics labs, insurance providers
and healthcare services. Healthcare sector, as represented by XLV, an exchange-traded fund [ETF] that holds basket of Healthcare stocks (e.g, Merck, Amgen) is up by 3.61% and is currently underperforming the overall market by -2.03% year-to-date. Below is a quick view of Technical charts and trends: |
|
 XLV Weekly Chart |
|
| Long Term Trend: Good | |
| Medium Term Trend: Not Good | |
 XLV Daily Chart |
|
| Short Term Trend: Very Good | |
| Overall Trend Score: 52 | |
| YTD Performance: 3.61% | |
| **Trend Scores & Views Are Only For Educational Purposes And Not For Investing | |
| 12Stocks.com: Top Performing Healthcare Sector Stocks | ||||||||||||||||||||||||||||||||||||||||||||||||
 The top performing Healthcare sector stocks year to date are
Now, more recently, over last week, the top performing Healthcare sector stocks on the move are


|
||||||||||||||||||||||||||||||||||||||||||||||||
| 12Stocks.com: Investing in Healthcare Sector using Exchange Traded Funds | |
|
The following table shows list of key exchange traded funds (ETF) that
help investors track Healthcare Index. For detailed view, check out our ETF Funds section of our website. Quick View: Move mouse or cursor over ETF symbol (ticker) to view short-term Technical chart and over ETF name to view long term chart. Click on ticker or stock name for detailed view. Click on to add stock symbol to your watchlist and to view watchlist. |
12Stocks.com List of ETFs that track Healthcare Index
| Ticker | ETF Name | Watchlist | Recent Price | Smart Investing & Trading Score | Change % | Week % | Year-to-date % |
| XLV | Health Care | | 141.30 | 52 | 1.30 | 1.69 | 3.61% |
| XBI | Biotech | | 84.69 | 32 | 2.28 | 2.25 | -5.15% |
| IBB | Biotechnology | | 128.02 | 32 | 1.51 | 2.65 | -5.76% |
| BBH | Biotech | | 157.29 | 49 | 1.77 | 3.24 | -4.85% |
| VHT | Health Care | | 257.82 | 52 | 1.29 | 1.77 | 2.84% |
| IYH | Healthcare | | 59.21 | 52 | 1.33 | 1.81 | 3.43% |
| IHF | Healthcare Providers | | 52.32 | 70 | 0.47 | 0.21 | -0.36% |
| IHI | Medical Devices | | 55.51 | 50 | 1.48 | 2.12 | 2.85% |
| BIB | Biotechnology | | 50.33 | 39 | 2.51 | 4.42 | -11.78% |
| BIS | Short Biotech | | 19.94 | 68 | -2.59 | -4.57 | 10.35% |
| XHE | Health Care Equipment | | 83.01 | 42 | 1.63 | 2.14 | -1.48% |
| CURE | Healthcare Bull 3X | | 108.12 | 39 | 3.52 | 4.64 | 6.27% |
| LABU | Biotech Bull 3X | | 91.98 | 32 | 6.42 | 6.89 | -24.59% |
| LABD | Biotech Bear 3X | | 10.07 | 55 | -6.33 | -6.76 | 3.92% |
| PSCH | SmallCap Health Care | | 41.22 | 55 | 2.05 | 2.58 | -3.7% |
| XHS | Health Care Services | | 88.75 | 75 | 1.49 | 1.91 | -0.22% |
| PTH | DWA Healthcare Momentum | | 40.17 | 68 | 2.11 | 1.62 | 2.63% |
| BTEC | Principal Healthcare Innovators | | 34.81 | 32 | 3.10 | 2.79 | -4.2% |
| RXL | Health Care | | 96.15 | 52 | 0.87 | 3.14 | 5.19% |
| RXD | Short Health Care | | 11.24 | 43 | -2.18 | -3.39 | -5.7% |
| 12Stocks.com: Charts, Trends, Fundamental Data and Performances of Healthcare Stocks | |
|
We now take in-depth look at all Healthcare stocks including charts, multi-period performances and overall trends (as measured by Smart Investing & Trading Score). One can sort Healthcare stocks (click link to choose) by Daily, Weekly and by Year-to-Date performances. Also, one can sort by size of the company or by market capitalization. |
| Select Your Default Chart Type: | |||||
| |||||
| Click on stock symbol or name for detailed view. Click on to add stock symbol to your watchlist and to view watchlist. Quick View: Move mouse or cursor over "Daily" to quickly view daily Technical stock chart and over "Weekly" to view weekly Technical stock chart. | |||||

 | ZCMD Zhongchao Inc. |
| Sector: Health Care | |
| SubSector: Health Information Services | |
| MarketCap: 41487 Millions | |
| Recent Price: 1.72 Smart Investing & Trading Score: 31 | |
| Day Percent Change: 7.86% Day Change: 0.13 | |
| Week Change: -8.29% Year-to-date Change: 369.7% | |
| ZCMD Links: Profile News Message Board | |
| Charts:- Daily , Weekly | |
| Add ZCMD to Watchlist: View: Get Complete ZCMD Trend Analysis ➞ | |
 | ADXN Addex Therapeutics Ltd |
| Sector: Health Care | |
| SubSector: Biotechnology | |
| MarketCap: 51487 Millions | |
| Recent Price: 18.74 Smart Investing & Trading Score: 51 | |
| Day Percent Change: -2.80% Day Change: -0.54 | |
| Week Change: -10.59% Year-to-date Change: 207.7% | |
| ADXN Links: Profile News Message Board | |
| Charts:- Daily , Weekly | |
| Add ADXN to Watchlist: View: Get Complete ADXN Trend Analysis ➞ | |
 | ADCT ADC Therapeutics SA |
| Sector: Health Care | |
| SubSector: Biotechnology | |
| MarketCap: 26087 Millions | |
| Recent Price: 4.97 Smart Investing & Trading Score: 83 | |
| Day Percent Change: 6.20% Day Change: 0.29 | |
| Week Change: 2.05% Year-to-date Change: 199.4% | |
| ADCT Links: Profile News Message Board | |
| Charts:- Daily , Weekly | |
| Add ADCT to Watchlist: View: Get Complete ADCT Trend Analysis ➞ | |
 | RNA Avidity Biosciences, Inc. |
| Sector: Health Care | |
| SubSector: Biotechnology | |
| MarketCap: 12287 Millions | |
| Recent Price: 25.14 Smart Investing & Trading Score: 90 | |
| Day Percent Change: 4.06% Day Change: 0.98 | |
| Week Change: 9.64% Year-to-date Change: 178.1% | |
| RNA Links: Profile News Message Board | |
| Charts:- Daily , Weekly | |
| Add RNA to Watchlist: View: Get Complete RNA Trend Analysis ➞ | |
 | ARQT Arcutis Biotherapeutics, Inc. |
| Sector: Health Care | |
| SubSector: Biotechnology | |
| MarketCap: 12787 Millions | |
| Recent Price: 8.74 Smart Investing & Trading Score: 36 | |
| Day Percent Change: -2.24% Day Change: -0.20 | |
| Week Change: -3.85% Year-to-date Change: 170.6% | |
| ARQT Links: Profile News Message Board | |
| Charts:- Daily , Weekly | |
| Add ARQT to Watchlist: View: Get Complete ARQT Trend Analysis ➞ | |
 | FUSN Fusion Pharmaceuticals Inc. |
| Sector: Health Care | |
| SubSector: Biotechnology | |
| MarketCap: 52487 Millions | |
| Recent Price: 21.42 Smart Investing & Trading Score: 83 | |
| Day Percent Change: 0.47% Day Change: 0.10 | |
| Week Change: 0.94% Year-to-date Change: 123.1% | |
| FUSN Links: Profile News Message Board | |
| Charts:- Daily , Weekly | |
| Add FUSN to Watchlist: View: Get Complete FUSN Trend Analysis ➞ | |
 | PRAX Praxis Precision Medicines, Inc. |
| Sector: Health Care | |
| SubSector: Biotechnology | |
| MarketCap: 16587 Millions | |
| Recent Price: 48.84 Smart Investing & Trading Score: 58 | |
| Day Percent Change: 2.22% Day Change: 1.06 | |
| Week Change: 4.53% Year-to-date Change: 117.6% | |
| PRAX Links: Profile News Message Board | |
| Charts:- Daily , Weekly | |
| Add PRAX to Watchlist: View: Get Complete PRAX Trend Analysis ➞ | |
 | GBIO Generation Bio Co. |
| Sector: Health Care | |
| SubSector: Biotechnology | |
| MarketCap: 17487 Millions | |
| Recent Price: 3.26 Smart Investing & Trading Score: 68 | |
| Day Percent Change: 16.01% Day Change: 0.45 | |
| Week Change: 17.69% Year-to-date Change: 97.6% | |
| GBIO Links: Profile News Message Board | |
| Charts:- Daily , Weekly | |
| Add GBIO to Watchlist: View: Get Complete GBIO Trend Analysis ➞ | |
 | DYN Dyne Therapeutics, Inc. |
| Sector: Health Care | |
| SubSector: Biotechnology | |
| MarketCap: 88487 Millions | |
| Recent Price: 25.44 Smart Investing & Trading Score: 27 | |
| Day Percent Change: 2.29% Day Change: 0.57 | |
| Week Change: 6.62% Year-to-date Change: 91.3% | |
| DYN Links: Profile News Message Board | |
| Charts:- Daily , Weekly | |
| Add DYN to Watchlist: View: Get Complete DYN Trend Analysis ➞ | |
 | MNPR Monopar Therapeutics Inc. |
| Sector: Health Care | |
| SubSector: Biotechnology | |
| MarketCap: 71487 Millions | |
| Recent Price: 0.65 Smart Investing & Trading Score: 51 | |
| Day Percent Change: 2.85% Day Change: 0.02 | |
| Week Change: 2.2% Year-to-date Change: 89.0% | |
| MNPR Links: Profile News Message Board | |
| Charts:- Daily , Weekly | |
| Add MNPR to Watchlist: View: Get Complete MNPR Trend Analysis ➞ | |
 | RNLX Renalytix AI plc |
| Sector: Health Care | |
| SubSector: Diagnostics & Research | |
| MarketCap: 45487 Millions | |
| Recent Price: 0.70 Smart Investing & Trading Score: 31 | |
| Day Percent Change: -6.30% Day Change: -0.05 | |
| Week Change: -10.89% Year-to-date Change: 78.9% | |
| RNLX Links: Profile News Message Board | |
| Charts:- Daily , Weekly | |
| Add RNLX to Watchlist: View: Get Complete RNLX Trend Analysis ➞ | |
 | BDTX Black Diamond Therapeutics, Inc. |
| Sector: Health Care | |
| SubSector: Biotechnology | |
| MarketCap: 12587 Millions | |
| Recent Price: 5.01 Smart Investing & Trading Score: 31 | |
| Day Percent Change: -0.20% Day Change: -0.01 | |
| Week Change: -4.75% Year-to-date Change: 78.3% | |
| BDTX Links: Profile News Message Board | |
| Charts:- Daily , Weekly | |
| Add BDTX to Watchlist: View: Get Complete BDTX Trend Analysis ➞ | |
 | TARS Tarsus Pharmaceuticals, Inc. |
| Sector: Health Care | |
| SubSector: Biotechnology | |
| MarketCap: 74487 Millions | |
| Recent Price: 33.71 Smart Investing & Trading Score: 63 | |
| Day Percent Change: 4.40% Day Change: 1.42 | |
| Week Change: 2.49% Year-to-date Change: 66.2% | |
| TARS Links: Profile News Message Board | |
| Charts:- Daily , Weekly | |
| Add TARS to Watchlist: View: Get Complete TARS Trend Analysis ➞ | |
 | NNOX Nano X Imaging Ltd. |
| Sector: Health Care | |
| SubSector: Medical Devices | |
| MarketCap: 22587 Millions | |
| Recent Price: 9.31 Smart Investing & Trading Score: 68 | |
| Day Percent Change: 3.22% Day Change: 0.29 | |
| Week Change: 2.99% Year-to-date Change: 46.2% | |
| NNOX Links: Profile News Message Board | |
| Charts:- Daily , Weekly | |
| Add NNOX to Watchlist: View: Get Complete NNOX Trend Analysis ➞ | |
 | TSHA Taysha Gene Therapies, Inc. |
| Sector: Health Care | |
| SubSector: Biotechnology | |
| MarketCap: 76487 Millions | |
| Recent Price: 2.53 Smart Investing & Trading Score: 63 | |
| Day Percent Change: 2.85% Day Change: 0.07 | |
| Week Change: 8.35% Year-to-date Change: 42.1% | |
| TSHA Links: Profile News Message Board | |
| Charts:- Daily , Weekly | |
| Add TSHA to Watchlist: View: Get Complete TSHA Trend Analysis ➞ | |
 | KYMR Kymera Therapeutics, Inc. |
| Sector: Health Care | |
| SubSector: Biotechnology | |
| MarketCap: 27087 Millions | |
| Recent Price: 35.71 Smart Investing & Trading Score: 70 | |
| Day Percent Change: 3.96% Day Change: 1.36 | |
| Week Change: 3.09% Year-to-date Change: 40.5% | |
| KYMR Links: Profile News Message Board | |
| Charts:- Daily , Weekly | |
| Add KYMR to Watchlist: View: Get Complete KYMR Trend Analysis ➞ | |
 | KROS Keros Therapeutics, Inc. |
| Sector: Health Care | |
| SubSector: Biotechnology | |
| MarketCap: 17887 Millions | |
| Recent Price: 55.19 Smart Investing & Trading Score: 13 | |
| Day Percent Change: -1.06% Day Change: -0.59 | |
| Week Change: -5.75% Year-to-date Change: 38.5% | |
| KROS Links: Profile News Message Board | |
| Charts:- Daily , Weekly | |
| Add KROS to Watchlist: View: Get Complete KROS Trend Analysis ➞ | |
 | IMNM Immunome, Inc. |
| Sector: Health Care | |
| SubSector: Biotechnology | |
| MarketCap: 12487 Millions | |
| Recent Price: 14.66 Smart Investing & Trading Score: 0 | |
| Day Percent Change: -4.06% Day Change: -0.62 | |
| Week Change: -12.16% Year-to-date Change: 37.1% | |
| IMNM Links: Profile News Message Board | |
| Charts:- Daily , Weekly | |
| Add IMNM to Watchlist: View: Get Complete IMNM Trend Analysis ➞ | |
 | NRIX Nurix Therapeutics, Inc. |
| Sector: Health Care | |
| SubSector: Biotechnology | |
| MarketCap: 16787 Millions | |
| Recent Price: 14.13 Smart Investing & Trading Score: 68 | |
| Day Percent Change: 4.05% Day Change: 0.55 | |
| Week Change: -0.25% Year-to-date Change: 36.8% | |
| NRIX Links: Profile News Message Board | |
| Charts:- Daily , Weekly | |
| Add NRIX to Watchlist: View: Get Complete NRIX Trend Analysis ➞ | |
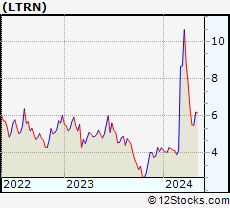 | LTRN Lantern Pharma Inc. |
| Sector: Health Care | |
| SubSector: Biotechnology | |
| MarketCap: 11487 Millions | |
| Recent Price: 5.77 Smart Investing & Trading Score: 43 | |
| Day Percent Change: 0.87% Day Change: 0.05 | |
| Week Change: 4.53% Year-to-date Change: 34.5% | |
| LTRN Links: Profile News Message Board | |
| Charts:- Daily , Weekly | |
| Add LTRN to Watchlist: View: Get Complete LTRN Trend Analysis ➞ | |
 | STTK Shattuck Labs, Inc. |
| Sector: Health Care | |
| SubSector: Biotechnology | |
| MarketCap: 16987 Millions | |
| Recent Price: 9.49 Smart Investing & Trading Score: 33 | |
| Day Percent Change: 2.04% Day Change: 0.19 | |
| Week Change: -3.06% Year-to-date Change: 33.7% | |
| STTK Links: Profile News Message Board | |
| Charts:- Daily , Weekly | |
| Add STTK to Watchlist: View: Get Complete STTK Trend Analysis ➞ | |
 | LLY Eli Lilly and Company |
| Sector: Health Care | |
| SubSector: Drug Manufacturers - Major | |
| MarketCap: 130066 Millions | |
| Recent Price: 745.69 Smart Investing & Trading Score: 51 | |
| Day Percent Change: 1.96% Day Change: 14.36 | |
| Week Change: 2.67% Year-to-date Change: 27.9% | |
| LLY Links: Profile News Message Board | |
| Charts:- Daily , Weekly | |
| Add LLY to Watchlist: View: Get Complete LLY Trend Analysis ➞ | |
 | DVA DaVita Inc. |
| Sector: Health Care | |
| SubSector: Specialized Health Services | |
| MarketCap: 8954.36 Millions | |
| Recent Price: 133.91 Smart Investing & Trading Score: 83 | |
| Day Percent Change: 1.05% Day Change: 1.39 | |
| Week Change: 4.76% Year-to-date Change: 27.8% | |
| DVA Links: Profile News Message Board | |
| Charts:- Daily , Weekly | |
| Add DVA to Watchlist: View: Get Complete DVA Trend Analysis ➞ | |
 | ALGS Aligos Therapeutics, Inc. |
| Sector: Health Care | |
| SubSector: Biotechnology | |
| MarketCap: 76487 Millions | |
| Recent Price: 0.82 Smart Investing & Trading Score: 63 | |
| Day Percent Change: 2.82% Day Change: 0.02 | |
| Week Change: 3.85% Year-to-date Change: 26.5% | |
| ALGS Links: Profile News Message Board | |
| Charts:- Daily , Weekly | |
| Add ALGS to Watchlist: View: Get Complete ALGS Trend Analysis ➞ | |
 | RVMD Revolution Medicines, Inc. |
| Sector: Health Care | |
| SubSector: Biotechnology | |
| MarketCap: 28087 Millions | |
| Recent Price: 36.26 Smart Investing & Trading Score: 90 | |
| Day Percent Change: -0.47% Day Change: -0.17 | |
| Week Change: 3.75% Year-to-date Change: 26.4% | |
| RVMD Links: Profile News Message Board | |
| Charts:- Daily , Weekly | |
| Add RVMD to Watchlist: View: Get Complete RVMD Trend Analysis ➞ | |
| For tabular summary view of above stock list: Summary View ➞ 0 - 25 , 25 - 50 , 50 - 75 , 75 - 100 , 100 - 125 , 125 - 150 , 150 - 175 | ||
| Click To Change The Sort Order: By Market Cap or Company Size Performance: Year-to-date, Week and Day | |
| Select Chart Type: | ||
|
Best Stocks Today 12Stocks.com |
© 2024 12Stocks.com Terms & Conditions Privacy Contact Us
All Information Provided Only For Education And Not To Be Used For Investing or Trading. See Terms & Conditions


One More Thing ... Get Best Stocks Delivered Daily!
Never Ever Miss A Move With Our Top Ten Stocks Lists
Find Best Stocks In Any Market - Bull or Bear Market
Take A Peek At Our Top Ten Stocks Lists: Daily, Weekly, Year-to-Date & Top Trends
Find Best Stocks In Any Market - Bull or Bear Market
Take A Peek At Our Top Ten Stocks Lists: Daily, Weekly, Year-to-Date & Top Trends
Healthcare Stocks With Best Up Trends [0-bearish to 100-bullish]: Pieris [100], PureTech Health[100], Day One[100], Hutchison China[100], Oscar Health[100], Agios [100], Quest Diagnostics[100], Brookdale Senior[100], Avadel [100], Fresenius [100], PMV [100]
Best Healthcare Stocks Year-to-Date:
Pieris [6493.41%], Precision BioSciences[2702.74%], Inovio [1933.33%], Assembly Biosciences[1518.1%], Aurora Cannabis[1458.17%], Adverum Biotechnologies[1361.21%], NuCana [1252.27%], Affimed N.V[756%], Agenus [680.29%], CareMax [650.52%], Corbus [524.83%] Best Healthcare Stocks This Week:
Pieris [8175.86%], CareMax [41.63%], VolitionRx [37.99%], Seres [35.74%], BeyondSpring [27.22%], GeneDx [24.95%], ProKidney [24.75%], Agenus [21.66%], MSP Recovery[19.2%], Annovis Bio[18.8%], Generation Bio[17.69%] Best Healthcare Stocks Daily:
Pieris [8113.55%], VolitionRx [41.10%], Seres [21.68%], Aurora Cannabis[18.15%], Generation Bio[16.01%], Concord [15.93%], GeneDx [15.93%], Canopy Growth[15.03%], ChromaDex [14.86%], IGM Biosciences[14.07%], CareMax [13.40%]