
 Login Sign Up


| |||||
 |  | ||||

| 12Stocks.com Market Intelligence |
Best Financial Stocks
| In a hurry? Financial Stocks Lists: Performance Trends Table, Stock Charts
Sort Financial stocks: Daily, Weekly, Year-to-Date, Market Cap & Trends. Filter Financial stocks list by size:All Financial Large Mid-Range Small & MicroCap |
| 12Stocks.com Financial Stocks Performances & Trends Daily | |||||||||
|
|  The overall Smart Investing & Trading Score is 20 (0-bearish to 100-bullish) which puts Financial sector in short term bearish trend. The Smart Investing & Trading Score from previous trading session is 30 and a deterioration of trend continues.
| ||||||||
Here are the Smart Investing & Trading Scores of the most requested Financial stocks at 12Stocks.com (click stock name for detailed review):
|


| 12Stocks.com: Investing in Financial sector with Stocks | |
|
The following table helps investors and traders sort through current performance and trends (as measured by Smart Investing & Trading Score) of various
stocks in the Financial sector. Quick View: Move mouse or cursor over stock symbol (ticker) to view short-term Technical chart and over stock name to view long term chart. Click on  to add stock symbol to your watchlist and to add stock symbol to your watchlist and  to view watchlist. Click on any ticker or stock name for detailed market intelligence report for that stock. to view watchlist. Click on any ticker or stock name for detailed market intelligence report for that stock. |
12Stocks.com Performance of Stocks in Financial Sector
| Ticker | Stock Name | Watchlist | Category | Recent Price | Trend Score | Change % | YTD Change% |
| RC | Ready Capital |   | REIT - Mortgage | 3.74 | 10 | -2.09% | -42.64% |
| GOOD | Gladstone Commercial | | REIT - | 12.20 | 10 | -0.65% | -20.77% |
| FSBC | Five Star | | Banks - Regional | 31.78 | 20 | -0.97% | 9.56% |
| COBZ | CoBiz | | Regional - Southwest Banks | 43.09 | 90 | 1.39% | 0.00% |
| UVE | Universal Insurance | | Insurance - Property & Casualty | 26.56 | 90 | 2.95% | 31.67% |
| MPB | Mid Penn | | Banks - Regional | 28.82 | 30 | 0.17% | 4.36% |
| THFF | First | | Banks - Regional | 54.41 | 10 | -1.41% | 22.47% |
| CUNB | CU Bancorp | | Regional Banks | 3.23 | 30 | 2.87% | 0.00% |
| SCU | Sculptor Capital | | Asset Mgmt | 12.72 | 60 | -0.24% | 0.00% |
| NIE | Virtus Equity | | Closed-End Fund - Equity | 25.29 | 90 | 0.52% | 10.52% |
| FCBC | First Community | | Banks - Regional | 34.16 | 0 | -0.86% | -14.27% |
| INN | Summit Hotel | | REIT - Hotel & Motel | 5.52 | 40 | -0.18% | -15.85% |
| BHLB | Berkshire Hills | | S&L | 26.13 | 50 | -0.65% | -5.26% |
| CAC | Camden National | | Banks - Regional | 37.89 | 10 | -0.73% | -7.51% |
| ORRF | Orrstown | | Banks - Regional | 33.46 | 10 | -0.65% | -4.49% |
| NRE | Northstar Realty | | REIT - Office | 3.60 | 0 | 6.19% | 0.00% |
| IBCP | Independent Bank | | Banks - Regional | 30.29 | 0 | -1.09% | -9.72% |
| ITG | Technology | | Brokerage | 3.60 | 0 | 6.19% | 0.00% |
| SGBK | Stonegate Bank | | Regional Banks | 3.60 | 0 | 6.19% | 0.00% |
| FAX | abrdn Asia-Pacific | | Closed-End Fund - Debt | 16.14 | 10 | -0.25% | 17.11% |
| GIM | Templeton Global | | Closed-End Fund - Debt | 18.27 | 90 | 1.22% | 0.00% |
| OXLCM | Oxford Lane | | Asset Mgmt | 24.98 | 20 | 0.00% | 0.00% |
| DGICA | Donegal | | Insurance - Property & Casualty | 19.20 | 40 | -0.26% | 30.06% |
| PRAA | PRA | | Credit Services | 15.05 | 20 | -1.02% | -26.88% |
| GBNK | Guaranty Bancorp | | Regional Banks | 3.47 | 0 | 0.58% | 0.00% |
| For chart view version of above stock list: Chart View ➞ 0 - 25 , 25 - 50 , 50 - 75 , 75 - 100 , 100 - 125 , 125 - 150 , 150 - 175 , 175 - 200 , 200 - 225 , 225 - 250 , 250 - 275 , 275 - 300 , 300 - 325 , 325 - 350 , 350 - 375 , 375 - 400 , 400 - 425 , 425 - 450 , 450 - 475 , 475 - 500 , 500 - 525 , 525 - 550 , 550 - 575 , 575 - 600 , 600 - 625 , 625 - 650 , 650 - 675 , 675 - 700 , 700 - 725 , 725 - 750 , 750 - 775 , 775 - 800 , 800 - 825 , 825 - 850 , 850 - 875 , 875 - 900 , 900 - 925 , 925 - 950 , 950 - 975 , 975 - 1000 , 1000 - 1025 , 1025 - 1050 , 1050 - 1075 , 1075 - 1100 , 1100 - 1125 , 1125 - 1150 , 1150 - 1175 , 1175 - 1200 , 1200 - 1225 , 1225 - 1250 , 1250 - 1275 , 1275 - 1300 , 1300 - 1325 , 1325 - 1350 , 1350 - 1375 , 1375 - 1400 , 1400 - 1425 , 1425 - 1450 , 1450 - 1475 , 1475 - 1500 , 1500 - 1525 , 1525 - 1550 | ||
 | Click To Change The Sort Order: By Market Cap or Company Size Performance: Year-to-date, Week and Day |  |
|
Get the most comprehensive stock market coverage daily at 12Stocks.com ➞ Best Stocks Today ➞ Best Stocks Weekly ➞ Best Stocks Year-to-Date ➞ Best Stocks Trends ➞  Best Stocks Today 12Stocks.com Best Nasdaq Stocks ➞ Best S&P 500 Stocks ➞ Best Tech Stocks ➞ Best Biotech Stocks ➞ |
| Detailed Overview of Financial Stocks |
| Financial Technical Overview, Leaders & Laggards, Top Financial ETF Funds & Detailed Financial Stocks List, Charts, Trends & More |
| Financial Sector: Technical Analysis, Trends & YTD Performance | |
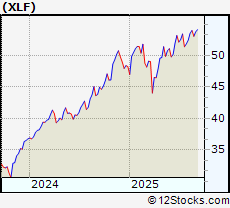
| Financial sector is composed of stocks
from banks, brokers, insurance, REITs
and services subsectors. Financial sector, as represented by XLF, an exchange-traded fund [ETF] that holds basket of Financial stocks (e.g, Bank of America, Goldman Sachs) is up by 11.4442% and is currently underperforming the overall market by -3.3137% year-to-date. Below is a quick view of Technical charts and trends: |
|
 XLF Weekly Chart |
|
| Long Term Trend: Good | |
| Medium Term Trend: Not Good | |
 XLF Daily Chart |
|
| Short Term Trend: Not Good | |
| Overall Trend Score: 20 | |
| YTD Performance: 11.4442% | |
| **Trend Scores & Views Are Only For Educational Purposes And Not For Investing | |
| 12Stocks.com: Top Performing Financial Sector Stocks | |||||||||||||||||||||||||||||||||||||||||||||||
 The top performing Financial sector stocks year to date are
Now, more recently, over last week, the top performing Financial sector stocks on the move are


|
|||||||||||||||||||||||||||||||||||||||||||||||
| 12Stocks.com: Investing in Financial Sector using Exchange Traded Funds | |
|
The following table shows list of key exchange traded funds (ETF) that
help investors track Financial Index. For detailed view, check out our ETF Funds section of our website. Quick View: Move mouse or cursor over ETF symbol (ticker) to view short-term Technical chart and over ETF name to view long term chart. Click on ticker or stock name for detailed view. Click on to add stock symbol to your watchlist and to view watchlist. |
12Stocks.com List of ETFs that track Financial Index
| Ticker | ETF Name | Watchlist | Recent Price | Smart Investing & Trading Score | Change % | Week % | Year-to-date % |
| CHIX | China Financials | | 10.57 | 20 | 0 | 0 | 0% |
| 12Stocks.com: Charts, Trends, Fundamental Data and Performances of Financial Stocks | |
|
We now take in-depth look at all Financial stocks including charts, multi-period performances and overall trends (as measured by Smart Investing & Trading Score). One can sort Financial stocks (click link to choose) by Daily, Weekly and by Year-to-Date performances. Also, one can sort by size of the company or by market capitalization. |
| Select Your Default Chart Type: | |||||
| |||||
| Click on stock symbol or name for detailed view. Click on to add stock symbol to your watchlist and to view watchlist. Quick View: Move mouse or cursor over "Daily" to quickly view daily Technical stock chart and over "Weekly" to view weekly Technical stock chart. | |||||

 | RC Ready Capital Corp |
| Sector: Financials | |
| SubSector: REIT - Mortgage | |
| MarketCap: 704.96 Millions | |
| Recent Price: 3.74 Smart Investing & Trading Score: 10 | |
| Day Percent Change: -2.09424% Day Change: -0.14 | |
| Week Change: -12% Year-to-date Change: -42.6% | |
| RC Links: Profile News Message Board | |
| Charts:- Daily , Weekly | |
| Add RC to Watchlist: View: Get Complete RC Trend Analysis ➞ | |
 | GOOD Gladstone Commercial Corp |
| Sector: Financials | |
| SubSector: REIT - Diversified | |
| MarketCap: 702.52 Millions | |
| Recent Price: 12.20 Smart Investing & Trading Score: 10 | |
| Day Percent Change: -0.651466% Day Change: 0.02 | |
| Week Change: -3.70955% Year-to-date Change: -20.8% | |
| GOOD Links: Profile News Message Board | |
| Charts:- Daily , Weekly | |
| Add GOOD to Watchlist: View: Get Complete GOOD Trend Analysis ➞ | |
 | FSBC Five Star Bancorp |
| Sector: Financials | |
| SubSector: Banks - Regional | |
| MarketCap: 701.51 Millions | |
| Recent Price: 31.78 Smart Investing & Trading Score: 20 | |
| Day Percent Change: -0.966033% Day Change: -0.2 | |
| Week Change: -3.78444% Year-to-date Change: 9.6% | |
| FSBC Links: Profile News Message Board | |
| Charts:- Daily , Weekly | |
| Add FSBC to Watchlist: View: Get Complete FSBC Trend Analysis ➞ | |
 | COBZ CoBiz Financial Inc. |
| Sector: Financials | |
| SubSector: Regional - Southwest Banks | |
| MarketCap: 700.5 Millions | |
| Recent Price: 43.09 Smart Investing & Trading Score: 90 | |
| Day Percent Change: 1.38824% Day Change: -9999 | |
| Week Change: 49.1003% Year-to-date Change: 0.0% | |
| COBZ Links: Profile News Message Board | |
| Charts:- Daily , Weekly | |
| Add COBZ to Watchlist: View: Get Complete COBZ Trend Analysis ➞ | |
 | UVE Universal Insurance Holdings Inc |
| Sector: Financials | |
| SubSector: Insurance - Property & Casualty | |
| MarketCap: 696.64 Millions | |
| Recent Price: 26.56 Smart Investing & Trading Score: 90 | |
| Day Percent Change: 2.94574% Day Change: 0.13 | |
| Week Change: 5.35502% Year-to-date Change: 31.7% | |
| UVE Links: Profile News Message Board | |
| Charts:- Daily , Weekly | |
| Add UVE to Watchlist: View: Get Complete UVE Trend Analysis ➞ | |
 | MPB Mid Penn Bancorp, Inc |
| Sector: Financials | |
| SubSector: Banks - Regional | |
| MarketCap: 695.02 Millions | |
| Recent Price: 28.82 Smart Investing & Trading Score: 30 | |
| Day Percent Change: 0.173792% Day Change: -0.01 | |
| Week Change: -4.25249% Year-to-date Change: 4.4% | |
| MPB Links: Profile News Message Board | |
| Charts:- Daily , Weekly | |
| Add MPB to Watchlist: View: Get Complete MPB Trend Analysis ➞ | |
 | THFF First Financial Corp |
| Sector: Financials | |
| SubSector: Banks - Regional | |
| MarketCap: 694.74 Millions | |
| Recent Price: 54.41 Smart Investing & Trading Score: 10 | |
| Day Percent Change: -1.4133% Day Change: -0.08 | |
| Week Change: -5.93015% Year-to-date Change: 22.5% | |
| THFF Links: Profile News Message Board | |
| Charts:- Daily , Weekly | |
| Add THFF to Watchlist: View: Get Complete THFF Trend Analysis ➞ | |
 | CUNB CU Bancorp |
| Sector: Financials | |
| SubSector: Regional - Pacific Banks | |
| MarketCap: 693.44 Millions | |
| Recent Price: 3.23 Smart Investing & Trading Score: 30 | |
| Day Percent Change: 2.86624% Day Change: -9999 | |
| Week Change: -49.2936% Year-to-date Change: 0.0% | |
| CUNB Links: Profile News Message Board | |
| Charts:- Daily , Weekly | |
| Add CUNB to Watchlist: View: Get Complete CUNB Trend Analysis ➞ | |
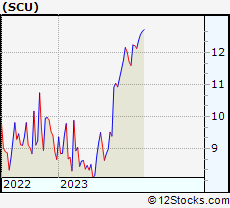 | SCU Sculptor Capital Management, Inc. |
| Sector: Financials | |
| SubSector: Asset Management | |
| MarketCap: 689.803 Millions | |
| Recent Price: 12.72 Smart Investing & Trading Score: 60 | |
| Day Percent Change: -0.235294% Day Change: -9999 | |
| Week Change: 0.55336% Year-to-date Change: 0.0% | |
| SCU Links: Profile News Message Board | |
| Charts:- Daily , Weekly | |
| Add SCU to Watchlist: View: Get Complete SCU Trend Analysis ➞ | |
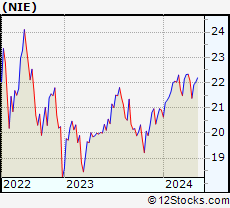 | NIE Virtus Equity & Convertible Income Fund |
| Sector: Financials | |
| SubSector: Closed-End Fund - Equity | |
| MarketCap: 689.4 Millions | |
| Recent Price: 25.29 Smart Investing & Trading Score: 90 | |
| Day Percent Change: 0.516693% Day Change: 0.03 | |
| Week Change: 2.01694% Year-to-date Change: 10.5% | |
| NIE Links: Profile News Message Board | |
| Charts:- Daily , Weekly | |
| Add NIE to Watchlist: View: Get Complete NIE Trend Analysis ➞ | |
 | FCBC First Community Bankshares Inc |
| Sector: Financials | |
| SubSector: Banks - Regional | |
| MarketCap: 687.91 Millions | |
| Recent Price: 34.16 Smart Investing & Trading Score: 0 | |
| Day Percent Change: -0.856314% Day Change: 0.54 | |
| Week Change: -5.15135% Year-to-date Change: -14.3% | |
| FCBC Links: Profile News Message Board | |
| Charts:- Daily , Weekly | |
| Add FCBC to Watchlist: View: Get Complete FCBC Trend Analysis ➞ | |
 | INN Summit Hotel Properties Inc |
| Sector: Financials | |
| SubSector: REIT - Hotel & Motel | |
| MarketCap: 687.05 Millions | |
| Recent Price: 5.52 Smart Investing & Trading Score: 40 | |
| Day Percent Change: -0.180832% Day Change: -0.09 | |
| Week Change: -2.6455% Year-to-date Change: -15.9% | |
| INN Links: Profile News Message Board | |
| Charts:- Daily , Weekly | |
| Add INN to Watchlist: View: Get Complete INN Trend Analysis ➞ | |
 | BHLB Berkshire Hills Bancorp, Inc. |
| Sector: Financials | |
| SubSector: Savings & Loans | |
| MarketCap: 686.33 Millions | |
| Recent Price: 26.13 Smart Investing & Trading Score: 50 | |
| Day Percent Change: -0.646388% Day Change: 0.01 | |
| Week Change: 2.83353% Year-to-date Change: -5.3% | |
| BHLB Links: Profile News Message Board | |
| Charts:- Daily , Weekly | |
| Add BHLB to Watchlist: View: Get Complete BHLB Trend Analysis ➞ | |
 | CAC Camden National Corp |
| Sector: Financials | |
| SubSector: Banks - Regional | |
| MarketCap: 686.29 Millions | |
| Recent Price: 37.89 Smart Investing & Trading Score: 10 | |
| Day Percent Change: -0.73356% Day Change: 0.04 | |
| Week Change: -3.56325% Year-to-date Change: -7.5% | |
| CAC Links: Profile News Message Board | |
| Charts:- Daily , Weekly | |
| Add CAC to Watchlist: View: Get Complete CAC Trend Analysis ➞ | |
 | ORRF Orrstown Financial Services, Inc |
| Sector: Financials | |
| SubSector: Banks - Regional | |
| MarketCap: 681.6 Millions | |
| Recent Price: 33.46 Smart Investing & Trading Score: 10 | |
| Day Percent Change: -0.653207% Day Change: 0.01 | |
| Week Change: -3.4622% Year-to-date Change: -4.5% | |
| ORRF Links: Profile News Message Board | |
| Charts:- Daily , Weekly | |
| Add ORRF to Watchlist: View: Get Complete ORRF Trend Analysis ➞ | |
 | NRE Northstar Realty Europe Corp. |
| Sector: Financials | |
| SubSector: REIT - Office | |
| MarketCap: 680.44 Millions | |
| Recent Price: 3.60 Smart Investing & Trading Score: 0 | |
| Day Percent Change: 6.19469% Day Change: -9999 | |
| Week Change: -89.0277% Year-to-date Change: 0.0% | |
| NRE Links: Profile News Message Board | |
| Charts:- Daily , Weekly | |
| Add NRE to Watchlist: View: Get Complete NRE Trend Analysis ➞ | |
 | IBCP Independent Bank Corporation (Ionia, MI) |
| Sector: Financials | |
| SubSector: Banks - Regional | |
| MarketCap: 679.69 Millions | |
| Recent Price: 30.29 Smart Investing & Trading Score: 0 | |
| Day Percent Change: -1.09406% Day Change: -0.14 | |
| Week Change: -4.25229% Year-to-date Change: -9.7% | |
| IBCP Links: Profile News Message Board | |
| Charts:- Daily , Weekly | |
| Add IBCP to Watchlist: View: Get Complete IBCP Trend Analysis ➞ | |
 | ITG Investment Technology Group, Inc. |
| Sector: Financials | |
| SubSector: Investment Brokerage - Regional | |
| MarketCap: 678.77 Millions | |
| Recent Price: 3.60 Smart Investing & Trading Score: 0 | |
| Day Percent Change: 6.19469% Day Change: -9999 | |
| Week Change: -89.0277% Year-to-date Change: 0.0% | |
| ITG Links: Profile News Message Board | |
| Charts:- Daily , Weekly | |
| Add ITG to Watchlist: View: Get Complete ITG Trend Analysis ➞ | |
 | SGBK Stonegate Bank |
| Sector: Financials | |
| SubSector: Regional - Southeast Banks | |
| MarketCap: 678.54 Millions | |
| Recent Price: 3.60 Smart Investing & Trading Score: 0 | |
| Day Percent Change: 6.19469% Day Change: -9999 | |
| Week Change: -89.0277% Year-to-date Change: 0.0% | |
| SGBK Links: Profile News Message Board | |
| Charts:- Daily , Weekly | |
| Add SGBK to Watchlist: View: Get Complete SGBK Trend Analysis ➞ | |
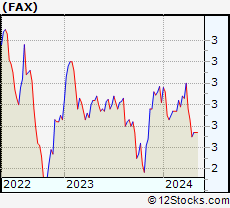 | FAX abrdn Asia-Pacific Income Fund Inc |
| Sector: Financials | |
| SubSector: Closed-End Fund - Debt | |
| MarketCap: 678.27 Millions | |
| Recent Price: 16.14 Smart Investing & Trading Score: 10 | |
| Day Percent Change: -0.247219% Day Change: -0.19 | |
| Week Change: -2.71248% Year-to-date Change: 17.1% | |
| FAX Links: Profile News Message Board | |
| Charts:- Daily , Weekly | |
| Add FAX to Watchlist: View: Get Complete FAX Trend Analysis ➞ | |
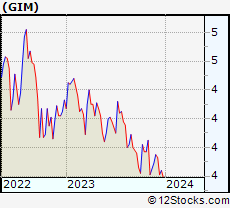 | GIM Templeton Global Income Fund |
| Sector: Financials | |
| SubSector: Closed-End Fund - Debt | |
| MarketCap: 677.407 Millions | |
| Recent Price: 18.27 Smart Investing & Trading Score: 90 | |
| Day Percent Change: 1.21884% Day Change: -9999 | |
| Week Change: 374.545% Year-to-date Change: 0.0% | |
| GIM Links: Profile News Message Board | |
| Charts:- Daily , Weekly | |
| Add GIM to Watchlist: View: Get Complete GIM Trend Analysis ➞ | |
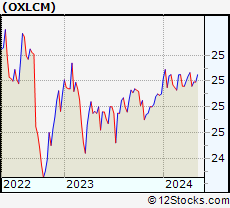 | OXLCM Oxford Lane Capital Corp. |
| Sector: Financials | |
| SubSector: Asset Management | |
| MarketCap: 672.603 Millions | |
| Recent Price: 24.98 Smart Investing & Trading Score: 20 | |
| Day Percent Change: 0% Day Change: -9999 | |
| Week Change: 0% Year-to-date Change: 0.0% | |
| OXLCM Links: Profile News Message Board | |
| Charts:- Daily , Weekly | |
| Add OXLCM to Watchlist: View: Get Complete OXLCM Trend Analysis ➞ | |
 | DGICA Donegal Group Inc |
| Sector: Financials | |
| SubSector: Insurance - Property & Casualty | |
| MarketCap: 671.63 Millions | |
| Recent Price: 19.20 Smart Investing & Trading Score: 40 | |
| Day Percent Change: -0.25974% Day Change: -0.03 | |
| Week Change: 0.41841% Year-to-date Change: 30.1% | |
| DGICA Links: Profile News Message Board | |
| Charts:- Daily , Weekly | |
| Add DGICA to Watchlist: View: Get Complete DGICA Trend Analysis ➞ | |
 | PRAA PRA Group Inc |
| Sector: Financials | |
| SubSector: Credit Services | |
| MarketCap: 671.29 Millions | |
| Recent Price: 15.05 Smart Investing & Trading Score: 20 | |
| Day Percent Change: -1.01907% Day Change: -0.06 | |
| Week Change: -5.13548% Year-to-date Change: -26.9% | |
| PRAA Links: Profile News Message Board | |
| Charts:- Daily , Weekly | |
| Add PRAA to Watchlist: View: Get Complete PRAA Trend Analysis ➞ | |
 | GBNK Guaranty Bancorp |
| Sector: Financials | |
| SubSector: Regional - Mid-Atlantic Banks | |
| MarketCap: 669.13 Millions | |
| Recent Price: 3.47 Smart Investing & Trading Score: 0 | |
| Day Percent Change: 0.57971% Day Change: -9999 | |
| Week Change: -89.2703% Year-to-date Change: 0.0% | |
| GBNK Links: Profile News Message Board | |
| Charts:- Daily , Weekly | |
| Add GBNK to Watchlist: View: Get Complete GBNK Trend Analysis ➞ | |
| For tabular summary view of above stock list: Summary View ➞ 0 - 25 , 25 - 50 , 50 - 75 , 75 - 100 , 100 - 125 , 125 - 150 , 150 - 175 , 175 - 200 , 200 - 225 , 225 - 250 , 250 - 275 , 275 - 300 , 300 - 325 , 325 - 350 , 350 - 375 , 375 - 400 , 400 - 425 , 425 - 450 , 450 - 475 , 475 - 500 , 500 - 525 , 525 - 550 , 550 - 575 , 575 - 600 , 600 - 625 , 625 - 650 , 650 - 675 , 675 - 700 , 700 - 725 , 725 - 750 , 750 - 775 , 775 - 800 , 800 - 825 , 825 - 850 , 850 - 875 , 875 - 900 , 900 - 925 , 925 - 950 , 950 - 975 , 975 - 1000 , 1000 - 1025 , 1025 - 1050 , 1050 - 1075 , 1075 - 1100 , 1100 - 1125 , 1125 - 1150 , 1150 - 1175 , 1175 - 1200 , 1200 - 1225 , 1225 - 1250 , 1250 - 1275 , 1275 - 1300 , 1300 - 1325 , 1325 - 1350 , 1350 - 1375 , 1375 - 1400 , 1400 - 1425 , 1425 - 1450 , 1450 - 1475 , 1475 - 1500 , 1500 - 1525 , 1525 - 1550 | ||
| Click To Change The Sort Order: By Market Cap or Company Size Performance: Year-to-date, Week and Day | |
| Select Chart Type: | ||
|
Best Stocks Today 12Stocks.com |
© 2025 12Stocks.com Terms & Conditions Privacy Contact Us
All Information Provided Only For Education And Not To Be Used For Investing or Trading. See Terms & Conditions


One More Thing ... Get Best Stocks Delivered Daily!
Never Ever Miss A Move With Our Top Ten Stocks Lists
Find Best Stocks In Any Market - Bull or Bear Market
Take A Peek At Our Top Ten Stocks Lists: Daily, Weekly, Year-to-Date & Top Trends
Find Best Stocks In Any Market - Bull or Bear Market
Take A Peek At Our Top Ten Stocks Lists: Daily, Weekly, Year-to-Date & Top Trends
Financial Stocks With Best Up Trends [0-bearish to 100-bullish]: PIMCO California[100], Torchmark [100], PIMCO California[100], Triumph Bancorp[100], Cipher Mining[100], Lufax Holding[100], PIMCO Municipal[100], PIMCO Municipal[100], Front Yard[100], National General[100], Fifth Street[100]
Best Financial Stocks Year-to-Date:
Insight Select[12384.6%], Better Home[523.632%], IREN [363.5%], Global Medical[353.709%], Oxford Lane[287.756%], Robinhood Markets[269.422%], Metalpha Technology[225.664%], Cipher Mining[185.3%], Banco Santander[131.403%], Mr. Cooper[124.245%], Altisource Portfolio[121.195%] Best Financial Stocks This Week:
Colony Starwood[15929900%], Blackhawk Network[91300%], Macquarie Global[81662.9%], Credit Suisse[63241.6%], Pennsylvania Real[23823%], First Republic[22570.9%], Select ome[14000%], CorEnergy Infrastructure[6797.78%], FedNat Holding[5525%], BlackRock Municipal[5340%], BlackRock MuniYield[3379.04%] Best Financial Stocks Daily:
PIMCO California[11.9545%], Torchmark [11.8363%], PIMCO California[11.4754%], BlackRock Muni[10.8108%], Blackrock MuniYield[10.72%], Triumph Bancorp[10.2661%], Cipher Mining[9.36508%], AMBAC [8.24108%], BlackRock MuniYield[8.15348%], Summit [7.79817%], Concord Acquisition[7.63431%]