
 Login Sign Up


| |||||
 |  | ||||

| 12Stocks.com Market Intelligence |
Best Financial Stocks
| In a hurry? Financial Stocks Lists: Performance Trends Table, Stock Charts
Sort Financial stocks: Daily, Weekly, Year-to-Date, Market Cap & Trends. Filter Financial stocks list by size:All Financial Large Mid-Range Small & MicroCap |
| 12Stocks.com Financial Stocks Performances & Trends Daily | |||||||||
|
|  The overall Smart Investing & Trading Score is 56 (0-bearish to 100-bullish) which puts Financial sector in short term neutral trend. The Smart Investing & Trading Score from previous trading session is 36 and hence an improvement of trend.
| ||||||||
Here are the Smart Investing & Trading Scores of the most requested Financial stocks at 12Stocks.com (click stock name for detailed review):
|


| 12Stocks.com: Investing in Financial sector with Stocks | |
|
The following table helps investors and traders sort through current performance and trends (as measured by Smart Investing & Trading Score) of various
stocks in the Financial sector. Quick View: Move mouse or cursor over stock symbol (ticker) to view short-term Technical chart and over stock name to view long term chart. Click on  to add stock symbol to your watchlist and to add stock symbol to your watchlist and  to view watchlist. Click on any ticker or stock name for detailed market intelligence report for that stock. to view watchlist. Click on any ticker or stock name for detailed market intelligence report for that stock. |
12Stocks.com Performance of Stocks in Financial Sector
| Ticker | Stock Name | Watchlist | Category | Recent Price | Trend Score | Change % | YTD Change% |
| RDN | Radian |   | Insurance | 29.29 | 36 | -0.14% | 2.59% |
| BOKF | BOK | | Regional - Southwest Banks | 85.40 | 46 | 0.32% | -0.29% |
| upst | Upstart | | Credit Services | 22.88 | 42 | 2.05% | -43.52% |
| ESGR | Enstar | | Insurance | 277.40 | 36 | 0.26% | -5.76% |
| AMG | Affiliated Managers | | Asset Mgmt | 158.19 | 36 | -0.45% | 4.47% |
| VLY | Valley National | | Regional Banks | 7.32 | 20 | 1.67% | -32.60% |
| BXMT | Blackstone Mortgage | | Mortgage | 18.33 | 32 | 0.55% | -13.82% |
| EHTH | eHealth | | Insurance | 4.61 | 42 | 6.11% | -47.19% |
| ESNT | Essent | | Mortgage | 52.67 | 17 | 0.65% | -0.13% |
| FCFS | FirstCash | | Credit Services | 128.79 | 71 | -0.66% | 18.82% |
| FSV | FirstService | | Property Mgmt | 149.31 | 10 | -0.53% | -7.88% |
| CBU | Community Bank | | Regional Banks | 42.48 | 27 | 2.29% | -18.48% |
| SF | Stifel | | Brokerage | 74.88 | 68 | 0.63% | 8.29% |
| PRI | Primerica | | Life Insurance | 210.09 | 0 | -0.73% | 2.10% |
| PNFP | Pinnacle | | Regional Banks | 78.45 | 10 | 0.15% | -10.06% |
| UNM | Unum | | Insurance | 50.79 | 58 | 1.26% | 12.32% |
| OMF | OneMain | | Credit Services | 47.90 | 63 | 1.40% | -2.64% |
| TREE | LendingTree | | Mortgage | 34.25 | 56 | -0.64% | 12.96% |
| DNP | DNP Select | | Closed-End Fund - Equity | 8.77 | 20 | 0.57% | 3.42% |
| CVBF | CVB | | Regional Banks | 15.99 | 35 | 0.88% | -20.80% |
| SNV | Synovus | | Regional Banks | 33.90 | 0 | -7.43% | -9.96% |
| BPOP | Popular | | Foreign Banks | 81.81 | 17 | 1.16% | -0.32% |
| FHN | First Horizon | | Regional Banks | 14.28 | 42 | 0.78% | 0.85% |
| CWK | Cushman & Wakefield | | Property Mgmt | 9.40 | 20 | 1.40% | -12.96% |
| CNNE | Cannae | | Asset Mgmt | 19.55 | 10 | 0.62% | 0.21% |
| For chart view version of above stock list: Chart View ➞ 0 - 25 , 25 - 50 , 50 - 75 , 75 - 100 , 100 - 125 , 125 - 150 , 150 - 175 , 175 - 200 , 200 - 225 , 225 - 250 , 250 - 275 , 275 - 300 , 300 - 325 , 325 - 350 , 350 - 375 , 375 - 400 , 400 - 425 , 425 - 450 , 450 - 475 , 475 - 500 , 500 - 525 , 525 - 550 , 550 - 575 , 575 - 600 , 600 - 625 , 625 - 650 , 650 - 675 , 675 - 700 , 700 - 725 , 725 - 750 , 750 - 775 , 775 - 800 , 800 - 825 , 825 - 850 , 850 - 875 , 875 - 900 , 900 - 925 , 925 - 950 , 950 - 975 , 975 - 1000 , 1000 - 1025 , 1025 - 1050 , 1050 - 1075 , 1075 - 1100 , 1100 - 1125 , 1125 - 1150 , 1150 - 1175 , 1175 - 1200 , 1200 - 1225 , 1225 - 1250 | ||
 | Click To Change The Sort Order: By Market Cap or Company Size Performance: Year-to-date, Week and Day |  |
|
Get the most comprehensive stock market coverage daily at 12Stocks.com ➞ Best Stocks Today ➞ Best Stocks Weekly ➞ Best Stocks Year-to-Date ➞ Best Stocks Trends ➞  Best Stocks Today 12Stocks.com Best Nasdaq Stocks ➞ Best S&P 500 Stocks ➞ Best Tech Stocks ➞ Best Biotech Stocks ➞ |
| Detailed Overview of Financial Stocks |
| Financial Technical Overview, Leaders & Laggards, Top Financial ETF Funds & Detailed Financial Stocks List, Charts, Trends & More |
| Financial Sector: Technical Analysis, Trends & YTD Performance | |
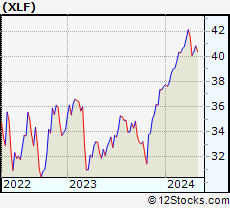
| Financial sector is composed of stocks
from banks, brokers, insurance, REITs
and services subsectors. Financial sector, as represented by XLF, an exchange-traded fund [ETF] that holds basket of Financial stocks (e.g, Bank of America, Goldman Sachs) is up by 5.93% and is currently outperforming the overall market by 1.74% year-to-date. Below is a quick view of Technical charts and trends: |
|
 XLF Weekly Chart |
|
| Long Term Trend: Good | |
| Medium Term Trend: Not Good | |
 XLF Daily Chart |
|
| Short Term Trend: Deteriorating | |
| Overall Trend Score: 56 | |
| YTD Performance: 5.93% | |
| **Trend Scores & Views Are Only For Educational Purposes And Not For Investing | |
| 12Stocks.com: Top Performing Financial Sector Stocks | ||||||||||||||||||||||||||||||||||||||||||||||||
 The top performing Financial sector stocks year to date are
Now, more recently, over last week, the top performing Financial sector stocks on the move are


|
||||||||||||||||||||||||||||||||||||||||||||||||
| 12Stocks.com: Investing in Financial Sector using Exchange Traded Funds | |
|
The following table shows list of key exchange traded funds (ETF) that
help investors track Financial Index. For detailed view, check out our ETF Funds section of our website. Quick View: Move mouse or cursor over ETF symbol (ticker) to view short-term Technical chart and over ETF name to view long term chart. Click on ticker or stock name for detailed view. Click on to add stock symbol to your watchlist and to view watchlist. |
12Stocks.com List of ETFs that track Financial Index
| Ticker | ETF Name | Watchlist | Recent Price | Smart Investing & Trading Score | Change % | Week % | Year-to-date % |
| XLF | Financial | | 39.83 | 56 | 0.35 | -0.57 | 5.93% |
| IAI | Broker-Dealers & Secs | | 110.39 | 56 | 0.04 | -0.4 | 1.71% |
| IYF | Financials | | 90.04 | 48 | 0.61 | -0.56 | 5.42% |
| IYG | Financial Services | | 62.67 | 56 | 0.30 | -0.85 | 4.91% |
| KRE | Regional Banking | | 46.11 | 28 | 0.61 | -0.88 | -12.05% |
| IXG | Global Financials | | 82.50 | 43 | 0.66 | -0.19 | 4.99% |
| VFH | Financials | | 96.40 | 56 | 0.39 | -0.8 | 4.49% |
| KBE | Bank | | 43.40 | 22 | 0.70 | -0.89 | -5.69% |
| FAS | Financial Bull 3X | | 94.14 | 56 | 1.00 | -2.16 | 13.9% |
| FAZ | Financial Bear 3X | | 11.66 | 40 | -0.85 | 2.19 | -14.7% |
| UYG | Financials | | 60.75 | 51 | 0.70 | -1.17 | 10.05% |
| IAT | Regional Banks | | 39.74 | 27 | 0.28 | -1.73 | -5.02% |
| KIE | Insurance | | 48.28 | 51 | 1.17 | -0.08 | 6.77% |
| PSCF | SmallCap Financials | | 44.94 | 22 | 0.18 | -1.03 | -8.62% |
| EUFN | Europe Financials | | 21.86 | 56 | 0.21 | -0.16 | 4.27% |
| PGF | Financial Preferred | | 14.44 | 18 | -0.38 | -1.67 | -0.99% |
| 12Stocks.com: Charts, Trends, Fundamental Data and Performances of Financial Stocks | |
|
We now take in-depth look at all Financial stocks including charts, multi-period performances and overall trends (as measured by Smart Investing & Trading Score). One can sort Financial stocks (click link to choose) by Daily, Weekly and by Year-to-Date performances. Also, one can sort by size of the company or by market capitalization. |
| Select Your Default Chart Type: | |||||
| |||||
| Click on stock symbol or name for detailed view. Click on to add stock symbol to your watchlist and to view watchlist. Quick View: Move mouse or cursor over "Daily" to quickly view daily Technical stock chart and over "Weekly" to view weekly Technical stock chart. | |||||

 | RDN Radian Group Inc. |
| Sector: Financials | |
| SubSector: Property & Casualty Insurance | |
| MarketCap: 2950.12 Millions | |
| Recent Price: 29.29 Smart Investing & Trading Score: 36 | |
| Day Percent Change: -0.14% Day Change: -0.04 | |
| Week Change: -3.17% Year-to-date Change: 2.6% | |
| RDN Links: Profile News Message Board | |
| Charts:- Daily , Weekly | |
| Add RDN to Watchlist: View: Get Complete RDN Trend Analysis ➞ | |
 | BOKF BOK Financial Corporation |
| Sector: Financials | |
| SubSector: Regional - Southwest Banks | |
| MarketCap: 2945.35 Millions | |
| Recent Price: 85.40 Smart Investing & Trading Score: 46 | |
| Day Percent Change: 0.32% Day Change: 0.27 | |
| Week Change: -1.66% Year-to-date Change: -0.3% | |
| BOKF Links: Profile News Message Board | |
| Charts:- Daily , Weekly | |
| Add BOKF to Watchlist: View: Get Complete BOKF Trend Analysis ➞ | |
 | upst Upstart Holdings, Inc. |
| Sector: Financials | |
| SubSector: Credit Services | |
| MarketCap: 2900 Millions | |
| Recent Price: 22.88 Smart Investing & Trading Score: 42 | |
| Day Percent Change: 2.05% Day Change: 0.46 | |
| Week Change: -3.95% Year-to-date Change: -43.5% | |
| upst Links: Profile News Message Board | |
| Charts:- Daily , Weekly | |
| Add upst to Watchlist: View: Get Complete upst Trend Analysis ➞ | |
 | ESGR Enstar Group Limited |
| Sector: Financials | |
| SubSector: Property & Casualty Insurance | |
| MarketCap: 2886.02 Millions | |
| Recent Price: 277.40 Smart Investing & Trading Score: 36 | |
| Day Percent Change: 0.26% Day Change: 0.72 | |
| Week Change: -2.61% Year-to-date Change: -5.8% | |
| ESGR Links: Profile News Message Board | |
| Charts:- Daily , Weekly | |
| Add ESGR to Watchlist: View: Get Complete ESGR Trend Analysis ➞ | |
 | AMG Affiliated Managers Group, Inc. |
| Sector: Financials | |
| SubSector: Asset Management | |
| MarketCap: 2849.63 Millions | |
| Recent Price: 158.19 Smart Investing & Trading Score: 36 | |
| Day Percent Change: -0.45% Day Change: -0.72 | |
| Week Change: -2.45% Year-to-date Change: 4.5% | |
| AMG Links: Profile News Message Board | |
| Charts:- Daily , Weekly | |
| Add AMG to Watchlist: View: Get Complete AMG Trend Analysis ➞ | |
 | VLY Valley National Bancorp |
| Sector: Financials | |
| SubSector: Regional - Northeast Banks | |
| MarketCap: 2843.09 Millions | |
| Recent Price: 7.32 Smart Investing & Trading Score: 20 | |
| Day Percent Change: 1.67% Day Change: 0.12 | |
| Week Change: -0.81% Year-to-date Change: -32.6% | |
| VLY Links: Profile News Message Board | |
| Charts:- Daily , Weekly | |
| Add VLY to Watchlist: View: Get Complete VLY Trend Analysis ➞ | |
 | BXMT Blackstone Mortgage Trust, Inc. |
| Sector: Financials | |
| SubSector: Mortgage Investment | |
| MarketCap: 2820.69 Millions | |
| Recent Price: 18.33 Smart Investing & Trading Score: 32 | |
| Day Percent Change: 0.55% Day Change: 0.10 | |
| Week Change: -1.72% Year-to-date Change: -13.8% | |
| BXMT Links: Profile News Message Board | |
| Charts:- Daily , Weekly | |
| Add BXMT to Watchlist: View: Get Complete BXMT Trend Analysis ➞ | |
 | EHTH eHealth, Inc. |
| Sector: Financials | |
| SubSector: Insurance Brokers | |
| MarketCap: 2813.57 Millions | |
| Recent Price: 4.61 Smart Investing & Trading Score: 42 | |
| Day Percent Change: 6.11% Day Change: 0.27 | |
| Week Change: -5.44% Year-to-date Change: -47.2% | |
| EHTH Links: Profile News Message Board | |
| Charts:- Daily , Weekly | |
| Add EHTH to Watchlist: View: Get Complete EHTH Trend Analysis ➞ | |
 | ESNT Essent Group Ltd. |
| Sector: Financials | |
| SubSector: Mortgage Investment | |
| MarketCap: 2806.19 Millions | |
| Recent Price: 52.67 Smart Investing & Trading Score: 17 | |
| Day Percent Change: 0.65% Day Change: 0.34 | |
| Week Change: -1.84% Year-to-date Change: -0.1% | |
| ESNT Links: Profile News Message Board | |
| Charts:- Daily , Weekly | |
| Add ESNT to Watchlist: View: Get Complete ESNT Trend Analysis ➞ | |
 | FCFS FirstCash, Inc. |
| Sector: Financials | |
| SubSector: Credit Services | |
| MarketCap: 2795.48 Millions | |
| Recent Price: 128.79 Smart Investing & Trading Score: 71 | |
| Day Percent Change: -0.66% Day Change: -0.85 | |
| Week Change: -1.97% Year-to-date Change: 18.8% | |
| FCFS Links: Profile News Message Board | |
| Charts:- Daily , Weekly | |
| Add FCFS to Watchlist: View: Get Complete FCFS Trend Analysis ➞ | |
 | FSV FirstService Corporation |
| Sector: Financials | |
| SubSector: Property Management | |
| MarketCap: 2793.92 Millions | |
| Recent Price: 149.31 Smart Investing & Trading Score: 10 | |
| Day Percent Change: -0.53% Day Change: -0.79 | |
| Week Change: -3.55% Year-to-date Change: -7.9% | |
| FSV Links: Profile News Message Board | |
| Charts:- Daily , Weekly | |
| Add FSV to Watchlist: View: Get Complete FSV Trend Analysis ➞ | |
 | CBU Community Bank System, Inc. |
| Sector: Financials | |
| SubSector: Regional - Midwest Banks | |
| MarketCap: 2787.8 Millions | |
| Recent Price: 42.48 Smart Investing & Trading Score: 27 | |
| Day Percent Change: 2.29% Day Change: 0.95 | |
| Week Change: -1.03% Year-to-date Change: -18.5% | |
| CBU Links: Profile News Message Board | |
| Charts:- Daily , Weekly | |
| Add CBU to Watchlist: View: Get Complete CBU Trend Analysis ➞ | |
 | SF Stifel Financial Corp. |
| Sector: Financials | |
| SubSector: Investment Brokerage - Regional | |
| MarketCap: 2783.65 Millions | |
| Recent Price: 74.88 Smart Investing & Trading Score: 68 | |
| Day Percent Change: 0.63% Day Change: 0.47 | |
| Week Change: 0.48% Year-to-date Change: 8.3% | |
| SF Links: Profile News Message Board | |
| Charts:- Daily , Weekly | |
| Add SF to Watchlist: View: Get Complete SF Trend Analysis ➞ | |
 | PRI Primerica, Inc. |
| Sector: Financials | |
| SubSector: Life Insurance | |
| MarketCap: 2782.06 Millions | |
| Recent Price: 210.09 Smart Investing & Trading Score: 0 | |
| Day Percent Change: -0.73% Day Change: -1.55 | |
| Week Change: -5.4% Year-to-date Change: 2.1% | |
| PRI Links: Profile News Message Board | |
| Charts:- Daily , Weekly | |
| Add PRI to Watchlist: View: Get Complete PRI Trend Analysis ➞ | |
 | PNFP Pinnacle Financial Partners, Inc. |
| Sector: Financials | |
| SubSector: Regional - Southeast Banks | |
| MarketCap: 2771.75 Millions | |
| Recent Price: 78.45 Smart Investing & Trading Score: 10 | |
| Day Percent Change: 0.15% Day Change: 0.12 | |
| Week Change: -1.88% Year-to-date Change: -10.1% | |
| PNFP Links: Profile News Message Board | |
| Charts:- Daily , Weekly | |
| Add PNFP to Watchlist: View: Get Complete PNFP Trend Analysis ➞ | |
 | UNM Unum Group |
| Sector: Financials | |
| SubSector: Accident & Health Insurance | |
| MarketCap: 2760.9 Millions | |
| Recent Price: 50.79 Smart Investing & Trading Score: 58 | |
| Day Percent Change: 1.26% Day Change: 0.63 | |
| Week Change: 0.97% Year-to-date Change: 12.3% | |
| UNM Links: Profile News Message Board | |
| Charts:- Daily , Weekly | |
| Add UNM to Watchlist: View: Get Complete UNM Trend Analysis ➞ | |
 | OMF OneMain Holdings, Inc. |
| Sector: Financials | |
| SubSector: Credit Services | |
| MarketCap: 2753.38 Millions | |
| Recent Price: 47.90 Smart Investing & Trading Score: 63 | |
| Day Percent Change: 1.40% Day Change: 0.66 | |
| Week Change: 2.53% Year-to-date Change: -2.6% | |
| OMF Links: Profile News Message Board | |
| Charts:- Daily , Weekly | |
| Add OMF to Watchlist: View: Get Complete OMF Trend Analysis ➞ | |
 | TREE LendingTree, Inc. |
| Sector: Financials | |
| SubSector: Mortgage Investment | |
| MarketCap: 2745.99 Millions | |
| Recent Price: 34.25 Smart Investing & Trading Score: 56 | |
| Day Percent Change: -0.64% Day Change: -0.22 | |
| Week Change: -8.98% Year-to-date Change: 13.0% | |
| TREE Links: Profile News Message Board | |
| Charts:- Daily , Weekly | |
| Add TREE to Watchlist: View: Get Complete TREE Trend Analysis ➞ | |
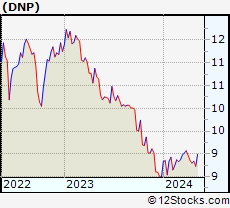 | DNP DNP Select Income Fund Inc. |
| Sector: Financials | |
| SubSector: Closed-End Fund - Equity | |
| MarketCap: 2706.07 Millions | |
| Recent Price: 8.77 Smart Investing & Trading Score: 20 | |
| Day Percent Change: 0.57% Day Change: 0.05 | |
| Week Change: -1.02% Year-to-date Change: 3.4% | |
| DNP Links: Profile News Message Board | |
| Charts:- Daily , Weekly | |
| Add DNP to Watchlist: View: Get Complete DNP Trend Analysis ➞ | |
 | CVBF CVB Financial Corp. |
| Sector: Financials | |
| SubSector: Regional - Pacific Banks | |
| MarketCap: 2699.99 Millions | |
| Recent Price: 15.99 Smart Investing & Trading Score: 35 | |
| Day Percent Change: 0.88% Day Change: 0.14 | |
| Week Change: -1.36% Year-to-date Change: -20.8% | |
| CVBF Links: Profile News Message Board | |
| Charts:- Daily , Weekly | |
| Add CVBF to Watchlist: View: Get Complete CVBF Trend Analysis ➞ | |
 | SNV Synovus Financial Corp. |
| Sector: Financials | |
| SubSector: Regional - Mid-Atlantic Banks | |
| MarketCap: 2697.29 Millions | |
| Recent Price: 33.90 Smart Investing & Trading Score: 0 | |
| Day Percent Change: -7.43% Day Change: -2.72 | |
| Week Change: -7.96% Year-to-date Change: -10.0% | |
| SNV Links: Profile News Message Board | |
| Charts:- Daily , Weekly | |
| Add SNV to Watchlist: View: Get Complete SNV Trend Analysis ➞ | |
 | BPOP Popular, Inc. |
| Sector: Financials | |
| SubSector: Foreign Regional Banks | |
| MarketCap: 2671.99 Millions | |
| Recent Price: 81.81 Smart Investing & Trading Score: 17 | |
| Day Percent Change: 1.16% Day Change: 0.94 | |
| Week Change: -1.14% Year-to-date Change: -0.3% | |
| BPOP Links: Profile News Message Board | |
| Charts:- Daily , Weekly | |
| Add BPOP to Watchlist: View: Get Complete BPOP Trend Analysis ➞ | |
 | FHN First Horizon National Corporation |
| Sector: Financials | |
| SubSector: Regional - Southeast Banks | |
| MarketCap: 2661.05 Millions | |
| Recent Price: 14.28 Smart Investing & Trading Score: 42 | |
| Day Percent Change: 0.78% Day Change: 0.11 | |
| Week Change: 0.56% Year-to-date Change: 0.9% | |
| FHN Links: Profile News Message Board | |
| Charts:- Daily , Weekly | |
| Add FHN to Watchlist: View: Get Complete FHN Trend Analysis ➞ | |
 | CWK Cushman & Wakefield plc |
| Sector: Financials | |
| SubSector: Property Management | |
| MarketCap: 2651.62 Millions | |
| Recent Price: 9.40 Smart Investing & Trading Score: 20 | |
| Day Percent Change: 1.40% Day Change: 0.13 | |
| Week Change: -4.86% Year-to-date Change: -13.0% | |
| CWK Links: Profile News Message Board | |
| Charts:- Daily , Weekly | |
| Add CWK to Watchlist: View: Get Complete CWK Trend Analysis ➞ | |
 | CNNE Cannae Holdings, Inc. |
| Sector: Financials | |
| SubSector: Asset Management | |
| MarketCap: 2625.53 Millions | |
| Recent Price: 19.55 Smart Investing & Trading Score: 10 | |
| Day Percent Change: 0.62% Day Change: 0.12 | |
| Week Change: -3.88% Year-to-date Change: 0.2% | |
| CNNE Links: Profile News Message Board | |
| Charts:- Daily , Weekly | |
| Add CNNE to Watchlist: View: Get Complete CNNE Trend Analysis ➞ | |
| For tabular summary view of above stock list: Summary View ➞ 0 - 25 , 25 - 50 , 50 - 75 , 75 - 100 , 100 - 125 , 125 - 150 , 150 - 175 , 175 - 200 , 200 - 225 , 225 - 250 , 250 - 275 , 275 - 300 , 300 - 325 , 325 - 350 , 350 - 375 , 375 - 400 , 400 - 425 , 425 - 450 , 450 - 475 , 475 - 500 , 500 - 525 , 525 - 550 , 550 - 575 , 575 - 600 , 600 - 625 , 625 - 650 , 650 - 675 , 675 - 700 , 700 - 725 , 725 - 750 , 750 - 775 , 775 - 800 , 800 - 825 , 825 - 850 , 850 - 875 , 875 - 900 , 900 - 925 , 925 - 950 , 950 - 975 , 975 - 1000 , 1000 - 1025 , 1025 - 1050 , 1050 - 1075 , 1075 - 1100 , 1100 - 1125 , 1125 - 1150 , 1150 - 1175 , 1175 - 1200 , 1200 - 1225 , 1225 - 1250 | ||
| Click To Change The Sort Order: By Market Cap or Company Size Performance: Year-to-date, Week and Day | |
| Select Chart Type: | ||
|
Best Stocks Today 12Stocks.com |
© 2024 12Stocks.com Terms & Conditions Privacy Contact Us
All Information Provided Only For Education And Not To Be Used For Investing or Trading. See Terms & Conditions


One More Thing ... Get Best Stocks Delivered Daily!
Never Ever Miss A Move With Our Top Ten Stocks Lists
Find Best Stocks In Any Market - Bull or Bear Market
Take A Peek At Our Top Ten Stocks Lists: Daily, Weekly, Year-to-Date & Top Trends
Find Best Stocks In Any Market - Bull or Bear Market
Take A Peek At Our Top Ten Stocks Lists: Daily, Weekly, Year-to-Date & Top Trends
Financial Stocks With Best Up Trends [0-bearish to 100-bullish]: Medical Properties[100], Macatawa Bank[100], Stellus Capital[100], Regional Management[100], Angel Oak[95], HDFC Bank[93], Charles Schwab[93], Fidus [93], Western Asset[93], BlackRock MuniYield[93], Wells Fargo[90]
Best Financial Stocks Year-to-Date:
Root [389.97%], Hippo [128.32%], Gladstone Capital[93.22%], Banco Macro[68.33%], Grupo Financiero[62.41%], Yiren Digital[55.45%], Fidelis Insurance[53.3%], First [51.11%], Banco BBVA[48.35%], EverQuote [48.28%], Heritage Insurance[45.55%] Best Financial Stocks This Week:
Macatawa Bank[44.53%], Medical Properties[25.06%], Globe Life[10%], James River[8.87%], GoHealth [7.45%], Victory Capital[6.86%], Huize Holding[6.65%], LCNB [5.7%], Bancorp [5.53%], Green Dot[5.25%], ESSA Bancorp[4.85%] Best Financial Stocks Daily:
Cipher Mining[8.65%], Oportun [8.45%], Ally [6.73%], eHealth [6.11%], Coinbase Global[5.90%], James River[5.62%], Tejon Ranch[5.44%], C&F [5.02%], Bank OZK[4.73%], Medical Properties[4.61%], Claros Mortgage[4.52%]