
 Login Sign Up


| |||||
 |  | ||||

| 12Stocks.com Market Intelligence |
Best Financial Stocks
| In a hurry? Financial Stocks Lists: Performance Trends Table, Stock Charts
Sort Financial stocks: Daily, Weekly, Year-to-Date, Market Cap & Trends. Filter Financial stocks list by size:All Financial Large Mid-Range Small & MicroCap |
| 12Stocks.com Financial Stocks Performances & Trends Daily | |||||||||
|
|  The overall Smart Investing & Trading Score is 20 (0-bearish to 100-bullish) which puts Financial sector in short term bearish trend. The Smart Investing & Trading Score from previous trading session is 30 and a deterioration of trend continues.
| ||||||||
Here are the Smart Investing & Trading Scores of the most requested Financial stocks at 12Stocks.com (click stock name for detailed review):
|


| 12Stocks.com: Investing in Financial sector with Stocks | |
|
The following table helps investors and traders sort through current performance and trends (as measured by Smart Investing & Trading Score) of various
stocks in the Financial sector. Quick View: Move mouse or cursor over stock symbol (ticker) to view short-term Technical chart and over stock name to view long term chart. Click on  to add stock symbol to your watchlist and to add stock symbol to your watchlist and  to view watchlist. Click on any ticker or stock name for detailed market intelligence report for that stock. to view watchlist. Click on any ticker or stock name for detailed market intelligence report for that stock. |
12Stocks.com Performance of Stocks in Financial Sector
| Ticker | Stock Name | Watchlist | Category | Recent Price | Trend Score | Change % | YTD Change% |
| MFA | MFA |   | REIT - Mortgage | 9.21 | 50 | -0.86% | -3.08% |
| RNP | Cohen & Steers REIT & Preferred & ome Fund | | Closed-End Fund - Debt | 22.15 | 20 | -0.94% | 12.09% |
| CTBI | Community Trust | | Banks - Regional | 55.08 | 10 | 0.24% | 7.99% |
| OCFC | OceanFirst | | Banks - Regional | 17.65 | 50 | 1.67% | 2.59% |
| DEA | Easterly Government | | REIT - Office | 22.55 | 30 | -0.62% | -18.78% |
| BRMK | Broadmark Realty | | Mortgage | 4.82 | 30 | 0.00% | 0.00% |
| NYMT | New York | | Mortgage | 7.11 | 80 | -1.52% | 23.16% |
| FCH | FelCor Lodging | | REIT | 77.44 | 80 | 1.56% | 0.00% |
| BTZ | BlackRock Credit | | Closed-End Fund - Debt | 11.00 | 20 | -0.27% | 10.74% |
| ATLC | Atlanticus | | Credit Services | 56.31 | 10 | -3.01% | 2.68% |
| ECPG | Encore Capital | | Credit Services | 41.33 | 20 | 1.80% | -12.06% |
| BBN | BlackRock Taxable | | Closed-End Fund - Debt | 16.62 | 70 | -0.42% | 7.43% |
| STBZ | State Bank | | Banks | 11.30 | 50 | 0.80% | 0.00% |
| PJC | Piper Jaffray | | Brokerage | 80.29 | 20 | 0.30% | 0.00% |
| EZPW | EZCorp | | Credit Services | 18.12 | 50 | -0.06% | 49.51% |
| PFLT | PennantPark Floating | | Asset Mgmt | 8.87 | 30 | 1.84% | -13.59% |
| BCSF | Bain Capital | | Asset Mgmt | 14.19 | 10 | 1.36% | -14.50% |
| TMP | Tompkins | | Banks - Regional | 65.46 | 10 | 0.15% | 0.93% |
| PLYM | Plymouth Industrial | | REIT - Industrial | 22.19 | 80 | 0.18% | 32.01% |
| CFNL | Cardinal | | Regional Banks | 45.26 | 100 | 0.56% | 0.00% |
| CGBD | Carlyle Secured | | Asset Mgmt | 12.71 | 30 | 2.42% | -25.75% |
| FFG | FBL | | Life Insurance | 4.41 | 20 | 0.00% | 0.00% |
| EIG | Employers | | Insurance - Specialty | 42.16 | 50 | -0.43% | -15.39% |
| DHC | Diversified Healthcare | | REIT | 4.38 | 40 | -0.45% | 95.27% |
| PKY | Parkway | | REIT - Office | 76.33 | 80 | -0.26% | 0.00% |
| For chart view version of above stock list: Chart View ➞ 0 - 25 , 25 - 50 , 50 - 75 , 75 - 100 , 100 - 125 , 125 - 150 , 150 - 175 , 175 - 200 , 200 - 225 , 225 - 250 , 250 - 275 , 275 - 300 , 300 - 325 , 325 - 350 , 350 - 375 , 375 - 400 , 400 - 425 , 425 - 450 , 450 - 475 , 475 - 500 , 500 - 525 , 525 - 550 , 550 - 575 , 575 - 600 , 600 - 625 , 625 - 650 , 650 - 675 , 675 - 700 , 700 - 725 , 725 - 750 , 750 - 775 , 775 - 800 , 800 - 825 , 825 - 850 , 850 - 875 , 875 - 900 , 900 - 925 , 925 - 950 , 950 - 975 , 975 - 1000 , 1000 - 1025 , 1025 - 1050 , 1050 - 1075 , 1075 - 1100 , 1100 - 1125 , 1125 - 1150 , 1150 - 1175 , 1175 - 1200 , 1200 - 1225 , 1225 - 1250 , 1250 - 1275 , 1275 - 1300 , 1300 - 1325 , 1325 - 1350 , 1350 - 1375 , 1375 - 1400 , 1400 - 1425 , 1425 - 1450 , 1450 - 1475 , 1475 - 1500 , 1500 - 1525 , 1525 - 1550 | ||
 | Click To Change The Sort Order: By Market Cap or Company Size Performance: Year-to-date, Week and Day |  |
|
Get the most comprehensive stock market coverage daily at 12Stocks.com ➞ Best Stocks Today ➞ Best Stocks Weekly ➞ Best Stocks Year-to-Date ➞ Best Stocks Trends ➞  Best Stocks Today 12Stocks.com Best Nasdaq Stocks ➞ Best S&P 500 Stocks ➞ Best Tech Stocks ➞ Best Biotech Stocks ➞ |
| Detailed Overview of Financial Stocks |
| Financial Technical Overview, Leaders & Laggards, Top Financial ETF Funds & Detailed Financial Stocks List, Charts, Trends & More |
| Financial Sector: Technical Analysis, Trends & YTD Performance | |
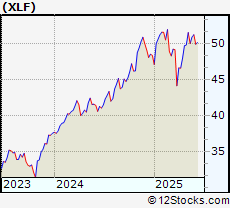
| Financial sector is composed of stocks
from banks, brokers, insurance, REITs
and services subsectors. Financial sector, as represented by XLF, an exchange-traded fund [ETF] that holds basket of Financial stocks (e.g, Bank of America, Goldman Sachs) is up by 11.4442% and is currently underperforming the overall market by -3.3137% year-to-date. Below is a quick view of Technical charts and trends: |
|
 XLF Weekly Chart |
|
| Long Term Trend: Good | |
| Medium Term Trend: Not Good | |
 XLF Daily Chart |
|
| Short Term Trend: Not Good | |
| Overall Trend Score: 20 | |
| YTD Performance: 11.4442% | |
| **Trend Scores & Views Are Only For Educational Purposes And Not For Investing | |
| 12Stocks.com: Top Performing Financial Sector Stocks | |||||||||||||||||||||||||||||||||||||||||||||||
 The top performing Financial sector stocks year to date are
Now, more recently, over last week, the top performing Financial sector stocks on the move are


|
|||||||||||||||||||||||||||||||||||||||||||||||
| 12Stocks.com: Investing in Financial Sector using Exchange Traded Funds | |
|
The following table shows list of key exchange traded funds (ETF) that
help investors track Financial Index. For detailed view, check out our ETF Funds section of our website. Quick View: Move mouse or cursor over ETF symbol (ticker) to view short-term Technical chart and over ETF name to view long term chart. Click on ticker or stock name for detailed view. Click on to add stock symbol to your watchlist and to view watchlist. |
12Stocks.com List of ETFs that track Financial Index
| Ticker | ETF Name | Watchlist | Recent Price | Smart Investing & Trading Score | Change % | Week % | Year-to-date % |
| CHIX | China Financials | | 10.57 | 20 | 0 | 0 | 0% |
| 12Stocks.com: Charts, Trends, Fundamental Data and Performances of Financial Stocks | |
|
We now take in-depth look at all Financial stocks including charts, multi-period performances and overall trends (as measured by Smart Investing & Trading Score). One can sort Financial stocks (click link to choose) by Daily, Weekly and by Year-to-Date performances. Also, one can sort by size of the company or by market capitalization. |
| Select Your Default Chart Type: | |||||
| |||||
| Click on stock symbol or name for detailed view. Click on to add stock symbol to your watchlist and to view watchlist. Quick View: Move mouse or cursor over "Daily" to quickly view daily Technical stock chart and over "Weekly" to view weekly Technical stock chart. | |||||

 | MFA MFA Financial Inc |
| Sector: Financials | |
| SubSector: REIT - Mortgage | |
| MarketCap: 1067.75 Millions | |
| Recent Price: 9.21 Smart Investing & Trading Score: 50 | |
| Day Percent Change: -0.861141% Day Change: -0.18 | |
| Week Change: -4.55959% Year-to-date Change: -3.1% | |
| MFA Links: Profile News Message Board | |
| Charts:- Daily , Weekly | |
| Add MFA to Watchlist: View: Get Complete MFA Trend Analysis ➞ | |
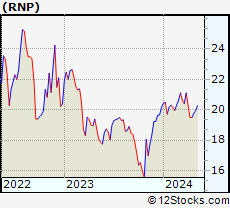 | RNP Cohen & Steers REIT & Preferred & Income Fund Inc |
| Sector: Financials | |
| SubSector: Closed-End Fund - Debt | |
| MarketCap: 1064.51 Millions | |
| Recent Price: 22.15 Smart Investing & Trading Score: 20 | |
| Day Percent Change: -0.939177% Day Change: -0.1 | |
| Week Change: -0.0451264% Year-to-date Change: 12.1% | |
| RNP Links: Profile News Message Board | |
| Charts:- Daily , Weekly | |
| Add RNP to Watchlist: View: Get Complete RNP Trend Analysis ➞ | |
 | CTBI Community Trust Bancorp, Inc |
| Sector: Financials | |
| SubSector: Banks - Regional | |
| MarketCap: 1057.11 Millions | |
| Recent Price: 55.08 Smart Investing & Trading Score: 10 | |
| Day Percent Change: 0.236579% Day Change: -0.33 | |
| Week Change: -1.81818% Year-to-date Change: 8.0% | |
| CTBI Links: Profile News Message Board | |
| Charts:- Daily , Weekly | |
| Add CTBI to Watchlist: View: Get Complete CTBI Trend Analysis ➞ | |
 | OCFC OceanFirst Financial Corp |
| Sector: Financials | |
| SubSector: Banks - Regional | |
| MarketCap: 1052.45 Millions | |
| Recent Price: 17.65 Smart Investing & Trading Score: 50 | |
| Day Percent Change: 1.67051% Day Change: -0.13 | |
| Week Change: -1.88994% Year-to-date Change: 2.6% | |
| OCFC Links: Profile News Message Board | |
| Charts:- Daily , Weekly | |
| Add OCFC to Watchlist: View: Get Complete OCFC Trend Analysis ➞ | |
 | DEA Easterly Government Properties Inc |
| Sector: Financials | |
| SubSector: REIT - Office | |
| MarketCap: 1052.22 Millions | |
| Recent Price: 22.55 Smart Investing & Trading Score: 30 | |
| Day Percent Change: -0.617012% Day Change: -0.03 | |
| Week Change: -0.791905% Year-to-date Change: -18.8% | |
| DEA Links: Profile News Message Board | |
| Charts:- Daily , Weekly | |
| Add DEA to Watchlist: View: Get Complete DEA Trend Analysis ➞ | |
 | BRMK Broadmark Realty Capital Inc. |
| Sector: Financials | |
| SubSector: Mortgage Investment | |
| MarketCap: 1051.09 Millions | |
| Recent Price: 4.82 Smart Investing & Trading Score: 30 | |
| Day Percent Change: 0% Day Change: -9999 | |
| Week Change: 0% Year-to-date Change: 0.0% | |
| BRMK Links: Profile News Message Board | |
| Charts:- Daily , Weekly | |
| Add BRMK to Watchlist: View: Get Complete BRMK Trend Analysis ➞ | |
 | NYMT New York Mortgage Trust, Inc. |
| Sector: Financials | |
| SubSector: Mortgage Investment | |
| MarketCap: 1038.39 Millions | |
| Recent Price: 7.11 Smart Investing & Trading Score: 80 | |
| Day Percent Change: -1.52355% Day Change: -0.14 | |
| Week Change: -0.420168% Year-to-date Change: 23.2% | |
| NYMT Links: Profile News Message Board | |
| Charts:- Daily , Weekly | |
| Add NYMT to Watchlist: View: Get Complete NYMT Trend Analysis ➞ | |
 | FCH FelCor Lodging Trust Incorporated |
| Sector: Financials | |
| SubSector: REIT - Hotel/Motel | |
| MarketCap: 1034.73 Millions | |
| Recent Price: 77.44 Smart Investing & Trading Score: 80 | |
| Day Percent Change: 1.56066% Day Change: -9999 | |
| Week Change: 56.3181% Year-to-date Change: 0.0% | |
| FCH Links: Profile News Message Board | |
| Charts:- Daily , Weekly | |
| Add FCH to Watchlist: View: Get Complete FCH Trend Analysis ➞ | |
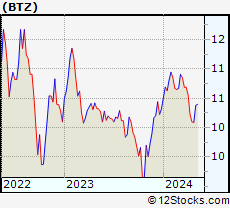 | BTZ BlackRock Credit Allocation Income Trust |
| Sector: Financials | |
| SubSector: Closed-End Fund - Debt | |
| MarketCap: 1033.1 Millions | |
| Recent Price: 11.00 Smart Investing & Trading Score: 20 | |
| Day Percent Change: -0.271986% Day Change: -0.05 | |
| Week Change: -0.0908265% Year-to-date Change: 10.7% | |
| BTZ Links: Profile News Message Board | |
| Charts:- Daily , Weekly | |
| Add BTZ to Watchlist: View: Get Complete BTZ Trend Analysis ➞ | |
 | ATLC Atlanticus Holdings Corp |
| Sector: Financials | |
| SubSector: Credit Services | |
| MarketCap: 1026.11 Millions | |
| Recent Price: 56.31 Smart Investing & Trading Score: 10 | |
| Day Percent Change: -3.01412% Day Change: -0.69 | |
| Week Change: -15.6404% Year-to-date Change: 2.7% | |
| ATLC Links: Profile News Message Board | |
| Charts:- Daily , Weekly | |
| Add ATLC to Watchlist: View: Get Complete ATLC Trend Analysis ➞ | |
 | ECPG Encore Capital Group, Inc |
| Sector: Financials | |
| SubSector: Credit Services | |
| MarketCap: 1022.87 Millions | |
| Recent Price: 41.33 Smart Investing & Trading Score: 20 | |
| Day Percent Change: 1.79803% Day Change: -0.81 | |
| Week Change: -4.30655% Year-to-date Change: -12.1% | |
| ECPG Links: Profile News Message Board | |
| Charts:- Daily , Weekly | |
| Add ECPG to Watchlist: View: Get Complete ECPG Trend Analysis ➞ | |
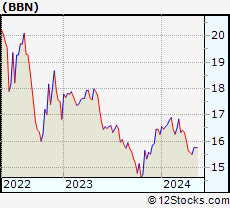 | BBN BlackRock Taxable Municipal Bond Trust |
| Sector: Financials | |
| SubSector: Closed-End Fund - Debt | |
| MarketCap: 1022.67 Millions | |
| Recent Price: 16.62 Smart Investing & Trading Score: 70 | |
| Day Percent Change: -0.419413% Day Change: -0.07 | |
| Week Change: 1.15642% Year-to-date Change: 7.4% | |
| BBN Links: Profile News Message Board | |
| Charts:- Daily , Weekly | |
| Add BBN to Watchlist: View: Get Complete BBN Trend Analysis ➞ | |
 | STBZ State Bank Financial Corporation |
| Sector: Financials | |
| SubSector: Money Center Banks | |
| MarketCap: 1021.84 Millions | |
| Recent Price: 11.30 Smart Investing & Trading Score: 50 | |
| Day Percent Change: 0.802855% Day Change: -9999 | |
| Week Change: 18.3246% Year-to-date Change: 0.0% | |
| STBZ Links: Profile News Message Board | |
| Charts:- Daily , Weekly | |
| Add STBZ to Watchlist: View: Get Complete STBZ Trend Analysis ➞ | |
 | PJC Piper Jaffray Companies |
| Sector: Financials | |
| SubSector: Investment Brokerage - Regional | |
| MarketCap: 1019.93 Millions | |
| Recent Price: 80.29 Smart Investing & Trading Score: 20 | |
| Day Percent Change: 0.299813% Day Change: -9999 | |
| Week Change: -2.96108% Year-to-date Change: 0.0% | |
| PJC Links: Profile News Message Board | |
| Charts:- Daily , Weekly | |
| Add PJC to Watchlist: View: Get Complete PJC Trend Analysis ➞ | |
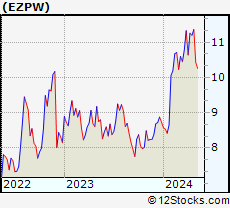 | EZPW EZCorp, Inc |
| Sector: Financials | |
| SubSector: Credit Services | |
| MarketCap: 1018.79 Millions | |
| Recent Price: 18.12 Smart Investing & Trading Score: 50 | |
| Day Percent Change: -0.0551572% Day Change: 0.21 | |
| Week Change: 0.165837% Year-to-date Change: 49.5% | |
| EZPW Links: Profile News Message Board | |
| Charts:- Daily , Weekly | |
| Add EZPW to Watchlist: View: Get Complete EZPW Trend Analysis ➞ | |
 | PFLT PennantPark Floating Rate Capital Ltd |
| Sector: Financials | |
| SubSector: Asset Management | |
| MarketCap: 1017.98 Millions | |
| Recent Price: 8.87 Smart Investing & Trading Score: 30 | |
| Day Percent Change: 1.83697% Day Change: -0.04 | |
| Week Change: -6.23679% Year-to-date Change: -13.6% | |
| PFLT Links: Profile News Message Board | |
| Charts:- Daily , Weekly | |
| Add PFLT to Watchlist: View: Get Complete PFLT Trend Analysis ➞ | |
 | BCSF Bain Capital Specialty Finance Inc |
| Sector: Financials | |
| SubSector: Asset Management | |
| MarketCap: 1016.49 Millions | |
| Recent Price: 14.19 Smart Investing & Trading Score: 10 | |
| Day Percent Change: 1.35714% Day Change: -0.02 | |
| Week Change: -1.59501% Year-to-date Change: -14.5% | |
| BCSF Links: Profile News Message Board | |
| Charts:- Daily , Weekly | |
| Add BCSF to Watchlist: View: Get Complete BCSF Trend Analysis ➞ | |
 | TMP Tompkins Financial Corp |
| Sector: Financials | |
| SubSector: Banks - Regional | |
| MarketCap: 1009.06 Millions | |
| Recent Price: 65.46 Smart Investing & Trading Score: 10 | |
| Day Percent Change: 0.152999% Day Change: 0.09 | |
| Week Change: -4.84082% Year-to-date Change: 0.9% | |
| TMP Links: Profile News Message Board | |
| Charts:- Daily , Weekly | |
| Add TMP to Watchlist: View: Get Complete TMP Trend Analysis ➞ | |
 | PLYM Plymouth Industrial Reit Inc |
| Sector: Financials | |
| SubSector: REIT - Industrial | |
| MarketCap: 1008.99 Millions | |
| Recent Price: 22.19 Smart Investing & Trading Score: 80 | |
| Day Percent Change: 0.180587% Day Change: 0.04 | |
| Week Change: 1.09339% Year-to-date Change: 32.0% | |
| PLYM Links: Profile News Message Board | |
| Charts:- Daily , Weekly | |
| Add PLYM to Watchlist: View: Get Complete PLYM Trend Analysis ➞ | |
 | CFNL Cardinal Financial Corporation |
| Sector: Financials | |
| SubSector: Regional - Southeast Banks | |
| MarketCap: 1007.02 Millions | |
| Recent Price: 45.26 Smart Investing & Trading Score: 100 | |
| Day Percent Change: 0.555432% Day Change: -9999 | |
| Week Change: 143.072% Year-to-date Change: 0.0% | |
| CFNL Links: Profile News Message Board | |
| Charts:- Daily , Weekly | |
| Add CFNL to Watchlist: View: Get Complete CFNL Trend Analysis ➞ | |
 | CGBD Carlyle Secured Lending Inc |
| Sector: Financials | |
| SubSector: Asset Management | |
| MarketCap: 1005.33 Millions | |
| Recent Price: 12.71 Smart Investing & Trading Score: 30 | |
| Day Percent Change: 2.41741% Day Change: -0.01 | |
| Week Change: -2.60536% Year-to-date Change: -25.8% | |
| CGBD Links: Profile News Message Board | |
| Charts:- Daily , Weekly | |
| Add CGBD to Watchlist: View: Get Complete CGBD Trend Analysis ➞ | |
 | FFG FBL Financial Group, Inc. |
| Sector: Financials | |
| SubSector: Life Insurance | |
| MarketCap: 1002.86 Millions | |
| Recent Price: 4.41 Smart Investing & Trading Score: 20 | |
| Day Percent Change: 0% Day Change: -9999 | |
| Week Change: -92.7693% Year-to-date Change: 0.0% | |
| FFG Links: Profile News Message Board | |
| Charts:- Daily , Weekly | |
| Add FFG to Watchlist: View: Get Complete FFG Trend Analysis ➞ | |
 | EIG Employers Holdings Inc |
| Sector: Financials | |
| SubSector: Insurance - Specialty | |
| MarketCap: 1001.12 Millions | |
| Recent Price: 42.16 Smart Investing & Trading Score: 50 | |
| Day Percent Change: -0.42513% Day Change: 0.34 | |
| Week Change: 0.142518% Year-to-date Change: -15.4% | |
| EIG Links: Profile News Message Board | |
| Charts:- Daily , Weekly | |
| Add EIG to Watchlist: View: Get Complete EIG Trend Analysis ➞ | |
 | DHC Diversified Healthcare Trust |
| Sector: Financials | |
| SubSector: REIT - Healthcare Facilities | |
| MarketCap: 994.63 Millions | |
| Recent Price: 4.38 Smart Investing & Trading Score: 40 | |
| Day Percent Change: -0.454545% Day Change: 0 | |
| Week Change: -0.904977% Year-to-date Change: 95.3% | |
| DHC Links: Profile News Message Board | |
| Charts:- Daily , Weekly | |
| Add DHC to Watchlist: View: Get Complete DHC Trend Analysis ➞ | |
 | PKY Parkway, Inc. |
| Sector: Financials | |
| SubSector: REIT - Office | |
| MarketCap: 992.44 Millions | |
| Recent Price: 76.33 Smart Investing & Trading Score: 80 | |
| Day Percent Change: -0.261335% Day Change: -9999 | |
| Week Change: 203.258% Year-to-date Change: 0.0% | |
| PKY Links: Profile News Message Board | |
| Charts:- Daily , Weekly | |
| Add PKY to Watchlist: View: Get Complete PKY Trend Analysis ➞ | |
| For tabular summary view of above stock list: Summary View ➞ 0 - 25 , 25 - 50 , 50 - 75 , 75 - 100 , 100 - 125 , 125 - 150 , 150 - 175 , 175 - 200 , 200 - 225 , 225 - 250 , 250 - 275 , 275 - 300 , 300 - 325 , 325 - 350 , 350 - 375 , 375 - 400 , 400 - 425 , 425 - 450 , 450 - 475 , 475 - 500 , 500 - 525 , 525 - 550 , 550 - 575 , 575 - 600 , 600 - 625 , 625 - 650 , 650 - 675 , 675 - 700 , 700 - 725 , 725 - 750 , 750 - 775 , 775 - 800 , 800 - 825 , 825 - 850 , 850 - 875 , 875 - 900 , 900 - 925 , 925 - 950 , 950 - 975 , 975 - 1000 , 1000 - 1025 , 1025 - 1050 , 1050 - 1075 , 1075 - 1100 , 1100 - 1125 , 1125 - 1150 , 1150 - 1175 , 1175 - 1200 , 1200 - 1225 , 1225 - 1250 , 1250 - 1275 , 1275 - 1300 , 1300 - 1325 , 1325 - 1350 , 1350 - 1375 , 1375 - 1400 , 1400 - 1425 , 1425 - 1450 , 1450 - 1475 , 1475 - 1500 , 1500 - 1525 , 1525 - 1550 | ||
| Click To Change The Sort Order: By Market Cap or Company Size Performance: Year-to-date, Week and Day | |
| Select Chart Type: | ||
|
Best Stocks Today 12Stocks.com |
© 2025 12Stocks.com Terms & Conditions Privacy Contact Us
All Information Provided Only For Education And Not To Be Used For Investing or Trading. See Terms & Conditions


One More Thing ... Get Best Stocks Delivered Daily!
Never Ever Miss A Move With Our Top Ten Stocks Lists
Find Best Stocks In Any Market - Bull or Bear Market
Take A Peek At Our Top Ten Stocks Lists: Daily, Weekly, Year-to-Date & Top Trends
Find Best Stocks In Any Market - Bull or Bear Market
Take A Peek At Our Top Ten Stocks Lists: Daily, Weekly, Year-to-Date & Top Trends
Financial Stocks With Best Up Trends [0-bearish to 100-bullish]: PIMCO California[100], Torchmark [100], PIMCO California[100], Triumph Bancorp[100], Cipher Mining[100], Lufax Holding[100], PIMCO Municipal[100], PIMCO Municipal[100], Front Yard[100], National General[100], Fifth Street[100]
Best Financial Stocks Year-to-Date:
Insight Select[12384.6%], Better Home[523.632%], IREN [363.5%], Global Medical[353.709%], Oxford Lane[287.756%], Robinhood Markets[269.422%], Metalpha Technology[225.664%], Cipher Mining[185.3%], Banco Santander[131.403%], Mr. Cooper[124.245%], Altisource Portfolio[121.195%] Best Financial Stocks This Week:
Colony Starwood[15929900%], Blackhawk Network[91300%], Macquarie Global[81662.9%], Credit Suisse[63241.6%], Pennsylvania Real[23823%], First Republic[22570.9%], Select ome[14000%], CorEnergy Infrastructure[6797.78%], FedNat Holding[5525%], BlackRock Municipal[5340%], BlackRock MuniYield[3379.04%] Best Financial Stocks Daily:
PIMCO California[11.9545%], Torchmark [11.8363%], PIMCO California[11.4754%], BlackRock Muni[10.8108%], Blackrock MuniYield[10.72%], Triumph Bancorp[10.2661%], Cipher Mining[9.36508%], AMBAC [8.24108%], BlackRock MuniYield[8.15348%], Summit [7.79817%], Concord Acquisition[7.63431%]