
 Login Sign Up


| |||||
 |  | ||||

| 12Stocks.com Market Intelligence |
Best Financial Stocks
| In a hurry? Financial Stocks Lists: Performance Trends Table, Stock Charts
Sort Financial stocks: Daily, Weekly, Year-to-Date, Market Cap & Trends. Filter Financial stocks list by size:All Financial Large Mid-Range Small & MicroCap |
| 12Stocks.com Financial Stocks Performances & Trends Daily | |||||||||
|
|  The overall Smart Investing & Trading Score is 20 (0-bearish to 100-bullish) which puts Financial sector in short term bearish trend. The Smart Investing & Trading Score from previous trading session is 30 and a deterioration of trend continues.
| ||||||||
Here are the Smart Investing & Trading Scores of the most requested Financial stocks at 12Stocks.com (click stock name for detailed review):
|


| 12Stocks.com: Investing in Financial sector with Stocks | |
|
The following table helps investors and traders sort through current performance and trends (as measured by Smart Investing & Trading Score) of various
stocks in the Financial sector. Quick View: Move mouse or cursor over stock symbol (ticker) to view short-term Technical chart and over stock name to view long term chart. Click on  to add stock symbol to your watchlist and to add stock symbol to your watchlist and  to view watchlist. Click on any ticker or stock name for detailed market intelligence report for that stock. to view watchlist. Click on any ticker or stock name for detailed market intelligence report for that stock. |
12Stocks.com Performance of Stocks in Financial Sector
| Ticker | Stock Name | Watchlist | Category | Recent Price | Trend Score | Change % | YTD Change% |
| NTST | Netstreit Corp |   | REIT - Retail | 18.39 | 80 | 0.60% | 35.57% |
| JBGS | JBG SMITH | | REIT - Office | 21.82 | 40 | -1.04% | 44.21% |
| OMAM | OM Asset | | Asset Mgmt | 15.35 | 10 | 0.00% | 0.00% |
| NGHC | National General | | Insurance | 100.10 | 50 | -0.93% | 0.00% |
| MORE | Monogram Residential | | REIT | 4.27 | 0 | 2.89% | 0.00% |
| RQI | Cohen & Steers Quality ome Realty Fund | | Closed-End Fund - Equity | 12.43 | 30 | -0.56% | 7.25% |
| NGHCP | National General | | Insurance | 40.49 | 50 | -0.37% | 0.00% |
| LTC | LTC Properties | | REIT | 36.45 | 50 | -1.57% | 11.26% |
| DX | Dynex Capital | | REIT - Mortgage | 12.66 | 80 | 1.44% | 10.05% |
| ATCO | Atlas | | Asset Mgmt | 15.48 | 20 | 0.00% | 0.00% |
| OXLC | Oxford Lane | | Closed-End Fund - Debt | 17.24 | 70 | 0.47% | 287.76% |
| NYRT | New York | | REIT - Office | 60.63 | 60 | -0.70% | 0.00% |
| NAC | Nuveen California | | Closed-End Fund - Debt | 11.57 | 100 | -0.26% | 6.04% |
| ECAT | BlackRock ESG | | Closed-End Fund - Equity | 16.54 | 60 | -0.12% | 14.97% |
| ETV | Eaton Vance | | Closed-End Fund - Equity | 14.30 | 90 | 0.35% | 5.91% |
| BLX | Banco Latinoamericano | | Banks - Regional | 45.00 | 10 | -1.27% | 30.60% |
| GTY | Getty Realty | | REIT - Retail | 26.83 | 40 | -0.74% | -6.33% |
| NSM | Nationstar Mortgage | | Mortgage | 45.59 | 10 | 0.46% | 0.00% |
| IIPR | Innovative Industrial | | REIT - Industrial | 56.64 | 70 | 2.50% | -10.93% |
| NAVG | Navigators | | Insurance | 3.54 | 70 | 1.14% | 0.00% |
| BDJ | BlackRock Enhanced | | Closed-End Fund - Equity | 9.14 | 90 | 0.22% | 15.96% |
| GAM | General American | | Closed-End Fund - Equity | 62.26 | 60 | -0.03% | 22.95% |
| UCBI | United Community | | Regional Banks | 74.00 | 80 | -0.07% | 0.00% |
| ETG | Eaton Vance | | Closed-End Fund - Equity | 21.39 | 90 | 0.47% | 22.89% |
| BCAT | BlackRock Capital | | Closed-End Fund - Equity | 14.89 | 60 | -0.40% | 11.70% |
| For chart view version of above stock list: Chart View ➞ 0 - 25 , 25 - 50 , 50 - 75 , 75 - 100 , 100 - 125 , 125 - 150 , 150 - 175 , 175 - 200 , 200 - 225 , 225 - 250 , 250 - 275 , 275 - 300 , 300 - 325 , 325 - 350 , 350 - 375 , 375 - 400 , 400 - 425 , 425 - 450 , 450 - 475 , 475 - 500 , 500 - 525 , 525 - 550 , 550 - 575 , 575 - 600 , 600 - 625 , 625 - 650 , 650 - 675 , 675 - 700 , 700 - 725 , 725 - 750 , 750 - 775 , 775 - 800 , 800 - 825 , 825 - 850 , 850 - 875 , 875 - 900 , 900 - 925 , 925 - 950 , 950 - 975 , 975 - 1000 , 1000 - 1025 , 1025 - 1050 , 1050 - 1075 , 1075 - 1100 , 1100 - 1125 , 1125 - 1150 , 1150 - 1175 , 1175 - 1200 , 1200 - 1225 , 1225 - 1250 , 1250 - 1275 , 1275 - 1300 , 1300 - 1325 , 1325 - 1350 , 1350 - 1375 , 1375 - 1400 , 1400 - 1425 , 1425 - 1450 , 1450 - 1475 , 1475 - 1500 , 1500 - 1525 , 1525 - 1550 | ||
 | Click To Change The Sort Order: By Market Cap or Company Size Performance: Year-to-date, Week and Day |  |
|
Get the most comprehensive stock market coverage daily at 12Stocks.com ➞ Best Stocks Today ➞ Best Stocks Weekly ➞ Best Stocks Year-to-Date ➞ Best Stocks Trends ➞  Best Stocks Today 12Stocks.com Best Nasdaq Stocks ➞ Best S&P 500 Stocks ➞ Best Tech Stocks ➞ Best Biotech Stocks ➞ |
| Detailed Overview of Financial Stocks |
| Financial Technical Overview, Leaders & Laggards, Top Financial ETF Funds & Detailed Financial Stocks List, Charts, Trends & More |
| Financial Sector: Technical Analysis, Trends & YTD Performance | |
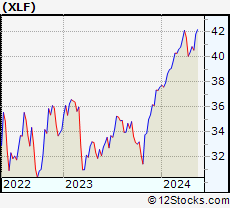
| Financial sector is composed of stocks
from banks, brokers, insurance, REITs
and services subsectors. Financial sector, as represented by XLF, an exchange-traded fund [ETF] that holds basket of Financial stocks (e.g, Bank of America, Goldman Sachs) is up by 11.4442% and is currently underperforming the overall market by -3.3137% year-to-date. Below is a quick view of Technical charts and trends: |
|
 XLF Weekly Chart |
|
| Long Term Trend: Good | |
| Medium Term Trend: Not Good | |
 XLF Daily Chart |
|
| Short Term Trend: Not Good | |
| Overall Trend Score: 20 | |
| YTD Performance: 11.4442% | |
| **Trend Scores & Views Are Only For Educational Purposes And Not For Investing | |
| 12Stocks.com: Top Performing Financial Sector Stocks | |||||||||||||||||||||||||||||||||||||||||||||||
 The top performing Financial sector stocks year to date are
Now, more recently, over last week, the top performing Financial sector stocks on the move are


|
|||||||||||||||||||||||||||||||||||||||||||||||
| 12Stocks.com: Investing in Financial Sector using Exchange Traded Funds | |
|
The following table shows list of key exchange traded funds (ETF) that
help investors track Financial Index. For detailed view, check out our ETF Funds section of our website. Quick View: Move mouse or cursor over ETF symbol (ticker) to view short-term Technical chart and over ETF name to view long term chart. Click on ticker or stock name for detailed view. Click on to add stock symbol to your watchlist and to view watchlist. |
12Stocks.com List of ETFs that track Financial Index
| Ticker | ETF Name | Watchlist | Recent Price | Smart Investing & Trading Score | Change % | Week % | Year-to-date % |
| CHIX | China Financials | | 10.57 | 20 | 0 | 0 | 0% |
| 12Stocks.com: Charts, Trends, Fundamental Data and Performances of Financial Stocks | |
|
We now take in-depth look at all Financial stocks including charts, multi-period performances and overall trends (as measured by Smart Investing & Trading Score). One can sort Financial stocks (click link to choose) by Daily, Weekly and by Year-to-Date performances. Also, one can sort by size of the company or by market capitalization. |
| Select Your Default Chart Type: | |||||
| |||||
| Click on stock symbol or name for detailed view. Click on to add stock symbol to your watchlist and to view watchlist. Quick View: Move mouse or cursor over "Daily" to quickly view daily Technical stock chart and over "Weekly" to view weekly Technical stock chart. | |||||

 | NTST Netstreit Corp |
| Sector: Financials | |
| SubSector: REIT - Retail | |
| MarketCap: 1730.74 Millions | |
| Recent Price: 18.39 Smart Investing & Trading Score: 80 | |
| Day Percent Change: 0.601751% Day Change: -0.08 | |
| Week Change: 5.08571% Year-to-date Change: 35.6% | |
| NTST Links: Profile News Message Board | |
| Charts:- Daily , Weekly | |
| Add NTST to Watchlist: View: Get Complete NTST Trend Analysis ➞ | |
 | JBGS JBG SMITH Properties |
| Sector: Financials | |
| SubSector: REIT - Office | |
| MarketCap: 1723.49 Millions | |
| Recent Price: 21.82 Smart Investing & Trading Score: 40 | |
| Day Percent Change: -1.04308% Day Change: -0.48 | |
| Week Change: -4.38212% Year-to-date Change: 44.2% | |
| JBGS Links: Profile News Message Board | |
| Charts:- Daily , Weekly | |
| Add JBGS to Watchlist: View: Get Complete JBGS Trend Analysis ➞ | |
 | OMAM OM Asset Management plc |
| Sector: Financials | |
| SubSector: Asset Management | |
| MarketCap: 1718.41 Millions | |
| Recent Price: 15.35 Smart Investing & Trading Score: 10 | |
| Day Percent Change: 0% Day Change: -9999 | |
| Week Change: 0% Year-to-date Change: 0.0% | |
| OMAM Links: Profile News Message Board | |
| Charts:- Daily , Weekly | |
| Add OMAM to Watchlist: View: Get Complete OMAM Trend Analysis ➞ | |
 | NGHC National General Holdings Corp. |
| Sector: Financials | |
| SubSector: Property & Casualty Insurance | |
| MarketCap: 1713.62 Millions | |
| Recent Price: 100.10 Smart Investing & Trading Score: 50 | |
| Day Percent Change: -0.930325% Day Change: -9999 | |
| Week Change: 1.07027% Year-to-date Change: 0.0% | |
| NGHC Links: Profile News Message Board | |
| Charts:- Daily , Weekly | |
| Add NGHC to Watchlist: View: Get Complete NGHC Trend Analysis ➞ | |
 | MORE Monogram Residential Trust, Inc. |
| Sector: Financials | |
| SubSector: REIT - Residential | |
| MarketCap: 1698.96 Millions | |
| Recent Price: 4.27 Smart Investing & Trading Score: 0 | |
| Day Percent Change: 2.89157% Day Change: -9999 | |
| Week Change: -80.8819% Year-to-date Change: 0.0% | |
| MORE Links: Profile News Message Board | |
| Charts:- Daily , Weekly | |
| Add MORE to Watchlist: View: Get Complete MORE Trend Analysis ➞ | |
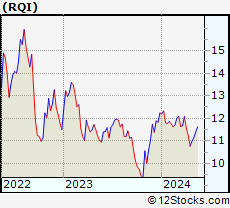 | RQI Cohen & Steers Quality Income Realty Fund, Inc |
| Sector: Financials | |
| SubSector: Closed-End Fund - Equity | |
| MarketCap: 1697.87 Millions | |
| Recent Price: 12.43 Smart Investing & Trading Score: 30 | |
| Day Percent Change: -0.56% Day Change: -0.04 | |
| Week Change: 0.485044% Year-to-date Change: 7.3% | |
| RQI Links: Profile News Message Board | |
| Charts:- Daily , Weekly | |
| Add RQI to Watchlist: View: Get Complete RQI Trend Analysis ➞ | |
 | NGHCP National General Holdings Corp. |
| Sector: Financials | |
| SubSector: Property & Casualty Insurance | |
| MarketCap: 1696.32 Millions | |
| Recent Price: 40.49 Smart Investing & Trading Score: 50 | |
| Day Percent Change: -0.369094% Day Change: -9999 | |
| Week Change: 0.696344% Year-to-date Change: 0.0% | |
| NGHCP Links: Profile News Message Board | |
| Charts:- Daily , Weekly | |
| Add NGHCP to Watchlist: View: Get Complete NGHCP Trend Analysis ➞ | |
 | LTC LTC Properties, Inc |
| Sector: Financials | |
| SubSector: REIT - Healthcare Facilities | |
| MarketCap: 1686.91 Millions | |
| Recent Price: 36.45 Smart Investing & Trading Score: 50 | |
| Day Percent Change: -1.5663% Day Change: 0.27 | |
| Week Change: 1.0255% Year-to-date Change: 11.3% | |
| LTC Links: Profile News Message Board | |
| Charts:- Daily , Weekly | |
| Add LTC to Watchlist: View: Get Complete LTC Trend Analysis ➞ | |
 | DX Dynex Capital, Inc |
| Sector: Financials | |
| SubSector: REIT - Mortgage | |
| MarketCap: 1678.47 Millions | |
| Recent Price: 12.66 Smart Investing & Trading Score: 80 | |
| Day Percent Change: 1.44231% Day Change: -0.09 | |
| Week Change: 5.06224% Year-to-date Change: 10.1% | |
| DX Links: Profile News Message Board | |
| Charts:- Daily , Weekly | |
| Add DX to Watchlist: View: Get Complete DX Trend Analysis ➞ | |
 | ATCO Atlas Corp. |
| Sector: Financials | |
| SubSector: Asset Management | |
| MarketCap: 1668.33 Millions | |
| Recent Price: 15.48 Smart Investing & Trading Score: 20 | |
| Day Percent Change: 0% Day Change: -9999 | |
| Week Change: 0% Year-to-date Change: 0.0% | |
| ATCO Links: Profile News Message Board | |
| Charts:- Daily , Weekly | |
| Add ATCO to Watchlist: View: Get Complete ATCO Trend Analysis ➞ | |
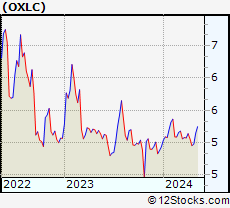 | OXLC Oxford Lane Capital Corp |
| Sector: Financials | |
| SubSector: Closed-End Fund - Debt | |
| MarketCap: 1649.59 Millions | |
| Recent Price: 17.24 Smart Investing & Trading Score: 70 | |
| Day Percent Change: 0.4662% Day Change: 0.05 | |
| Week Change: -0.057971% Year-to-date Change: 287.8% | |
| OXLC Links: Profile News Message Board | |
| Charts:- Daily , Weekly | |
| Add OXLC to Watchlist: View: Get Complete OXLC Trend Analysis ➞ | |
 | NYRT New York REIT, Inc. |
| Sector: Financials | |
| SubSector: REIT - Office | |
| MarketCap: 1647.19 Millions | |
| Recent Price: 60.63 Smart Investing & Trading Score: 60 | |
| Day Percent Change: -0.704225% Day Change: -9999 | |
| Week Change: 7.6527% Year-to-date Change: 0.0% | |
| NYRT Links: Profile News Message Board | |
| Charts:- Daily , Weekly | |
| Add NYRT to Watchlist: View: Get Complete NYRT Trend Analysis ➞ | |
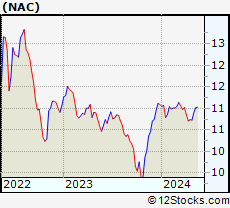 | NAC Nuveen California Quality Municipal Income Fund |
| Sector: Financials | |
| SubSector: Closed-End Fund - Debt | |
| MarketCap: 1646.94 Millions | |
| Recent Price: 11.57 Smart Investing & Trading Score: 100 | |
| Day Percent Change: -0.258621% Day Change: 0.01 | |
| Week Change: 2.48007% Year-to-date Change: 6.0% | |
| NAC Links: Profile News Message Board | |
| Charts:- Daily , Weekly | |
| Add NAC to Watchlist: View: Get Complete NAC Trend Analysis ➞ | |
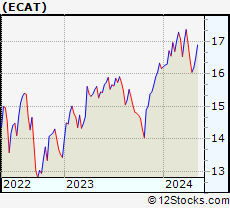 | ECAT BlackRock ESG Capital Allocation Term Trust |
| Sector: Financials | |
| SubSector: Closed-End Fund - Equity | |
| MarketCap: 1645.17 Millions | |
| Recent Price: 16.54 Smart Investing & Trading Score: 60 | |
| Day Percent Change: -0.120773% Day Change: -0.11 | |
| Week Change: 1.34804% Year-to-date Change: 15.0% | |
| ECAT Links: Profile News Message Board | |
| Charts:- Daily , Weekly | |
| Add ECAT to Watchlist: View: Get Complete ECAT Trend Analysis ➞ | |
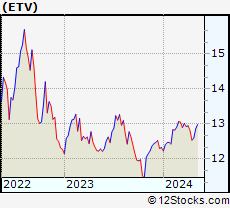 | ETV Eaton Vance Tax-Managed Buy-Write Opportunities Fund |
| Sector: Financials | |
| SubSector: Closed-End Fund - Equity | |
| MarketCap: 1642.74 Millions | |
| Recent Price: 14.30 Smart Investing & Trading Score: 90 | |
| Day Percent Change: 0.350877% Day Change: -0.04 | |
| Week Change: 1.5625% Year-to-date Change: 5.9% | |
| ETV Links: Profile News Message Board | |
| Charts:- Daily , Weekly | |
| Add ETV to Watchlist: View: Get Complete ETV Trend Analysis ➞ | |
 | BLX Banco Latinoamericano De Comercio Exterior SA |
| Sector: Financials | |
| SubSector: Banks - Regional | |
| MarketCap: 1636.78 Millions | |
| Recent Price: 45.00 Smart Investing & Trading Score: 10 | |
| Day Percent Change: -1.27249% Day Change: 0.48 | |
| Week Change: -3.84615% Year-to-date Change: 30.6% | |
| BLX Links: Profile News Message Board | |
| Charts:- Daily , Weekly | |
| Add BLX to Watchlist: View: Get Complete BLX Trend Analysis ➞ | |
 | GTY Getty Realty Corp |
| Sector: Financials | |
| SubSector: REIT - Retail | |
| MarketCap: 1633.83 Millions | |
| Recent Price: 26.83 Smart Investing & Trading Score: 40 | |
| Day Percent Change: -0.739919% Day Change: 0.01 | |
| Week Change: -0.703183% Year-to-date Change: -6.3% | |
| GTY Links: Profile News Message Board | |
| Charts:- Daily , Weekly | |
| Add GTY to Watchlist: View: Get Complete GTY Trend Analysis ➞ | |
 | NSM Nationstar Mortgage Holdings Inc. |
| Sector: Financials | |
| SubSector: Mortgage Investment | |
| MarketCap: 1618.32 Millions | |
| Recent Price: 45.59 Smart Investing & Trading Score: 10 | |
| Day Percent Change: 0.462759% Day Change: -9999 | |
| Week Change: -35.58% Year-to-date Change: 0.0% | |
| NSM Links: Profile News Message Board | |
| Charts:- Daily , Weekly | |
| Add NSM to Watchlist: View: Get Complete NSM Trend Analysis ➞ | |
 | IIPR Innovative Industrial Properties Inc |
| Sector: Financials | |
| SubSector: REIT - Industrial | |
| MarketCap: 1605.7 Millions | |
| Recent Price: 56.64 Smart Investing & Trading Score: 70 | |
| Day Percent Change: 2.49729% Day Change: -0.67 | |
| Week Change: 4.21343% Year-to-date Change: -10.9% | |
| IIPR Links: Profile News Message Board | |
| Charts:- Daily , Weekly | |
| Add IIPR to Watchlist: View: Get Complete IIPR Trend Analysis ➞ | |
 | NAVG The Navigators Group, Inc. |
| Sector: Financials | |
| SubSector: Property & Casualty Insurance | |
| MarketCap: 1601.76 Millions | |
| Recent Price: 3.54 Smart Investing & Trading Score: 70 | |
| Day Percent Change: 1.14286% Day Change: -9999 | |
| Week Change: 44.4898% Year-to-date Change: 0.0% | |
| NAVG Links: Profile News Message Board | |
| Charts:- Daily , Weekly | |
| Add NAVG to Watchlist: View: Get Complete NAVG Trend Analysis ➞ | |
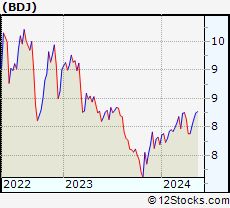 | BDJ BlackRock Enhanced Equity Dividend Trust |
| Sector: Financials | |
| SubSector: Closed-End Fund - Equity | |
| MarketCap: 1597.81 Millions | |
| Recent Price: 9.14 Smart Investing & Trading Score: 90 | |
| Day Percent Change: 0.219298% Day Change: -0.02 | |
| Week Change: 1.55556% Year-to-date Change: 16.0% | |
| BDJ Links: Profile News Message Board | |
| Charts:- Daily , Weekly | |
| Add BDJ to Watchlist: View: Get Complete BDJ Trend Analysis ➞ | |
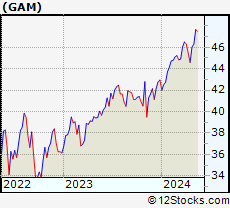 | GAM General American Investors Co., Inc |
| Sector: Financials | |
| SubSector: Closed-End Fund - Equity | |
| MarketCap: 1597.07 Millions | |
| Recent Price: 62.26 Smart Investing & Trading Score: 60 | |
| Day Percent Change: -0.032113% Day Change: 0.05 | |
| Week Change: 0.842242% Year-to-date Change: 22.9% | |
| GAM Links: Profile News Message Board | |
| Charts:- Daily , Weekly | |
| Add GAM to Watchlist: View: Get Complete GAM Trend Analysis ➞ | |
 | UCBI United Community Banks, Inc. |
| Sector: Financials | |
| SubSector: Regional - Mid-Atlantic Banks | |
| MarketCap: 1593.99 Millions | |
| Recent Price: 74.00 Smart Investing & Trading Score: 80 | |
| Day Percent Change: -0.0675219% Day Change: -9999 | |
| Week Change: 163.439% Year-to-date Change: 0.0% | |
| UCBI Links: Profile News Message Board | |
| Charts:- Daily , Weekly | |
| Add UCBI to Watchlist: View: Get Complete UCBI Trend Analysis ➞ | |
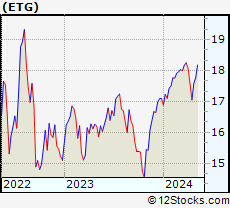 | ETG Eaton Vance Tax-Advantaged Global Dividend Income Fund |
| Sector: Financials | |
| SubSector: Closed-End Fund - Equity | |
| MarketCap: 1585.97 Millions | |
| Recent Price: 21.39 Smart Investing & Trading Score: 90 | |
| Day Percent Change: 0.469704% Day Change: -0.14 | |
| Week Change: 2.49161% Year-to-date Change: 22.9% | |
| ETG Links: Profile News Message Board | |
| Charts:- Daily , Weekly | |
| Add ETG to Watchlist: View: Get Complete ETG Trend Analysis ➞ | |
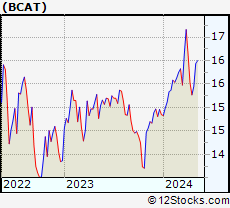 | BCAT BlackRock Capital Allocation Term Trust |
| Sector: Financials | |
| SubSector: Closed-End Fund - Equity | |
| MarketCap: 1576.87 Millions | |
| Recent Price: 14.89 Smart Investing & Trading Score: 60 | |
| Day Percent Change: -0.401338% Day Change: -0.12 | |
| Week Change: 1.08622% Year-to-date Change: 11.7% | |
| BCAT Links: Profile News Message Board | |
| Charts:- Daily , Weekly | |
| Add BCAT to Watchlist: View: Get Complete BCAT Trend Analysis ➞ | |
| For tabular summary view of above stock list: Summary View ➞ 0 - 25 , 25 - 50 , 50 - 75 , 75 - 100 , 100 - 125 , 125 - 150 , 150 - 175 , 175 - 200 , 200 - 225 , 225 - 250 , 250 - 275 , 275 - 300 , 300 - 325 , 325 - 350 , 350 - 375 , 375 - 400 , 400 - 425 , 425 - 450 , 450 - 475 , 475 - 500 , 500 - 525 , 525 - 550 , 550 - 575 , 575 - 600 , 600 - 625 , 625 - 650 , 650 - 675 , 675 - 700 , 700 - 725 , 725 - 750 , 750 - 775 , 775 - 800 , 800 - 825 , 825 - 850 , 850 - 875 , 875 - 900 , 900 - 925 , 925 - 950 , 950 - 975 , 975 - 1000 , 1000 - 1025 , 1025 - 1050 , 1050 - 1075 , 1075 - 1100 , 1100 - 1125 , 1125 - 1150 , 1150 - 1175 , 1175 - 1200 , 1200 - 1225 , 1225 - 1250 , 1250 - 1275 , 1275 - 1300 , 1300 - 1325 , 1325 - 1350 , 1350 - 1375 , 1375 - 1400 , 1400 - 1425 , 1425 - 1450 , 1450 - 1475 , 1475 - 1500 , 1500 - 1525 , 1525 - 1550 | ||
| Click To Change The Sort Order: By Market Cap or Company Size Performance: Year-to-date, Week and Day | |
| Select Chart Type: | ||
|
Best Stocks Today 12Stocks.com |
© 2025 12Stocks.com Terms & Conditions Privacy Contact Us
All Information Provided Only For Education And Not To Be Used For Investing or Trading. See Terms & Conditions


One More Thing ... Get Best Stocks Delivered Daily!
Never Ever Miss A Move With Our Top Ten Stocks Lists
Find Best Stocks In Any Market - Bull or Bear Market
Take A Peek At Our Top Ten Stocks Lists: Daily, Weekly, Year-to-Date & Top Trends
Find Best Stocks In Any Market - Bull or Bear Market
Take A Peek At Our Top Ten Stocks Lists: Daily, Weekly, Year-to-Date & Top Trends
Financial Stocks With Best Up Trends [0-bearish to 100-bullish]: PIMCO California[100], Torchmark [100], PIMCO California[100], Triumph Bancorp[100], Cipher Mining[100], Lufax Holding[100], PIMCO Municipal[100], PIMCO Municipal[100], Front Yard[100], National General[100], Fifth Street[100]
Best Financial Stocks Year-to-Date:
Insight Select[12384.6%], Better Home[523.632%], IREN [363.5%], Global Medical[353.709%], Oxford Lane[287.756%], Robinhood Markets[269.422%], Metalpha Technology[225.664%], Cipher Mining[185.3%], Banco Santander[131.403%], Mr. Cooper[124.245%], Altisource Portfolio[121.195%] Best Financial Stocks This Week:
Colony Starwood[15929900%], Blackhawk Network[91300%], Macquarie Global[81662.9%], Credit Suisse[63241.6%], Pennsylvania Real[23823%], First Republic[22570.9%], Select ome[14000%], CorEnergy Infrastructure[6797.78%], FedNat Holding[5525%], BlackRock Municipal[5340%], BlackRock MuniYield[3379.04%] Best Financial Stocks Daily:
PIMCO California[11.9545%], Torchmark [11.8363%], PIMCO California[11.4754%], BlackRock Muni[10.8108%], Blackrock MuniYield[10.72%], Triumph Bancorp[10.2661%], Cipher Mining[9.36508%], AMBAC [8.24108%], BlackRock MuniYield[8.15348%], Summit [7.79817%], Concord Acquisition[7.63431%]