
 Login Sign Up


| |||||
 |  | ||||

| 12Stocks.com Market Intelligence |
Best Financial Stocks
| In a hurry? Financial Stocks Lists: Performance Trends Table, Stock Charts
Sort Financial stocks: Daily, Weekly, Year-to-Date, Market Cap & Trends. Filter Financial stocks list by size:All Financial Large Mid-Range Small & MicroCap |
| 12Stocks.com Financial Stocks Performances & Trends Daily | |||||||||
|
|  The overall Smart Investing & Trading Score is 20 (0-bearish to 100-bullish) which puts Financial sector in short term bearish trend. The Smart Investing & Trading Score from previous trading session is 30 and a deterioration of trend continues.
| ||||||||
Here are the Smart Investing & Trading Scores of the most requested Financial stocks at 12Stocks.com (click stock name for detailed review):
|


| 12Stocks.com: Investing in Financial sector with Stocks | |
|
The following table helps investors and traders sort through current performance and trends (as measured by Smart Investing & Trading Score) of various
stocks in the Financial sector. Quick View: Move mouse or cursor over stock symbol (ticker) to view short-term Technical chart and over stock name to view long term chart. Click on  to add stock symbol to your watchlist and to add stock symbol to your watchlist and  to view watchlist. Click on any ticker or stock name for detailed market intelligence report for that stock. to view watchlist. Click on any ticker or stock name for detailed market intelligence report for that stock. |
12Stocks.com Performance of Stocks in Financial Sector
| Ticker | Stock Name | Watchlist | Category | Recent Price | Trend Score | Change % | YTD Change% |
| FCF | First Commonwealth |   | Banks - Regional | 16.75 | 10 | -0.59% | 3.77% |
| CHCO | City Holding | | Banks - Regional | 121.56 | 0 | -0.78% | 5.70% |
| NWBI | Northwest Bancshares | | Banks - Regional | 12.34 | 20 | 0.24% | -0.04% |
| NYMTO | New York | | Mortgage | 25.06 | 20 | 0.00% | 0.00% |
| BNCN | BNC Bancorp | | Regional Banks | 17.57 | 0 | 1.44% | 0.00% |
| FIHL | Fidelis Insurance | | Insurance - | 17.80 | 17 | -0.17% | -1.76% |
| NUV | Nuveen Municipal | | Closed-End Fund - Debt | 8.99 | 70 | 0.00% | 6.45% |
| SHO | Sunstone Hotel | | REIT - Hotel & Motel | 9.33 | 30 | -0.11% | -18.32% |
| EVT | Eaton Vance | | Closed-End Fund - Equity | 24.55 | 90 | 0.61% | 7.83% |
| NYMTN | New York | | Mortgage | 21.66 | 50 | 0.21% | 0.05% |
| PGRE | Paramount | | REIT - Office | 6.52 | 50 | -0.31% | 31.45% |
| LION | Lionsgate Studios | | Shell Companies | 6.51 | 20 | -3.98% | -17.07% |
| YDKN | Yadkin | | Regional Banks | 15.12 | 10 | 0.53% | 0.00% |
| PDO | PIMCO Dynamic | | Closed-End Fund - Debt | 14.15 | 90 | 0.14% | 11.92% |
| ARR | ARMOUR Residential | | REIT - Mortgage | 15.52 | 80 | 0.65% | -9.69% |
| BIGZ | BlackRock Innovation | | Closed-End Fund - Equity | 6.98 | 10 | -3.46% | 0.86% |
| GNL | Global Net | | REIT - | 8.13 | 80 | -0.73% | 21.83% |
| DRH | Diamondrock Hospitality | | REIT - Hotel & Motel | 7.97 | 40 | 0.13% | -8.79% |
| EXPI | eXp World | | Real Estate Services | 10.64 | 20 | 2.21% | -5.10% |
| LOB | Live Oak | | Banks - Regional | 34.44 | 20 | -1.91% | -10.46% |
| BGCP | BGC Partners | | Brokerage | 4.43 | 20 | 0.00% | 0.00% |
| TY | Tri-Continental Corp | | Closed-End Fund - Equity | 34.11 | 70 | 0.21% | 9.01% |
| WAFDP | Washington Federal | | Banks - Regional | 16.51 | 50 | -0.24% | 0.20% |
| CASH | Pathward | | Banks - Regional | 73.46 | 0 | -0.23% | 1.45% |
| LKFN | Lakeland | | Banks - Regional | 63.13 | 0 | -0.54% | -3.86% |
| For chart view version of above stock list: Chart View ➞ 0 - 25 , 25 - 50 , 50 - 75 , 75 - 100 , 100 - 125 , 125 - 150 , 150 - 175 , 175 - 200 , 200 - 225 , 225 - 250 , 250 - 275 , 275 - 300 , 300 - 325 , 325 - 350 , 350 - 375 , 375 - 400 , 400 - 425 , 425 - 450 , 450 - 475 , 475 - 500 , 500 - 525 , 525 - 550 , 550 - 575 , 575 - 600 , 600 - 625 , 625 - 650 , 650 - 675 , 675 - 700 , 700 - 725 , 725 - 750 , 750 - 775 , 775 - 800 , 800 - 825 , 825 - 850 , 850 - 875 , 875 - 900 , 900 - 925 , 925 - 950 , 950 - 975 , 975 - 1000 , 1000 - 1025 , 1025 - 1050 , 1050 - 1075 , 1075 - 1100 , 1100 - 1125 , 1125 - 1150 , 1150 - 1175 , 1175 - 1200 , 1200 - 1225 , 1225 - 1250 , 1250 - 1275 , 1275 - 1300 , 1300 - 1325 , 1325 - 1350 , 1350 - 1375 , 1375 - 1400 , 1400 - 1425 , 1425 - 1450 , 1450 - 1475 , 1475 - 1500 , 1500 - 1525 , 1525 - 1550 | ||
 | Click To Change The Sort Order: By Market Cap or Company Size Performance: Year-to-date, Week and Day |  |
|
Get the most comprehensive stock market coverage daily at 12Stocks.com ➞ Best Stocks Today ➞ Best Stocks Weekly ➞ Best Stocks Year-to-Date ➞ Best Stocks Trends ➞  Best Stocks Today 12Stocks.com Best Nasdaq Stocks ➞ Best S&P 500 Stocks ➞ Best Tech Stocks ➞ Best Biotech Stocks ➞ |
| Detailed Overview of Financial Stocks |
| Financial Technical Overview, Leaders & Laggards, Top Financial ETF Funds & Detailed Financial Stocks List, Charts, Trends & More |
| Financial Sector: Technical Analysis, Trends & YTD Performance | |
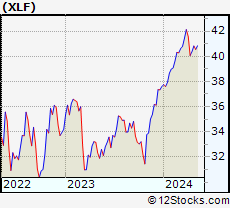
| Financial sector is composed of stocks
from banks, brokers, insurance, REITs
and services subsectors. Financial sector, as represented by XLF, an exchange-traded fund [ETF] that holds basket of Financial stocks (e.g, Bank of America, Goldman Sachs) is up by 11.4442% and is currently underperforming the overall market by -3.3137% year-to-date. Below is a quick view of Technical charts and trends: |
|
 XLF Weekly Chart |
|
| Long Term Trend: Good | |
| Medium Term Trend: Not Good | |
 XLF Daily Chart |
|
| Short Term Trend: Not Good | |
| Overall Trend Score: 20 | |
| YTD Performance: 11.4442% | |
| **Trend Scores & Views Are Only For Educational Purposes And Not For Investing | |
| 12Stocks.com: Top Performing Financial Sector Stocks | |||||||||||||||||||||||||||||||||||||||||||||||
 The top performing Financial sector stocks year to date are
Now, more recently, over last week, the top performing Financial sector stocks on the move are


|
|||||||||||||||||||||||||||||||||||||||||||||||
| 12Stocks.com: Investing in Financial Sector using Exchange Traded Funds | |
|
The following table shows list of key exchange traded funds (ETF) that
help investors track Financial Index. For detailed view, check out our ETF Funds section of our website. Quick View: Move mouse or cursor over ETF symbol (ticker) to view short-term Technical chart and over ETF name to view long term chart. Click on ticker or stock name for detailed view. Click on to add stock symbol to your watchlist and to view watchlist. |
12Stocks.com List of ETFs that track Financial Index
| Ticker | ETF Name | Watchlist | Recent Price | Smart Investing & Trading Score | Change % | Week % | Year-to-date % |
| CHIX | China Financials | | 10.57 | 20 | 0 | 0 | 0% |
| 12Stocks.com: Charts, Trends, Fundamental Data and Performances of Financial Stocks | |
|
We now take in-depth look at all Financial stocks including charts, multi-period performances and overall trends (as measured by Smart Investing & Trading Score). One can sort Financial stocks (click link to choose) by Daily, Weekly and by Year-to-Date performances. Also, one can sort by size of the company or by market capitalization. |
| Select Your Default Chart Type: | |||||
| |||||
| Click on stock symbol or name for detailed view. Click on to add stock symbol to your watchlist and to view watchlist. Quick View: Move mouse or cursor over "Daily" to quickly view daily Technical stock chart and over "Weekly" to view weekly Technical stock chart. | |||||

 | FCF First Commonwealth Financial Corp |
| Sector: Financials | |
| SubSector: Banks - Regional | |
| MarketCap: 1869.15 Millions | |
| Recent Price: 16.75 Smart Investing & Trading Score: 10 | |
| Day Percent Change: -0.593472% Day Change: 0.07 | |
| Week Change: -3.73563% Year-to-date Change: 3.8% | |
| FCF Links: Profile News Message Board | |
| Charts:- Daily , Weekly | |
| Add FCF to Watchlist: View: Get Complete FCF Trend Analysis ➞ | |
 | CHCO City Holding Co |
| Sector: Financials | |
| SubSector: Banks - Regional | |
| MarketCap: 1864.62 Millions | |
| Recent Price: 121.56 Smart Investing & Trading Score: 0 | |
| Day Percent Change: -0.775447% Day Change: 0.28 | |
| Week Change: -1.33117% Year-to-date Change: 5.7% | |
| CHCO Links: Profile News Message Board | |
| Charts:- Daily , Weekly | |
| Add CHCO to Watchlist: View: Get Complete CHCO Trend Analysis ➞ | |
 | NWBI Northwest Bancshares Inc |
| Sector: Financials | |
| SubSector: Banks - Regional | |
| MarketCap: 1858.35 Millions | |
| Recent Price: 12.34 Smart Investing & Trading Score: 20 | |
| Day Percent Change: 0.243704% Day Change: -0.06 | |
| Week Change: -1.12179% Year-to-date Change: 0.0% | |
| NWBI Links: Profile News Message Board | |
| Charts:- Daily , Weekly | |
| Add NWBI to Watchlist: View: Get Complete NWBI Trend Analysis ➞ | |
 | NYMTO New York Mortgage Trust, Inc. |
| Sector: Financials | |
| SubSector: Mortgage Investment | |
| MarketCap: 1852.79 Millions | |
| Recent Price: 25.06 Smart Investing & Trading Score: 20 | |
| Day Percent Change: 0% Day Change: -9999 | |
| Week Change: 0% Year-to-date Change: 0.0% | |
| NYMTO Links: Profile News Message Board | |
| Charts:- Daily , Weekly | |
| Add NYMTO to Watchlist: View: Get Complete NYMTO Trend Analysis ➞ | |
 | BNCN BNC Bancorp |
| Sector: Financials | |
| SubSector: Regional - Mid-Atlantic Banks | |
| MarketCap: 1840.1 Millions | |
| Recent Price: 17.57 Smart Investing & Trading Score: 0 | |
| Day Percent Change: 1.44342% Day Change: -9999 | |
| Week Change: -65.1251% Year-to-date Change: 0.0% | |
| BNCN Links: Profile News Message Board | |
| Charts:- Daily , Weekly | |
| Add BNCN to Watchlist: View: Get Complete BNCN Trend Analysis ➞ | |
 | FIHL Fidelis Insurance Holdings Ltd |
| Sector: Financials | |
| SubSector: Insurance - Diversified | |
| MarketCap: 1826.69 Millions | |
| Recent Price: 17.80 Smart Investing & Trading Score: 17 | |
| Day Percent Change: -0.17% Day Change: -0.03 | |
| Week Change: 2.75% Year-to-date Change: -1.8% | |
| FIHL Links: Profile News Message Board | |
| Charts:- Daily , Weekly | |
| Add FIHL to Watchlist: View: Get Complete FIHL Trend Analysis ➞ | |
 | NUV Nuveen Municipal Value Fund Inc |
| Sector: Financials | |
| SubSector: Closed-End Fund - Debt | |
| MarketCap: 1820.14 Millions | |
| Recent Price: 8.99 Smart Investing & Trading Score: 70 | |
| Day Percent Change: 0% Day Change: -0.03 | |
| Week Change: 0.222965% Year-to-date Change: 6.5% | |
| NUV Links: Profile News Message Board | |
| Charts:- Daily , Weekly | |
| Add NUV to Watchlist: View: Get Complete NUV Trend Analysis ➞ | |
 | SHO Sunstone Hotel Investors Inc |
| Sector: Financials | |
| SubSector: REIT - Hotel & Motel | |
| MarketCap: 1816.11 Millions | |
| Recent Price: 9.33 Smart Investing & Trading Score: 30 | |
| Day Percent Change: -0.107066% Day Change: 0.06 | |
| Week Change: -3.21577% Year-to-date Change: -18.3% | |
| SHO Links: Profile News Message Board | |
| Charts:- Daily , Weekly | |
| Add SHO to Watchlist: View: Get Complete SHO Trend Analysis ➞ | |
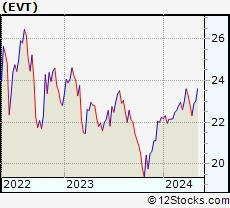 | EVT Eaton Vance Tax Advantaged Dividend Income Fund |
| Sector: Financials | |
| SubSector: Closed-End Fund - Equity | |
| MarketCap: 1812.88 Millions | |
| Recent Price: 24.55 Smart Investing & Trading Score: 90 | |
| Day Percent Change: 0.614754% Day Change: -0.11 | |
| Week Change: 1.61424% Year-to-date Change: 7.8% | |
| EVT Links: Profile News Message Board | |
| Charts:- Daily , Weekly | |
| Add EVT to Watchlist: View: Get Complete EVT Trend Analysis ➞ | |
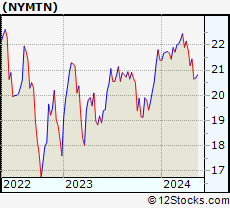 | NYMTN New York Mortgage Trust, Inc. |
| Sector: Financials | |
| SubSector: Mortgage Investment | |
| MarketCap: 1810.39 Millions | |
| Recent Price: 21.66 Smart Investing & Trading Score: 50 | |
| Day Percent Change: 0.208141% Day Change: 0.01 | |
| Week Change: -0.390805% Year-to-date Change: 0.0% | |
| NYMTN Links: Profile News Message Board | |
| Charts:- Daily , Weekly | |
| Add NYMTN to Watchlist: View: Get Complete NYMTN Trend Analysis ➞ | |
 | PGRE Paramount Group Inc |
| Sector: Financials | |
| SubSector: REIT - Office | |
| MarketCap: 1798.92 Millions | |
| Recent Price: 6.52 Smart Investing & Trading Score: 50 | |
| Day Percent Change: -0.30581% Day Change: -0.04 | |
| Week Change: -0.30581% Year-to-date Change: 31.5% | |
| PGRE Links: Profile News Message Board | |
| Charts:- Daily , Weekly | |
| Add PGRE to Watchlist: View: Get Complete PGRE Trend Analysis ➞ | |
 | LION Lionsgate Studios Corp |
| Sector: Financials | |
| SubSector: Shell Companies | |
| MarketCap: 1783.43 Millions | |
| Recent Price: 6.51 Smart Investing & Trading Score: 20 | |
| Day Percent Change: -3.9823% Day Change: 0.04 | |
| Week Change: -4.68521% Year-to-date Change: -17.1% | |
| LION Links: Profile News Message Board | |
| Charts:- Daily , Weekly | |
| Add LION to Watchlist: View: Get Complete LION Trend Analysis ➞ | |
 | YDKN Yadkin Financial Corporation |
| Sector: Financials | |
| SubSector: Regional - Mid-Atlantic Banks | |
| MarketCap: 1782.96 Millions | |
| Recent Price: 15.12 Smart Investing & Trading Score: 10 | |
| Day Percent Change: 0.531915% Day Change: -9999 | |
| Week Change: -19.8303% Year-to-date Change: 0.0% | |
| YDKN Links: Profile News Message Board | |
| Charts:- Daily , Weekly | |
| Add YDKN to Watchlist: View: Get Complete YDKN Trend Analysis ➞ | |
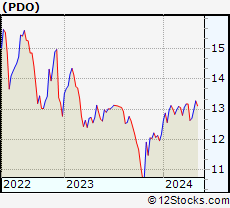 | PDO PIMCO Dynamic Income Opportunities Fund |
| Sector: Financials | |
| SubSector: Closed-End Fund - Debt | |
| MarketCap: 1782.24 Millions | |
| Recent Price: 14.15 Smart Investing & Trading Score: 90 | |
| Day Percent Change: 0.141543% Day Change: 0 | |
| Week Change: 1.21602% Year-to-date Change: 11.9% | |
| PDO Links: Profile News Message Board | |
| Charts:- Daily , Weekly | |
| Add PDO to Watchlist: View: Get Complete PDO Trend Analysis ➞ | |
 | ARR ARMOUR Residential REIT Inc |
| Sector: Financials | |
| SubSector: REIT - Mortgage | |
| MarketCap: 1780.79 Millions | |
| Recent Price: 15.52 Smart Investing & Trading Score: 80 | |
| Day Percent Change: 0.648508% Day Change: -0.07 | |
| Week Change: 9.83723% Year-to-date Change: -9.7% | |
| ARR Links: Profile News Message Board | |
| Charts:- Daily , Weekly | |
| Add ARR to Watchlist: View: Get Complete ARR Trend Analysis ➞ | |
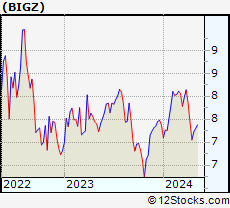 | BIGZ BlackRock Innovation and Growth Term Trust |
| Sector: Financials | |
| SubSector: Closed-End Fund - Equity | |
| MarketCap: 1780 Millions | |
| Recent Price: 6.98 Smart Investing & Trading Score: 10 | |
| Day Percent Change: -3.45781% Day Change: -9999 | |
| Week Change: -5.92992% Year-to-date Change: 0.9% | |
| BIGZ Links: Profile News Message Board | |
| Charts:- Daily , Weekly | |
| Add BIGZ to Watchlist: View: Get Complete BIGZ Trend Analysis ➞ | |
 | GNL Global Net Lease Inc |
| Sector: Financials | |
| SubSector: REIT - Diversified | |
| MarketCap: 1774.37 Millions | |
| Recent Price: 8.13 Smart Investing & Trading Score: 80 | |
| Day Percent Change: -0.732601% Day Change: -0.04 | |
| Week Change: 1.1194% Year-to-date Change: 21.8% | |
| GNL Links: Profile News Message Board | |
| Charts:- Daily , Weekly | |
| Add GNL to Watchlist: View: Get Complete GNL Trend Analysis ➞ | |
 | DRH Diamondrock Hospitality Co |
| Sector: Financials | |
| SubSector: REIT - Hotel & Motel | |
| MarketCap: 1767.32 Millions | |
| Recent Price: 7.97 Smart Investing & Trading Score: 40 | |
| Day Percent Change: 0.125628% Day Change: 0.01 | |
| Week Change: -1.60494% Year-to-date Change: -8.8% | |
| DRH Links: Profile News Message Board | |
| Charts:- Daily , Weekly | |
| Add DRH to Watchlist: View: Get Complete DRH Trend Analysis ➞ | |
 | EXPI eXp World Holdings Inc |
| Sector: Financials | |
| SubSector: Real Estate Services | |
| MarketCap: 1764.15 Millions | |
| Recent Price: 10.64 Smart Investing & Trading Score: 20 | |
| Day Percent Change: 2.20941% Day Change: -0.02 | |
| Week Change: -3.27273% Year-to-date Change: -5.1% | |
| EXPI Links: Profile News Message Board | |
| Charts:- Daily , Weekly | |
| Add EXPI to Watchlist: View: Get Complete EXPI Trend Analysis ➞ | |
 | LOB Live Oak Bancshares Inc |
| Sector: Financials | |
| SubSector: Banks - Regional | |
| MarketCap: 1754.25 Millions | |
| Recent Price: 34.44 Smart Investing & Trading Score: 20 | |
| Day Percent Change: -1.90829% Day Change: 0.05 | |
| Week Change: -3.79888% Year-to-date Change: -10.5% | |
| LOB Links: Profile News Message Board | |
| Charts:- Daily , Weekly | |
| Add LOB to Watchlist: View: Get Complete LOB Trend Analysis ➞ | |
 | BGCP BGC Partners, Inc. |
| Sector: Financials | |
| SubSector: Investment Brokerage - National | |
| MarketCap: 1750.05 Millions | |
| Recent Price: 4.43 Smart Investing & Trading Score: 20 | |
| Day Percent Change: 0% Day Change: -9999 | |
| Week Change: 0% Year-to-date Change: 0.0% | |
| BGCP Links: Profile News Message Board | |
| Charts:- Daily , Weekly | |
| Add BGCP to Watchlist: View: Get Complete BGCP Trend Analysis ➞ | |
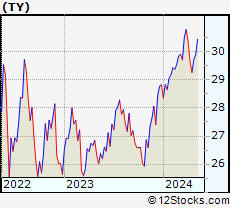 | TY Tri-Continental Corp |
| Sector: Financials | |
| SubSector: Closed-End Fund - Equity | |
| MarketCap: 1743.29 Millions | |
| Recent Price: 34.11 Smart Investing & Trading Score: 70 | |
| Day Percent Change: 0.20564% Day Change: -0.08 | |
| Week Change: 0.768095% Year-to-date Change: 9.0% | |
| TY Links: Profile News Message Board | |
| Charts:- Daily , Weekly | |
| Add TY to Watchlist: View: Get Complete TY Trend Analysis ➞ | |
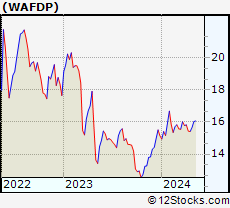 | WAFDP Washington Federal, Inc. |
| Sector: Financials | |
| SubSector: Banks - Regional | |
| MarketCap: 1740 Millions | |
| Recent Price: 16.51 Smart Investing & Trading Score: 50 | |
| Day Percent Change: -0.241692% Day Change: -0.14 | |
| Week Change: -1.72619% Year-to-date Change: 0.2% | |
| WAFDP Links: Profile News Message Board | |
| Charts:- Daily , Weekly | |
| Add WAFDP to Watchlist: View: Get Complete WAFDP Trend Analysis ➞ | |
 | CASH Pathward Financial Inc |
| Sector: Financials | |
| SubSector: Banks - Regional | |
| MarketCap: 1739.82 Millions | |
| Recent Price: 73.46 Smart Investing & Trading Score: 0 | |
| Day Percent Change: -0.230884% Day Change: -0.59 | |
| Week Change: -2.04027% Year-to-date Change: 1.4% | |
| CASH Links: Profile News Message Board | |
| Charts:- Daily , Weekly | |
| Add CASH to Watchlist: View: Get Complete CASH Trend Analysis ➞ | |
 | LKFN Lakeland Financial Corp |
| Sector: Financials | |
| SubSector: Banks - Regional | |
| MarketCap: 1734.26 Millions | |
| Recent Price: 63.13 Smart Investing & Trading Score: 0 | |
| Day Percent Change: -0.535686% Day Change: 0.14 | |
| Week Change: -1.97205% Year-to-date Change: -3.9% | |
| LKFN Links: Profile News Message Board | |
| Charts:- Daily , Weekly | |
| Add LKFN to Watchlist: View: Get Complete LKFN Trend Analysis ➞ | |
| For tabular summary view of above stock list: Summary View ➞ 0 - 25 , 25 - 50 , 50 - 75 , 75 - 100 , 100 - 125 , 125 - 150 , 150 - 175 , 175 - 200 , 200 - 225 , 225 - 250 , 250 - 275 , 275 - 300 , 300 - 325 , 325 - 350 , 350 - 375 , 375 - 400 , 400 - 425 , 425 - 450 , 450 - 475 , 475 - 500 , 500 - 525 , 525 - 550 , 550 - 575 , 575 - 600 , 600 - 625 , 625 - 650 , 650 - 675 , 675 - 700 , 700 - 725 , 725 - 750 , 750 - 775 , 775 - 800 , 800 - 825 , 825 - 850 , 850 - 875 , 875 - 900 , 900 - 925 , 925 - 950 , 950 - 975 , 975 - 1000 , 1000 - 1025 , 1025 - 1050 , 1050 - 1075 , 1075 - 1100 , 1100 - 1125 , 1125 - 1150 , 1150 - 1175 , 1175 - 1200 , 1200 - 1225 , 1225 - 1250 , 1250 - 1275 , 1275 - 1300 , 1300 - 1325 , 1325 - 1350 , 1350 - 1375 , 1375 - 1400 , 1400 - 1425 , 1425 - 1450 , 1450 - 1475 , 1475 - 1500 , 1500 - 1525 , 1525 - 1550 | ||
| Click To Change The Sort Order: By Market Cap or Company Size Performance: Year-to-date, Week and Day | |
| Select Chart Type: | ||
|
Best Stocks Today 12Stocks.com |
© 2025 12Stocks.com Terms & Conditions Privacy Contact Us
All Information Provided Only For Education And Not To Be Used For Investing or Trading. See Terms & Conditions


One More Thing ... Get Best Stocks Delivered Daily!
Never Ever Miss A Move With Our Top Ten Stocks Lists
Find Best Stocks In Any Market - Bull or Bear Market
Take A Peek At Our Top Ten Stocks Lists: Daily, Weekly, Year-to-Date & Top Trends
Find Best Stocks In Any Market - Bull or Bear Market
Take A Peek At Our Top Ten Stocks Lists: Daily, Weekly, Year-to-Date & Top Trends
Financial Stocks With Best Up Trends [0-bearish to 100-bullish]: PIMCO California[100], Torchmark [100], PIMCO California[100], Triumph Bancorp[100], Cipher Mining[100], Lufax Holding[100], PIMCO Municipal[100], PIMCO Municipal[100], Front Yard[100], National General[100], Fifth Street[100]
Best Financial Stocks Year-to-Date:
Insight Select[12384.6%], Better Home[523.632%], IREN [363.5%], Global Medical[353.709%], Oxford Lane[287.756%], Robinhood Markets[269.422%], Metalpha Technology[225.664%], Cipher Mining[185.3%], Banco Santander[131.403%], Mr. Cooper[124.245%], Altisource Portfolio[121.195%] Best Financial Stocks This Week:
Colony Starwood[15929900%], Blackhawk Network[91300%], Macquarie Global[81662.9%], Credit Suisse[63241.6%], Pennsylvania Real[23823%], First Republic[22570.9%], Select ome[14000%], CorEnergy Infrastructure[6797.78%], FedNat Holding[5525%], BlackRock Municipal[5340%], BlackRock MuniYield[3379.04%] Best Financial Stocks Daily:
PIMCO California[11.9545%], Torchmark [11.8363%], PIMCO California[11.4754%], BlackRock Muni[10.8108%], Blackrock MuniYield[10.72%], Triumph Bancorp[10.2661%], Cipher Mining[9.36508%], AMBAC [8.24108%], BlackRock MuniYield[8.15348%], Summit [7.79817%], Concord Acquisition[7.63431%]