
 Login Sign Up


| |||||
 |  | ||||

| 12Stocks.com Market Intelligence |
Best Financial Stocks
| In a hurry? Financial Stocks Lists: Performance Trends Table, Stock Charts
Sort Financial stocks: Daily, Weekly, Year-to-Date, Market Cap & Trends. Filter Financial stocks list by size:All Financial Large Mid-Range Small & MicroCap |
| 12Stocks.com Financial Stocks Performances & Trends Daily | |||||||||
|
|  The overall Smart Investing & Trading Score is 90 (0-bearish to 100-bullish) which puts Financial sector in short term bullish trend. The Smart Investing & Trading Score from previous trading session is 60 and an improvement of trend continues.
| ||||||||
Here are the Smart Investing & Trading Scores of the most requested Financial stocks at 12Stocks.com (click stock name for detailed review):
|


| 12Stocks.com: Investing in Financial sector with Stocks | |
|
The following table helps investors and traders sort through current performance and trends (as measured by Smart Investing & Trading Score) of various
stocks in the Financial sector. Quick View: Move mouse or cursor over stock symbol (ticker) to view short-term Technical chart and over stock name to view long term chart. Click on  to add stock symbol to your watchlist and to add stock symbol to your watchlist and  to view watchlist. Click on any ticker or stock name for detailed market intelligence report for that stock. to view watchlist. Click on any ticker or stock name for detailed market intelligence report for that stock. |
12Stocks.com Performance of Stocks in Financial Sector
| Ticker | Stock Name | Watchlist | Category | Recent Price | Trend Score | Change % | YTD Change% |
| NNI | Nelnet |   | Credit Services | 128.37 | 70 | 2.54% | 22.06% |
| FG | F&G Annuities | | Insurance - Life | 33.60 | 30 | -0.62% | -17.31% |
| WTM | White Mountains | | Insurance - Property & Casualty | 1753.62 | 40 | 1.78% | -9.05% |
| PVTB | PrivateBancorp | | Regional Banks | 9.66 | 0 | -0.10% | 0.00% |
| SBRA | Sabra Healthcare | | REIT | 18.86 | 30 | 0.86% | 14.58% |
| BPY | Brookfield Property | | Real Estatet | 1.08 | 10 | 0.00% | 0.00% |
| NSA | National Storage | | REIT - Industrial | 30.62 | 10 | -0.26% | -15.41% |
| VR | Validus | | Insurance | 16.47 | 10 | 0.30% | 0.00% |
| BANF | Bancfirst Corp | | Banks - Regional | 135.30 | 90 | 3.18% | 17.46% |
| IBOC | Bancshares | | Banks - Regional | 70.95 | 50 | 2.32% | 13.95% |
| ASB | Associated Banc-Corp | | Banks - Regional | 26.55 | 70 | 2.43% | 14.69% |
| CRVL | Corvel Corp | | Insurance | 82.97 | 30 | 1.65% | -23.99% |
| IRT | Independence Realty | | REIT | 17.06 | 20 | 0.77% | -12.17% |
| SC | Santander Consumer | | Mortgage | 45.94 | 70 | -0.20% | 0.00% |
| AB | AllianceBernstein Holding | | Asset Mgmt | 38.81 | 40 | 1.46% | 11.97% |
| MCY | Mercury General | | Insurance - Property & Casualty | 79.31 | 90 | 2.12% | 21.92% |
| LM | Legg Mason | | Asset Mgmt | 222.84 | 70 | 0.88% | 0.00% |
| RYN | Rayonier | | REIT - Specialty | 26.03 | 40 | 1.21% | 2.10% |
| FHI | Federated Hermes | | Asset Mgmt | 53.31 | 90 | 1.45% | 33.49% |
| DNB | Dun & Bradstreet | | Financial Data & Stock Exchanges | 9.15 | 80 | 0.44% | -25.48% |
| EPR | EPR Properties | | REIT - Specialty | 56.87 | 40 | 0.42% | 34.45% |
| HGTY | Hagerty | | Insurance - Property & Casualty | 12.98 | 90 | -0.31% | 31.38% |
| COLD | Americold Realty | | REIT - Industrial | 12.99 | 0 | -1.96% | -37.66% |
| TCBI | Texas Capital | | Banks - Regional | 87.87 | 80 | 3.05% | 14.40% |
| SKT | Tanger | | REIT - Retail | 33.81 | 60 | -0.44% | 2.16% |
| For chart view version of above stock list: Chart View ➞ 0 - 25 , 25 - 50 , 50 - 75 , 75 - 100 , 100 - 125 , 125 - 150 , 150 - 175 , 175 - 200 , 200 - 225 , 225 - 250 , 250 - 275 , 275 - 300 , 300 - 325 , 325 - 350 , 350 - 375 , 375 - 400 , 400 - 425 , 425 - 450 , 450 - 475 , 475 - 500 , 500 - 525 , 525 - 550 , 550 - 575 , 575 - 600 , 600 - 625 , 625 - 650 , 650 - 675 , 675 - 700 , 700 - 725 , 725 - 750 , 750 - 775 , 775 - 800 , 800 - 825 , 825 - 850 , 850 - 875 , 875 - 900 , 900 - 925 , 925 - 950 , 950 - 975 , 975 - 1000 , 1000 - 1025 , 1025 - 1050 , 1050 - 1075 , 1075 - 1100 , 1100 - 1125 , 1125 - 1150 , 1150 - 1175 , 1175 - 1200 , 1200 - 1225 , 1225 - 1250 , 1250 - 1275 , 1275 - 1300 , 1300 - 1325 , 1325 - 1350 , 1350 - 1375 , 1375 - 1400 , 1400 - 1425 , 1425 - 1450 , 1450 - 1475 , 1475 - 1500 , 1500 - 1525 , 1525 - 1550 | ||
 | Click To Change The Sort Order: By Market Cap or Company Size Performance: Year-to-date, Week and Day |  |
|
Get the most comprehensive stock market coverage daily at 12Stocks.com ➞ Best Stocks Today ➞ Best Stocks Weekly ➞ Best Stocks Year-to-Date ➞ Best Stocks Trends ➞  Best Stocks Today 12Stocks.com Best Nasdaq Stocks ➞ Best S&P 500 Stocks ➞ Best Tech Stocks ➞ Best Biotech Stocks ➞ |
| Detailed Overview of Financial Stocks |
| Financial Technical Overview, Leaders & Laggards, Top Financial ETF Funds & Detailed Financial Stocks List, Charts, Trends & More |
| Financial Sector: Technical Analysis, Trends & YTD Performance | |
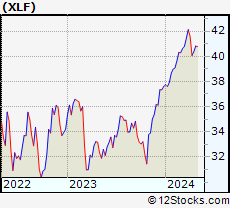
| Financial sector is composed of stocks
from banks, brokers, insurance, REITs
and services subsectors. Financial sector, as represented by XLF, an exchange-traded fund [ETF] that holds basket of Financial stocks (e.g, Bank of America, Goldman Sachs) is up by 13.0735% and is currently underperforming the overall market by -0.7866% year-to-date. Below is a quick view of Technical charts and trends: |
|
 XLF Weekly Chart |
|
| Long Term Trend: Good | |
| Medium Term Trend: Good | |
 XLF Daily Chart |
|
| Short Term Trend: Very Good | |
| Overall Trend Score: 90 | |
| YTD Performance: 13.0735% | |
| **Trend Scores & Views Are Only For Educational Purposes And Not For Investing | |
| 12Stocks.com: Top Performing Financial Sector Stocks | |||||||||||||||||||||||||||||||||||||||||||||||
 The top performing Financial sector stocks year to date are
Now, more recently, over last week, the top performing Financial sector stocks on the move are


|
|||||||||||||||||||||||||||||||||||||||||||||||
| 12Stocks.com: Investing in Financial Sector using Exchange Traded Funds | |
|
The following table shows list of key exchange traded funds (ETF) that
help investors track Financial Index. For detailed view, check out our ETF Funds section of our website. Quick View: Move mouse or cursor over ETF symbol (ticker) to view short-term Technical chart and over ETF name to view long term chart. Click on ticker or stock name for detailed view. Click on to add stock symbol to your watchlist and to view watchlist. |
12Stocks.com List of ETFs that track Financial Index
| Ticker | ETF Name | Watchlist | Recent Price | Smart Investing & Trading Score | Change % | Week % | Year-to-date % |
| CHIX | China Financials | | 10.57 | 20 | 0 | 0 | 0% |
| 12Stocks.com: Charts, Trends, Fundamental Data and Performances of Financial Stocks | |
|
We now take in-depth look at all Financial stocks including charts, multi-period performances and overall trends (as measured by Smart Investing & Trading Score). One can sort Financial stocks (click link to choose) by Daily, Weekly and by Year-to-Date performances. Also, one can sort by size of the company or by market capitalization. |
| Select Your Default Chart Type: | |||||
| |||||
| Click on stock symbol or name for detailed view. Click on to add stock symbol to your watchlist and to view watchlist. Quick View: Move mouse or cursor over "Daily" to quickly view daily Technical stock chart and over "Weekly" to view weekly Technical stock chart. | |||||

 | NNI Nelnet Inc |
| Sector: Financials | |
| SubSector: Credit Services | |
| MarketCap: 4659.55 Millions | |
| Recent Price: 128.37 Smart Investing & Trading Score: 70 | |
| Day Percent Change: 2.54014% Day Change: -1.14 | |
| Week Change: 4.66368% Year-to-date Change: 22.1% | |
| NNI Links: Profile News Message Board | |
| Charts:- Daily , Weekly | |
| Add NNI to Watchlist: View: Get Complete NNI Trend Analysis ➞ | |
 | FG F&G Annuities & Life Inc |
| Sector: Financials | |
| SubSector: Insurance - Life | |
| MarketCap: 4645.38 Millions | |
| Recent Price: 33.60 Smart Investing & Trading Score: 30 | |
| Day Percent Change: -0.621118% Day Change: 0.16 | |
| Week Change: -2.0979% Year-to-date Change: -17.3% | |
| FG Links: Profile News Message Board | |
| Charts:- Daily , Weekly | |
| Add FG to Watchlist: View: Get Complete FG Trend Analysis ➞ | |
 | WTM White Mountains Insurance Group, Ltd |
| Sector: Financials | |
| SubSector: Insurance - Property & Casualty | |
| MarketCap: 4625.07 Millions | |
| Recent Price: 1753.62 Smart Investing & Trading Score: 40 | |
| Day Percent Change: 1.77831% Day Change: 37.73 | |
| Week Change: -0.389666% Year-to-date Change: -9.0% | |
| WTM Links: Profile News Message Board | |
| Charts:- Daily , Weekly | |
| Add WTM to Watchlist: View: Get Complete WTM Trend Analysis ➞ | |
 | PVTB PrivateBancorp, Inc. |
| Sector: Financials | |
| SubSector: Regional - Midwest Banks | |
| MarketCap: 4588.68 Millions | |
| Recent Price: 9.66 Smart Investing & Trading Score: 0 | |
| Day Percent Change: -0.103413% Day Change: -9999 | |
| Week Change: -97.5405% Year-to-date Change: 0.0% | |
| PVTB Links: Profile News Message Board | |
| Charts:- Daily , Weekly | |
| Add PVTB to Watchlist: View: Get Complete PVTB Trend Analysis ➞ | |
 | SBRA Sabra Healthcare REIT Inc |
| Sector: Financials | |
| SubSector: REIT - Healthcare Facilities | |
| MarketCap: 4563.25 Millions | |
| Recent Price: 18.86 Smart Investing & Trading Score: 30 | |
| Day Percent Change: 0.855615% Day Change: 0.16 | |
| Week Change: -0.369783% Year-to-date Change: 14.6% | |
| SBRA Links: Profile News Message Board | |
| Charts:- Daily , Weekly | |
| Add SBRA to Watchlist: View: Get Complete SBRA Trend Analysis ➞ | |
 | BPY Brookfield Property Partners L.P. |
| Sector: Financials | |
| SubSector: Real Estate Development | |
| MarketCap: 4511.09 Millions | |
| Recent Price: 1.08 Smart Investing & Trading Score: 10 | |
| Day Percent Change: 0% Day Change: -9999 | |
| Week Change: 0% Year-to-date Change: 0.0% | |
| BPY Links: Profile News Message Board | |
| Charts:- Daily , Weekly | |
| Add BPY to Watchlist: View: Get Complete BPY Trend Analysis ➞ | |
 | NSA National Storage Affiliates Trust |
| Sector: Financials | |
| SubSector: REIT - Industrial | |
| MarketCap: 4502.32 Millions | |
| Recent Price: 30.62 Smart Investing & Trading Score: 10 | |
| Day Percent Change: -0.260586% Day Change: -0.07 | |
| Week Change: -4.13275% Year-to-date Change: -15.4% | |
| NSA Links: Profile News Message Board | |
| Charts:- Daily , Weekly | |
| Add NSA to Watchlist: View: Get Complete NSA Trend Analysis ➞ | |
 | VR Validus Holdings, Ltd. |
| Sector: Financials | |
| SubSector: Property & Casualty Insurance | |
| MarketCap: 4489.47 Millions | |
| Recent Price: 16.47 Smart Investing & Trading Score: 10 | |
| Day Percent Change: 0.304507% Day Change: -9999 | |
| Week Change: -35.6892% Year-to-date Change: 0.0% | |
| VR Links: Profile News Message Board | |
| Charts:- Daily , Weekly | |
| Add VR to Watchlist: View: Get Complete VR Trend Analysis ➞ | |
 | BANF Bancfirst Corp |
| Sector: Financials | |
| SubSector: Banks - Regional | |
| MarketCap: 4472.44 Millions | |
| Recent Price: 135.30 Smart Investing & Trading Score: 90 | |
| Day Percent Change: 3.18005% Day Change: -0.92 | |
| Week Change: 0.985222% Year-to-date Change: 17.5% | |
| BANF Links: Profile News Message Board | |
| Charts:- Daily , Weekly | |
| Add BANF to Watchlist: View: Get Complete BANF Trend Analysis ➞ | |
 | IBOC International Bancshares Corp |
| Sector: Financials | |
| SubSector: Banks - Regional | |
| MarketCap: 4449.16 Millions | |
| Recent Price: 70.95 Smart Investing & Trading Score: 50 | |
| Day Percent Change: 2.32189% Day Change: 0.4 | |
| Week Change: 0.141143% Year-to-date Change: 14.0% | |
| IBOC Links: Profile News Message Board | |
| Charts:- Daily , Weekly | |
| Add IBOC to Watchlist: View: Get Complete IBOC Trend Analysis ➞ | |
 | ASB Associated Banc-Corp |
| Sector: Financials | |
| SubSector: Banks - Regional | |
| MarketCap: 4418.19 Millions | |
| Recent Price: 26.55 Smart Investing & Trading Score: 70 | |
| Day Percent Change: 2.43056% Day Change: -0.12 | |
| Week Change: 1.0274% Year-to-date Change: 14.7% | |
| ASB Links: Profile News Message Board | |
| Charts:- Daily , Weekly | |
| Add ASB to Watchlist: View: Get Complete ASB Trend Analysis ➞ | |
 | CRVL Corvel Corp |
| Sector: Financials | |
| SubSector: Insurance Brokers | |
| MarketCap: 4386.21 Millions | |
| Recent Price: 82.97 Smart Investing & Trading Score: 30 | |
| Day Percent Change: 1.65401% Day Change: 1.13 | |
| Week Change: -3.12901% Year-to-date Change: -24.0% | |
| CRVL Links: Profile News Message Board | |
| Charts:- Daily , Weekly | |
| Add CRVL to Watchlist: View: Get Complete CRVL Trend Analysis ➞ | |
 | IRT Independence Realty Trust Inc |
| Sector: Financials | |
| SubSector: REIT - Residential | |
| MarketCap: 4325.25 Millions | |
| Recent Price: 17.06 Smart Investing & Trading Score: 20 | |
| Day Percent Change: 0.767868% Day Change: -0.12 | |
| Week Change: -1.8412% Year-to-date Change: -12.2% | |
| IRT Links: Profile News Message Board | |
| Charts:- Daily , Weekly | |
| Add IRT to Watchlist: View: Get Complete IRT Trend Analysis ➞ | |
 | SC Santander Consumer USA Holdings Inc. |
| Sector: Financials | |
| SubSector: Mortgage Investment | |
| MarketCap: 4318.79 Millions | |
| Recent Price: 45.94 Smart Investing & Trading Score: 70 | |
| Day Percent Change: -0.195525% Day Change: -9999 | |
| Week Change: 10.4592% Year-to-date Change: 0.0% | |
| SC Links: Profile News Message Board | |
| Charts:- Daily , Weekly | |
| Add SC to Watchlist: View: Get Complete SC Trend Analysis ➞ | |
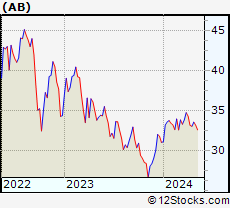 | AB AllianceBernstein Holding Lp |
| Sector: Financials | |
| SubSector: Asset Management | |
| MarketCap: 4294.94 Millions | |
| Recent Price: 38.81 Smart Investing & Trading Score: 40 | |
| Day Percent Change: 1.46405% Day Change: -0.34 | |
| Week Change: 2.78072% Year-to-date Change: 12.0% | |
| AB Links: Profile News Message Board | |
| Charts:- Daily , Weekly | |
| Add AB to Watchlist: View: Get Complete AB Trend Analysis ➞ | |
 | MCY Mercury General Corp |
| Sector: Financials | |
| SubSector: Insurance - Property & Casualty | |
| MarketCap: 4288.74 Millions | |
| Recent Price: 79.31 Smart Investing & Trading Score: 90 | |
| Day Percent Change: 2.12465% Day Change: 1.09 | |
| Week Change: 1.84924% Year-to-date Change: 21.9% | |
| MCY Links: Profile News Message Board | |
| Charts:- Daily , Weekly | |
| Add MCY to Watchlist: View: Get Complete MCY Trend Analysis ➞ | |
 | LM Legg Mason, Inc. |
| Sector: Financials | |
| SubSector: Asset Management | |
| MarketCap: 4162.13 Millions | |
| Recent Price: 222.84 Smart Investing & Trading Score: 70 | |
| Day Percent Change: 0.878225% Day Change: -9999 | |
| Week Change: 50.7203% Year-to-date Change: 0.0% | |
| LM Links: Profile News Message Board | |
| Charts:- Daily , Weekly | |
| Add LM to Watchlist: View: Get Complete LM Trend Analysis ➞ | |
 | RYN Rayonier Inc |
| Sector: Financials | |
| SubSector: REIT - Specialty | |
| MarketCap: 4123.84 Millions | |
| Recent Price: 26.03 Smart Investing & Trading Score: 40 | |
| Day Percent Change: 1.20529% Day Change: 0.38 | |
| Week Change: -0.572956% Year-to-date Change: 2.1% | |
| RYN Links: Profile News Message Board | |
| Charts:- Daily , Weekly | |
| Add RYN to Watchlist: View: Get Complete RYN Trend Analysis ➞ | |
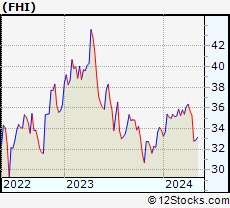 | FHI Federated Hermes Inc |
| Sector: Financials | |
| SubSector: Asset Management | |
| MarketCap: 4096.72 Millions | |
| Recent Price: 53.31 Smart Investing & Trading Score: 90 | |
| Day Percent Change: 1.44624% Day Change: -0.03 | |
| Week Change: 0.94679% Year-to-date Change: 33.5% | |
| FHI Links: Profile News Message Board | |
| Charts:- Daily , Weekly | |
| Add FHI to Watchlist: View: Get Complete FHI Trend Analysis ➞ | |
 | DNB Dun & Bradstreet Holdings Inc |
| Sector: Financials | |
| SubSector: Financial Data & Stock Exchanges | |
| MarketCap: 4082.63 Millions | |
| Recent Price: 9.15 Smart Investing & Trading Score: 80 | |
| Day Percent Change: 0.439078% Day Change: 0.01 | |
| Week Change: 0.660066% Year-to-date Change: -25.5% | |
| DNB Links: Profile News Message Board | |
| Charts:- Daily , Weekly | |
| Add DNB to Watchlist: View: Get Complete DNB Trend Analysis ➞ | |
 | EPR EPR Properties |
| Sector: Financials | |
| SubSector: REIT - Specialty | |
| MarketCap: 4053.97 Millions | |
| Recent Price: 56.87 Smart Investing & Trading Score: 40 | |
| Day Percent Change: 0.423804% Day Change: 0.49 | |
| Week Change: 3.19361% Year-to-date Change: 34.5% | |
| EPR Links: Profile News Message Board | |
| Charts:- Daily , Weekly | |
| Add EPR to Watchlist: View: Get Complete EPR Trend Analysis ➞ | |
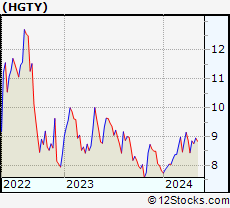 | HGTY Hagerty Inc |
| Sector: Financials | |
| SubSector: Insurance - Property & Casualty | |
| MarketCap: 4028.48 Millions | |
| Recent Price: 12.98 Smart Investing & Trading Score: 90 | |
| Day Percent Change: -0.30722% Day Change: -0.17 | |
| Week Change: 4.08982% Year-to-date Change: 31.4% | |
| HGTY Links: Profile News Message Board | |
| Charts:- Daily , Weekly | |
| Add HGTY to Watchlist: View: Get Complete HGTY Trend Analysis ➞ | |
 | COLD Americold Realty Trust Inc |
| Sector: Financials | |
| SubSector: REIT - Industrial | |
| MarketCap: 3978.63 Millions | |
| Recent Price: 12.99 Smart Investing & Trading Score: 0 | |
| Day Percent Change: -1.96226% Day Change: -0.24 | |
| Week Change: -1.59091% Year-to-date Change: -37.7% | |
| COLD Links: Profile News Message Board | |
| Charts:- Daily , Weekly | |
| Add COLD to Watchlist: View: Get Complete COLD Trend Analysis ➞ | |
 | TCBI Texas Capital Bancshares, Inc |
| Sector: Financials | |
| SubSector: Banks - Regional | |
| MarketCap: 3958.74 Millions | |
| Recent Price: 87.87 Smart Investing & Trading Score: 80 | |
| Day Percent Change: 3.04914% Day Change: -0.39 | |
| Week Change: 0.733693% Year-to-date Change: 14.4% | |
| TCBI Links: Profile News Message Board | |
| Charts:- Daily , Weekly | |
| Add TCBI to Watchlist: View: Get Complete TCBI Trend Analysis ➞ | |
 | SKT Tanger Inc |
| Sector: Financials | |
| SubSector: REIT - Retail | |
| MarketCap: 3936.19 Millions | |
| Recent Price: 33.81 Smart Investing & Trading Score: 60 | |
| Day Percent Change: -0.441696% Day Change: -0.24 | |
| Week Change: -0.937592% Year-to-date Change: 2.2% | |
| SKT Links: Profile News Message Board | |
| Charts:- Daily , Weekly | |
| Add SKT to Watchlist: View: Get Complete SKT Trend Analysis ➞ | |
| For tabular summary view of above stock list: Summary View ➞ 0 - 25 , 25 - 50 , 50 - 75 , 75 - 100 , 100 - 125 , 125 - 150 , 150 - 175 , 175 - 200 , 200 - 225 , 225 - 250 , 250 - 275 , 275 - 300 , 300 - 325 , 325 - 350 , 350 - 375 , 375 - 400 , 400 - 425 , 425 - 450 , 450 - 475 , 475 - 500 , 500 - 525 , 525 - 550 , 550 - 575 , 575 - 600 , 600 - 625 , 625 - 650 , 650 - 675 , 675 - 700 , 700 - 725 , 725 - 750 , 750 - 775 , 775 - 800 , 800 - 825 , 825 - 850 , 850 - 875 , 875 - 900 , 900 - 925 , 925 - 950 , 950 - 975 , 975 - 1000 , 1000 - 1025 , 1025 - 1050 , 1050 - 1075 , 1075 - 1100 , 1100 - 1125 , 1125 - 1150 , 1150 - 1175 , 1175 - 1200 , 1200 - 1225 , 1225 - 1250 , 1250 - 1275 , 1275 - 1300 , 1300 - 1325 , 1325 - 1350 , 1350 - 1375 , 1375 - 1400 , 1400 - 1425 , 1425 - 1450 , 1450 - 1475 , 1475 - 1500 , 1500 - 1525 , 1525 - 1550 | ||
| Click To Change The Sort Order: By Market Cap or Company Size Performance: Year-to-date, Week and Day | |
| Select Chart Type: | ||
|
Best Stocks Today 12Stocks.com |
© 2025 12Stocks.com Terms & Conditions Privacy Contact Us
All Information Provided Only For Education And Not To Be Used For Investing or Trading. See Terms & Conditions


One More Thing ... Get Best Stocks Delivered Daily!
Never Ever Miss A Move With Our Top Ten Stocks Lists
Find Best Stocks In Any Market - Bull or Bear Market
Take A Peek At Our Top Ten Stocks Lists: Daily, Weekly, Year-to-Date & Top Trends
Find Best Stocks In Any Market - Bull or Bear Market
Take A Peek At Our Top Ten Stocks Lists: Daily, Weekly, Year-to-Date & Top Trends
Financial Stocks With Best Up Trends [0-bearish to 100-bullish]: Better Home[100], AMREP Corp[100], PIMCO California[100], Torchmark [100], PIMCO California[100], Triumph Bancorp[100], StepStone [100], Radian [100], National Bank[100], PIMCO Municipal[100], MARA [100]
Best Financial Stocks Year-to-Date:
Insight Select[12384.6%], Oxford Lane[292.479%], Better Home[250.328%], Metalpha Technology[213.274%], Robinhood Markets[206.567%], Cipher Mining[145.528%], Mr. Cooper[133.957%], Banco Santander[130.037%], IHS Holding[117.61%], Deutsche Bank[114.776%], LoanDepot [110.733%] Best Financial Stocks This Week:
Colony Starwood[15929900%], Blackhawk Network[91300%], Macquarie Global[81662.9%], Credit Suisse[63241.6%], Pennsylvania Real[23823%], First Republic[22570.9%], Select ome[14000%], CorEnergy Infrastructure[6797.78%], FedNat Holding[5525%], BlackRock Municipal[5340%], BlackRock MuniYield[3379.04%] Best Financial Stocks Daily:
Better Home[13.3451%], AMREP Corp[11.992%], PIMCO California[11.9545%], Torchmark [11.8363%], Forge Global[11.5409%], PIMCO California[11.4754%], BlackRock Muni[10.8108%], Blackrock MuniYield[10.72%], Triumph Bancorp[10.2661%], StepStone [8.74771%], BlackRock MuniYield[8.15348%]