
 Login Sign Up


| |||||
 |  | ||||

| 12Stocks.com Market Intelligence |
Best Financial Stocks
| In a hurry? Financial Stocks Lists: Performance Trends Table, Stock Charts
Sort Financial stocks: Daily, Weekly, Year-to-Date, Market Cap & Trends. Filter Financial stocks list by size:All Financial Large Mid-Range Small & MicroCap |
| 12Stocks.com Financial Stocks Performances & Trends Daily | |||||||||
|
|  The overall Smart Investing & Trading Score is 90 (0-bearish to 100-bullish) which puts Financial sector in short term bullish trend. The Smart Investing & Trading Score from previous trading session is 60 and an improvement of trend continues.
| ||||||||
Here are the Smart Investing & Trading Scores of the most requested Financial stocks at 12Stocks.com (click stock name for detailed review):
|


| 12Stocks.com: Investing in Financial sector with Stocks | |
|
The following table helps investors and traders sort through current performance and trends (as measured by Smart Investing & Trading Score) of various
stocks in the Financial sector. Quick View: Move mouse or cursor over stock symbol (ticker) to view short-term Technical chart and over stock name to view long term chart. Click on  to add stock symbol to your watchlist and to add stock symbol to your watchlist and  to view watchlist. Click on any ticker or stock name for detailed market intelligence report for that stock. to view watchlist. Click on any ticker or stock name for detailed market intelligence report for that stock. |
12Stocks.com Performance of Stocks in Financial Sector
| Ticker | Stock Name | Watchlist | Category | Recent Price | Trend Score | Change % | YTD Change% |
| LUK | Leucadia National |   | Brokerage | 23.47 | 10 | 0.00% | 0.00% |
| CUBE | CubeSmart | | REIT - Industrial | 40.79 | 30 | -1.04% | 0.49% |
| WTFC | Wintrust | | Banks - Regional | 136.74 | 70 | 2.04% | 11.62% |
| TMK | Torchmark | | Life Insurance | 105.73 | 100 | 11.84% | 0.00% |
| DFS | Discover | | Credit Services | 200.05 | 60 | -0.21% | 15.24% |
| FSV | FirstService Corp | | Real Estate Services | 201.60 | 50 | -0.79% | 13.07% |
| RE | Everest Re | | Insurance | 351.28 | 20 | 0.00% | 0.00% |
| EGP | East Properties | | REIT - Industrial | 168.42 | 60 | 1.49% | 8.20% |
| ONB | Old National | | Banks - Regional | 22.56 | 40 | 2.64% | 7.96% |
| FRT | Federal Realty | | REIT - Retail | 100.22 | 30 | 0.94% | -5.88% |
| PRI | Primerica | | Insurance - Life | 272.60 | 70 | 0.61% | 1.07% |
| CMA | Comerica | | Banks - Regional | 70.34 | 70 | 1.08% | 17.36% |
| BRX | Brixmor Property | | REIT - Retail | 27.84 | 60 | 0.14% | 4.47% |
| VNO | Vornado Realty | | REIT - Office | 41.92 | 60 | 1.75% | -1.64% |
| BPOP | Popular | | Banks - Regional | 127.82 | 90 | 2.13% | 39.84% |
| SIVB | SVB | | Regional Banks | 106.04 | 10 | 0.00% | 0.00% |
| CIGI | Colliers | | Real Estate Services | 166.32 | 50 | 0.66% | 23.92% |
| MGP | MGM Growth | | REIT | 113.93 | 70 | 0.94% | 0.00% |
| ZION | Zions Ban | | Banks - Regional | 59.15 | 100 | 2.87% | 11.21% |
| AGNCN | AGNC | | Mortgage | 25.90 | 80 | 0.39% | 5.33% |
| CFR | Cullen Frost | | Banks - Regional | 128.74 | 40 | 2.02% | -1.59% |
| HLNE | Hamilton Lane | | Asset Mgmt | 150.99 | 60 | 3.32% | 1.99% |
| NNN | NNN REIT | | REIT - Retail | 42.28 | 10 | -0.68% | 10.06% |
| ADC | Agree Realty | | REIT - Retail | 71.53 | 0 | -0.63% | 5.06% |
| CBSH | Commerce Bancshares | | Banks - Regional | 60.25 | 40 | 1.69% | -1.55% |
| For chart view version of above stock list: Chart View ➞ 0 - 25 , 25 - 50 , 50 - 75 , 75 - 100 , 100 - 125 , 125 - 150 , 150 - 175 , 175 - 200 , 200 - 225 , 225 - 250 , 250 - 275 , 275 - 300 , 300 - 325 , 325 - 350 , 350 - 375 , 375 - 400 , 400 - 425 , 425 - 450 , 450 - 475 , 475 - 500 , 500 - 525 , 525 - 550 , 550 - 575 , 575 - 600 , 600 - 625 , 625 - 650 , 650 - 675 , 675 - 700 , 700 - 725 , 725 - 750 , 750 - 775 , 775 - 800 , 800 - 825 , 825 - 850 , 850 - 875 , 875 - 900 , 900 - 925 , 925 - 950 , 950 - 975 , 975 - 1000 , 1000 - 1025 , 1025 - 1050 , 1050 - 1075 , 1075 - 1100 , 1100 - 1125 , 1125 - 1150 , 1150 - 1175 , 1175 - 1200 , 1200 - 1225 , 1225 - 1250 , 1250 - 1275 , 1275 - 1300 , 1300 - 1325 , 1325 - 1350 , 1350 - 1375 , 1375 - 1400 , 1400 - 1425 , 1425 - 1450 , 1450 - 1475 , 1475 - 1500 , 1500 - 1525 , 1525 - 1550 | ||
 | Click To Change The Sort Order: By Market Cap or Company Size Performance: Year-to-date, Week and Day |  |
|
Get the most comprehensive stock market coverage daily at 12Stocks.com ➞ Best Stocks Today ➞ Best Stocks Weekly ➞ Best Stocks Year-to-Date ➞ Best Stocks Trends ➞  Best Stocks Today 12Stocks.com Best Nasdaq Stocks ➞ Best S&P 500 Stocks ➞ Best Tech Stocks ➞ Best Biotech Stocks ➞ |
| Detailed Overview of Financial Stocks |
| Financial Technical Overview, Leaders & Laggards, Top Financial ETF Funds & Detailed Financial Stocks List, Charts, Trends & More |
| Financial Sector: Technical Analysis, Trends & YTD Performance | |
| Financial sector is composed of stocks
from banks, brokers, insurance, REITs
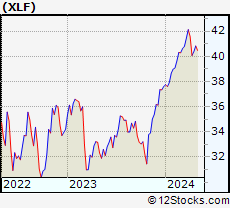
and services subsectors. Financial sector, as represented by XLF, an exchange-traded fund [ETF] that holds basket of Financial stocks (e.g, Bank of America, Goldman Sachs) is up by 13.0735% and is currently underperforming the overall market by -0.7866% year-to-date. Below is a quick view of Technical charts and trends: |
|
 XLF Weekly Chart |
|
| Long Term Trend: Good | |
| Medium Term Trend: Good | |
 XLF Daily Chart |
|
| Short Term Trend: Very Good | |
| Overall Trend Score: 90 | |
| YTD Performance: 13.0735% | |
| **Trend Scores & Views Are Only For Educational Purposes And Not For Investing | |
| 12Stocks.com: Top Performing Financial Sector Stocks | |||||||||||||||||||||||||||||||||||||||||||||||
 The top performing Financial sector stocks year to date are
Now, more recently, over last week, the top performing Financial sector stocks on the move are


|
|||||||||||||||||||||||||||||||||||||||||||||||
| 12Stocks.com: Investing in Financial Sector using Exchange Traded Funds | |
|
The following table shows list of key exchange traded funds (ETF) that
help investors track Financial Index. For detailed view, check out our ETF Funds section of our website. Quick View: Move mouse or cursor over ETF symbol (ticker) to view short-term Technical chart and over ETF name to view long term chart. Click on ticker or stock name for detailed view. Click on to add stock symbol to your watchlist and to view watchlist. |
12Stocks.com List of ETFs that track Financial Index
| Ticker | ETF Name | Watchlist | Recent Price | Smart Investing & Trading Score | Change % | Week % | Year-to-date % |
| CHIX | China Financials | | 10.57 | 20 | 0 | 0 | 0% |
| 12Stocks.com: Charts, Trends, Fundamental Data and Performances of Financial Stocks | |
|
We now take in-depth look at all Financial stocks including charts, multi-period performances and overall trends (as measured by Smart Investing & Trading Score). One can sort Financial stocks (click link to choose) by Daily, Weekly and by Year-to-Date performances. Also, one can sort by size of the company or by market capitalization. |
| Select Your Default Chart Type: | |||||
| |||||
| Click on stock symbol or name for detailed view. Click on to add stock symbol to your watchlist and to view watchlist. Quick View: Move mouse or cursor over "Daily" to quickly view daily Technical stock chart and over "Weekly" to view weekly Technical stock chart. | |||||

 | LUK Leucadia National Corporation |
| Sector: Financials | |
| SubSector: Investment Brokerage - National | |
| MarketCap: 9693.28 Millions | |
| Recent Price: 23.47 Smart Investing & Trading Score: 10 | |
| Day Percent Change: 0% Day Change: -9999 | |
| Week Change: 0% Year-to-date Change: 0.0% | |
| LUK Links: Profile News Message Board | |
| Charts:- Daily , Weekly | |
| Add LUK to Watchlist: View: Get Complete LUK Trend Analysis ➞ | |
 | CUBE CubeSmart |
| Sector: Financials | |
| SubSector: REIT - Industrial | |
| MarketCap: 9564.24 Millions | |
| Recent Price: 40.79 Smart Investing & Trading Score: 30 | |
| Day Percent Change: -1.04318% Day Change: -0.44 | |
| Week Change: 0.171906% Year-to-date Change: 0.5% | |
| CUBE Links: Profile News Message Board | |
| Charts:- Daily , Weekly | |
| Add CUBE to Watchlist: View: Get Complete CUBE Trend Analysis ➞ | |
 | WTFC Wintrust Financial Corp |
| Sector: Financials | |
| SubSector: Banks - Regional | |
| MarketCap: 9341.85 Millions | |
| Recent Price: 136.74 Smart Investing & Trading Score: 70 | |
| Day Percent Change: 2.04478% Day Change: 2.58 | |
| Week Change: -0.197066% Year-to-date Change: 11.6% | |
| WTFC Links: Profile News Message Board | |
| Charts:- Daily , Weekly | |
| Add WTFC to Watchlist: View: Get Complete WTFC Trend Analysis ➞ | |
 | TMK Torchmark Corporation |
| Sector: Financials | |
| SubSector: Life Insurance | |
| MarketCap: 9244.53 Millions | |
| Recent Price: 105.73 Smart Investing & Trading Score: 100 | |
| Day Percent Change: 11.8363% Day Change: -9999 | |
| Week Change: 471.514% Year-to-date Change: 0.0% | |
| TMK Links: Profile News Message Board | |
| Charts:- Daily , Weekly | |
| Add TMK to Watchlist: View: Get Complete TMK Trend Analysis ➞ | |
 | DFS Discover Financial Services |
| Sector: Financials | |
| SubSector: Credit Services | |
| MarketCap: 9228.88 Millions | |
| Recent Price: 200.05 Smart Investing & Trading Score: 60 | |
| Day Percent Change: -0.214485% Day Change: -9999 | |
| Week Change: 4.17643% Year-to-date Change: 15.2% | |
| DFS Links: Profile News Message Board | |
| Charts:- Daily , Weekly | |
| Add DFS to Watchlist: View: Get Complete DFS Trend Analysis ➞ | |
 | FSV FirstService Corp |
| Sector: Financials | |
| SubSector: Real Estate Services | |
| MarketCap: 9181.97 Millions | |
| Recent Price: 201.60 Smart Investing & Trading Score: 50 | |
| Day Percent Change: -0.792284% Day Change: -1.98 | |
| Week Change: -1.46628% Year-to-date Change: 13.1% | |
| FSV Links: Profile News Message Board | |
| Charts:- Daily , Weekly | |
| Add FSV to Watchlist: View: Get Complete FSV Trend Analysis ➞ | |
 | RE Everest Re Group, Ltd. |
| Sector: Financials | |
| SubSector: Property & Casualty Insurance | |
| MarketCap: 9018.12 Millions | |
| Recent Price: 351.28 Smart Investing & Trading Score: 20 | |
| Day Percent Change: 0% Day Change: -9999 | |
| Week Change: 0% Year-to-date Change: 0.0% | |
| RE Links: Profile News Message Board | |
| Charts:- Daily , Weekly | |
| Add RE to Watchlist: View: Get Complete RE Trend Analysis ➞ | |
 | EGP Eastgroup Properties, Inc |
| Sector: Financials | |
| SubSector: REIT - Industrial | |
| MarketCap: 8969.25 Millions | |
| Recent Price: 168.42 Smart Investing & Trading Score: 60 | |
| Day Percent Change: 1.49452% Day Change: 2.05 | |
| Week Change: 3.02178% Year-to-date Change: 8.2% | |
| EGP Links: Profile News Message Board | |
| Charts:- Daily , Weekly | |
| Add EGP to Watchlist: View: Get Complete EGP Trend Analysis ➞ | |
 | ONB Old National Bancorp |
| Sector: Financials | |
| SubSector: Banks - Regional | |
| MarketCap: 8942.13 Millions | |
| Recent Price: 22.56 Smart Investing & Trading Score: 40 | |
| Day Percent Change: 2.63876% Day Change: -0.2 | |
| Week Change: 0.311249% Year-to-date Change: 8.0% | |
| ONB Links: Profile News Message Board | |
| Charts:- Daily , Weekly | |
| Add ONB to Watchlist: View: Get Complete ONB Trend Analysis ➞ | |
 | FRT Federal Realty Investment Trust |
| Sector: Financials | |
| SubSector: REIT - Retail | |
| MarketCap: 8919.28 Millions | |
| Recent Price: 100.22 Smart Investing & Trading Score: 30 | |
| Day Percent Change: 0.93665% Day Change: 1.15 | |
| Week Change: -0.22897% Year-to-date Change: -5.9% | |
| FRT Links: Profile News Message Board | |
| Charts:- Daily , Weekly | |
| Add FRT to Watchlist: View: Get Complete FRT Trend Analysis ➞ | |
 | PRI Primerica Inc |
| Sector: Financials | |
| SubSector: Insurance - Life | |
| MarketCap: 8850.93 Millions | |
| Recent Price: 272.60 Smart Investing & Trading Score: 70 | |
| Day Percent Change: 0.608968% Day Change: 3.27 | |
| Week Change: 1.03781% Year-to-date Change: 1.1% | |
| PRI Links: Profile News Message Board | |
| Charts:- Daily , Weekly | |
| Add PRI to Watchlist: View: Get Complete PRI Trend Analysis ➞ | |
 | CMA Comerica, Inc |
| Sector: Financials | |
| SubSector: Banks - Regional | |
| MarketCap: 8850.26 Millions | |
| Recent Price: 70.34 Smart Investing & Trading Score: 70 | |
| Day Percent Change: 1.07774% Day Change: 0.79 | |
| Week Change: 1.57401% Year-to-date Change: 17.4% | |
| CMA Links: Profile News Message Board | |
| Charts:- Daily , Weekly | |
| Add CMA to Watchlist: View: Get Complete CMA Trend Analysis ➞ | |
 | BRX Brixmor Property Group Inc |
| Sector: Financials | |
| SubSector: REIT - Retail | |
| MarketCap: 8632.01 Millions | |
| Recent Price: 27.84 Smart Investing & Trading Score: 60 | |
| Day Percent Change: 0.143885% Day Change: 0.08 | |
| Week Change: 0.179921% Year-to-date Change: 4.5% | |
| BRX Links: Profile News Message Board | |
| Charts:- Daily , Weekly | |
| Add BRX to Watchlist: View: Get Complete BRX Trend Analysis ➞ | |
 | VNO Vornado Realty Trust |
| Sector: Financials | |
| SubSector: REIT - Office | |
| MarketCap: 8619.24 Millions | |
| Recent Price: 41.92 Smart Investing & Trading Score: 60 | |
| Day Percent Change: 1.74757% Day Change: 0.86 | |
| Week Change: 3.65974% Year-to-date Change: -1.6% | |
| VNO Links: Profile News Message Board | |
| Charts:- Daily , Weekly | |
| Add VNO to Watchlist: View: Get Complete VNO Trend Analysis ➞ | |
 | BPOP Popular Inc |
| Sector: Financials | |
| SubSector: Banks - Regional | |
| MarketCap: 8470.83 Millions | |
| Recent Price: 127.82 Smart Investing & Trading Score: 90 | |
| Day Percent Change: 2.12528% Day Change: 2.41 | |
| Week Change: 2.28873% Year-to-date Change: 39.8% | |
| BPOP Links: Profile News Message Board | |
| Charts:- Daily , Weekly | |
| Add BPOP to Watchlist: View: Get Complete BPOP Trend Analysis ➞ | |
 | SIVB SVB Financial Group |
| Sector: Financials | |
| SubSector: Regional - Pacific Banks | |
| MarketCap: 8432.89 Millions | |
| Recent Price: 106.04 Smart Investing & Trading Score: 10 | |
| Day Percent Change: 0% Day Change: -9999 | |
| Week Change: 0% Year-to-date Change: 0.0% | |
| SIVB Links: Profile News Message Board | |
| Charts:- Daily , Weekly | |
| Add SIVB to Watchlist: View: Get Complete SIVB Trend Analysis ➞ | |
 | CIGI Colliers International Group Inc |
| Sector: Financials | |
| SubSector: Real Estate Services | |
| MarketCap: 8395.83 Millions | |
| Recent Price: 166.32 Smart Investing & Trading Score: 50 | |
| Day Percent Change: 0.659687% Day Change: 0.03 | |
| Week Change: 0.650549% Year-to-date Change: 23.9% | |
| CIGI Links: Profile News Message Board | |
| Charts:- Daily , Weekly | |
| Add CIGI to Watchlist: View: Get Complete CIGI Trend Analysis ➞ | |
 | MGP MGM Growth Properties LLC |
| Sector: Financials | |
| SubSector: REIT - Hotel/Motel | |
| MarketCap: 8361.04 Millions | |
| Recent Price: 113.93 Smart Investing & Trading Score: 70 | |
| Day Percent Change: 0.939134% Day Change: -9999 | |
| Week Change: 173.607% Year-to-date Change: 0.0% | |
| MGP Links: Profile News Message Board | |
| Charts:- Daily , Weekly | |
| Add MGP to Watchlist: View: Get Complete MGP Trend Analysis ➞ | |
 | ZION Zions Bancorporation N.A |
| Sector: Financials | |
| SubSector: Banks - Regional | |
| MarketCap: 8343.7 Millions | |
| Recent Price: 59.15 Smart Investing & Trading Score: 100 | |
| Day Percent Change: 2.86957% Day Change: 1.55 | |
| Week Change: 2.01794% Year-to-date Change: 11.2% | |
| ZION Links: Profile News Message Board | |
| Charts:- Daily , Weekly | |
| Add ZION to Watchlist: View: Get Complete ZION Trend Analysis ➞ | |
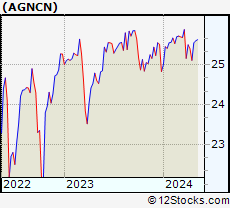 | AGNCN AGNC Investment Corp. |
| Sector: Financials | |
| SubSector: Mortgage Investment | |
| MarketCap: 8280.89 Millions | |
| Recent Price: 25.90 Smart Investing & Trading Score: 80 | |
| Day Percent Change: 0.387597% Day Change: -0.07 | |
| Week Change: 0.271003% Year-to-date Change: 5.3% | |
| AGNCN Links: Profile News Message Board | |
| Charts:- Daily , Weekly | |
| Add AGNCN to Watchlist: View: Get Complete AGNCN Trend Analysis ➞ | |
 | CFR Cullen Frost Bankers Inc |
| Sector: Financials | |
| SubSector: Banks - Regional | |
| MarketCap: 8242.64 Millions | |
| Recent Price: 128.74 Smart Investing & Trading Score: 40 | |
| Day Percent Change: 2.02076% Day Change: 2.66 | |
| Week Change: 2.14218% Year-to-date Change: -1.6% | |
| CFR Links: Profile News Message Board | |
| Charts:- Daily , Weekly | |
| Add CFR to Watchlist: View: Get Complete CFR Trend Analysis ➞ | |
 | HLNE Hamilton Lane Inc |
| Sector: Financials | |
| SubSector: Asset Management | |
| MarketCap: 8191.13 Millions | |
| Recent Price: 150.99 Smart Investing & Trading Score: 60 | |
| Day Percent Change: 3.32238% Day Change: -0.56 | |
| Week Change: 1.16248% Year-to-date Change: 2.0% | |
| HLNE Links: Profile News Message Board | |
| Charts:- Daily , Weekly | |
| Add HLNE to Watchlist: View: Get Complete HLNE Trend Analysis ➞ | |
 | NNN NNN REIT Inc |
| Sector: Financials | |
| SubSector: REIT - Retail | |
| MarketCap: 8183.69 Millions | |
| Recent Price: 42.28 Smart Investing & Trading Score: 10 | |
| Day Percent Change: -0.681231% Day Change: -0.19 | |
| Week Change: -0.937207% Year-to-date Change: 10.1% | |
| NNN Links: Profile News Message Board | |
| Charts:- Daily , Weekly | |
| Add NNN to Watchlist: View: Get Complete NNN Trend Analysis ➞ | |
 | ADC Agree Realty Corp |
| Sector: Financials | |
| SubSector: REIT - Retail | |
| MarketCap: 8084.16 Millions | |
| Recent Price: 71.53 Smart Investing & Trading Score: 0 | |
| Day Percent Change: -0.625174% Day Change: -0.18 | |
| Week Change: -0.611366% Year-to-date Change: 5.1% | |
| ADC Links: Profile News Message Board | |
| Charts:- Daily , Weekly | |
| Add ADC to Watchlist: View: Get Complete ADC Trend Analysis ➞ | |
 | CBSH Commerce Bancshares, Inc |
| Sector: Financials | |
| SubSector: Banks - Regional | |
| MarketCap: 8083.73 Millions | |
| Recent Price: 60.25 Smart Investing & Trading Score: 40 | |
| Day Percent Change: 1.68776% Day Change: 0.92 | |
| Week Change: 0.550734% Year-to-date Change: -1.5% | |
| CBSH Links: Profile News Message Board | |
| Charts:- Daily , Weekly | |
| Add CBSH to Watchlist: View: Get Complete CBSH Trend Analysis ➞ | |
| For tabular summary view of above stock list: Summary View ➞ 0 - 25 , 25 - 50 , 50 - 75 , 75 - 100 , 100 - 125 , 125 - 150 , 150 - 175 , 175 - 200 , 200 - 225 , 225 - 250 , 250 - 275 , 275 - 300 , 300 - 325 , 325 - 350 , 350 - 375 , 375 - 400 , 400 - 425 , 425 - 450 , 450 - 475 , 475 - 500 , 500 - 525 , 525 - 550 , 550 - 575 , 575 - 600 , 600 - 625 , 625 - 650 , 650 - 675 , 675 - 700 , 700 - 725 , 725 - 750 , 750 - 775 , 775 - 800 , 800 - 825 , 825 - 850 , 850 - 875 , 875 - 900 , 900 - 925 , 925 - 950 , 950 - 975 , 975 - 1000 , 1000 - 1025 , 1025 - 1050 , 1050 - 1075 , 1075 - 1100 , 1100 - 1125 , 1125 - 1150 , 1150 - 1175 , 1175 - 1200 , 1200 - 1225 , 1225 - 1250 , 1250 - 1275 , 1275 - 1300 , 1300 - 1325 , 1325 - 1350 , 1350 - 1375 , 1375 - 1400 , 1400 - 1425 , 1425 - 1450 , 1450 - 1475 , 1475 - 1500 , 1500 - 1525 , 1525 - 1550 | ||
| Click To Change The Sort Order: By Market Cap or Company Size Performance: Year-to-date, Week and Day | |
| Select Chart Type: | ||
|
Best Stocks Today 12Stocks.com |
© 2025 12Stocks.com Terms & Conditions Privacy Contact Us
All Information Provided Only For Education And Not To Be Used For Investing or Trading. See Terms & Conditions


One More Thing ... Get Best Stocks Delivered Daily!
Never Ever Miss A Move With Our Top Ten Stocks Lists
Find Best Stocks In Any Market - Bull or Bear Market
Take A Peek At Our Top Ten Stocks Lists: Daily, Weekly, Year-to-Date & Top Trends
Find Best Stocks In Any Market - Bull or Bear Market
Take A Peek At Our Top Ten Stocks Lists: Daily, Weekly, Year-to-Date & Top Trends
Financial Stocks With Best Up Trends [0-bearish to 100-bullish]: Better Home[100], AMREP Corp[100], PIMCO California[100], Torchmark [100], PIMCO California[100], Triumph Bancorp[100], StepStone [100], Radian [100], National Bank[100], PIMCO Municipal[100], MARA [100]
Best Financial Stocks Year-to-Date:
Insight Select[12384.6%], Oxford Lane[292.479%], Better Home[250.328%], Metalpha Technology[213.274%], Robinhood Markets[206.567%], Cipher Mining[145.528%], Mr. Cooper[133.957%], Banco Santander[130.037%], IHS Holding[117.61%], Deutsche Bank[114.776%], LoanDepot [110.733%] Best Financial Stocks This Week:
Colony Starwood[15929900%], Blackhawk Network[91300%], Macquarie Global[81662.9%], Credit Suisse[63241.6%], Pennsylvania Real[23823%], First Republic[22570.9%], Select ome[14000%], CorEnergy Infrastructure[6797.78%], FedNat Holding[5525%], BlackRock Municipal[5340%], BlackRock MuniYield[3379.04%] Best Financial Stocks Daily:
Better Home[13.3451%], AMREP Corp[11.992%], PIMCO California[11.9545%], Torchmark [11.8363%], Forge Global[11.5409%], PIMCO California[11.4754%], BlackRock Muni[10.8108%], Blackrock MuniYield[10.72%], Triumph Bancorp[10.2661%], StepStone [8.74771%], BlackRock MuniYield[8.15348%]