
 Login Sign Up


| |||||
 |  | ||||

| 12Stocks.com Market Intelligence |
Best Financial Stocks
| In a hurry? Financial Stocks Lists: Performance Trends Table, Stock Charts
Sort Financial stocks: Daily, Weekly, Year-to-Date, Market Cap & Trends. Filter Financial stocks list by size:All Financial Large Mid-Range Small & MicroCap |
| 12Stocks.com Financial Stocks Performances & Trends Daily | |||||||||
|
|  The overall Smart Investing & Trading Score is 20 (0-bearish to 100-bullish) which puts Financial sector in short term bearish trend. The Smart Investing & Trading Score from previous trading session is 30 and a deterioration of trend continues.
| ||||||||
Here are the Smart Investing & Trading Scores of the most requested Financial stocks at 12Stocks.com (click stock name for detailed review):
|


| 12Stocks.com: Investing in Financial sector with Stocks | |
|
The following table helps investors and traders sort through current performance and trends (as measured by Smart Investing & Trading Score) of various
stocks in the Financial sector. Quick View: Move mouse or cursor over stock symbol (ticker) to view short-term Technical chart and over stock name to view long term chart. Click on  to add stock symbol to your watchlist and to add stock symbol to your watchlist and  to view watchlist. Click on any ticker or stock name for detailed market intelligence report for that stock. to view watchlist. Click on any ticker or stock name for detailed market intelligence report for that stock. |
12Stocks.com Performance of Stocks in Financial Sector
| Ticker | Stock Name | Watchlist | Category | Recent Price | Trend Score | Change % | YTD Change% |
| AEG | Aegon |   | Insurance - | 7.89 | 40 | -0.25% | 37.87% |
| SLMBP | SLM | | Credit Services | 76.34 | 80 | 1.23% | 7.52% |
| AFG | American | | Insurance - Property & Casualty | 147.10 | 100 | 0.41% | 12.43% |
| SF | Stifel | | Capital Markets | 112.09 | 0 | 0.25% | 6.60% |
| RNR | RenaissanceRe | | Insurance - Reinsurance | 255.75 | 100 | -0.28% | 3.12% |
| GL | Globe Life | | Insurance - Life | 139.44 | 10 | -1.09% | 25.04% |
| FHN | First Horizon | | Banks - Regional | 22.47 | 20 | 0.49% | 14.13% |
| DRE | Duke Realty | | REIT - Industrial | 85.32 | 80 | 0.14% | 0.00% |
| MORN | Morningstar | | Financial Data & Stock Exchanges | 226.26 | 0 | -0.33% | -31.62% |
| AGNC | AGNC | | REIT - Mortgage | 10.02 | 80 | 0.91% | 17.96% |
| SEIC | SEI s | | Asset Mgmt | 84.86 | 10 | 0.94% | 4.18% |
| AIZ | Assurant | | Insurance - Property & Casualty | 218.36 | 100 | 0.40% | 4.08% |
| BSMX | Grupo Financiero | | Foreign Banks | 75.54 | 70 | 0.32% | 0.00% |
| KNSL | Kinsale Capital | | Insurance - Property & Casualty | 442.56 | 80 | 6.00% | -2.45% |
| XL | XL | | Insurance | 75.54 | 70 | 0.32% | 0.00% |
| SSB | SouthState Bank | | Banks - Regional | 97.95 | 20 | -0.52% | 2.77% |
| FRHC | Freedom Holding | | Financial Conglomerates | 172.67 | 50 | 3.05% | 29.58% |
| APSG | Apollo Strategic | | SPAC | 7.39 | 0 | -2.12% | 0.00% |
| WBS | Webster | | Banks - Regional | 58.96 | 20 | -0.05% | 9.95% |
| CIIC | CIIG Merger | | SPAC | 9.81 | 20 | 0.10% | 0.00% |
| REXR | Rexford Industrial | | REIT - Industrial | 41.36 | 60 | -1.15% | 10.15% |
| ORI | Old Republic | | Insurance - Property & Casualty | 42.87 | 100 | 0.23% | 27.96% |
| WAL | Western Alliance | | Banks - Regional | 85.48 | 10 | -0.62% | 4.06% |
| XP | XP | | Capital Markets | 17.57 | 20 | -3.62% | 48.77% |
| IVZ | Invesco | | Asset Mgmt | 23.61 | 90 | 2.25% | 37.11% |
| For chart view version of above stock list: Chart View ➞ 0 - 25 , 25 - 50 , 50 - 75 , 75 - 100 , 100 - 125 , 125 - 150 , 150 - 175 , 175 - 200 , 200 - 225 , 225 - 250 , 250 - 275 , 275 - 300 , 300 - 325 , 325 - 350 , 350 - 375 , 375 - 400 , 400 - 425 , 425 - 450 , 450 - 475 , 475 - 500 , 500 - 525 , 525 - 550 , 550 - 575 , 575 - 600 , 600 - 625 , 625 - 650 , 650 - 675 , 675 - 700 , 700 - 725 , 725 - 750 , 750 - 775 , 775 - 800 , 800 - 825 , 825 - 850 , 850 - 875 , 875 - 900 , 900 - 925 , 925 - 950 , 950 - 975 , 975 - 1000 , 1000 - 1025 , 1025 - 1050 , 1050 - 1075 , 1075 - 1100 , 1100 - 1125 , 1125 - 1150 , 1150 - 1175 , 1175 - 1200 , 1200 - 1225 , 1225 - 1250 , 1250 - 1275 , 1275 - 1300 , 1300 - 1325 , 1325 - 1350 , 1350 - 1375 , 1375 - 1400 , 1400 - 1425 , 1425 - 1450 , 1450 - 1475 , 1475 - 1500 , 1500 - 1525 , 1525 - 1550 | ||
 | Click To Change The Sort Order: By Market Cap or Company Size Performance: Year-to-date, Week and Day |  |
|
Get the most comprehensive stock market coverage daily at 12Stocks.com ➞ Best Stocks Today ➞ Best Stocks Weekly ➞ Best Stocks Year-to-Date ➞ Best Stocks Trends ➞  Best Stocks Today 12Stocks.com Best Nasdaq Stocks ➞ Best S&P 500 Stocks ➞ Best Tech Stocks ➞ Best Biotech Stocks ➞ |
| Detailed Overview of Financial Stocks |
| Financial Technical Overview, Leaders & Laggards, Top Financial ETF Funds & Detailed Financial Stocks List, Charts, Trends & More |
| Financial Sector: Technical Analysis, Trends & YTD Performance | |
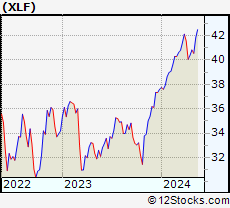
| Financial sector is composed of stocks
from banks, brokers, insurance, REITs
and services subsectors. Financial sector, as represented by XLF, an exchange-traded fund [ETF] that holds basket of Financial stocks (e.g, Bank of America, Goldman Sachs) is up by 11.4442% and is currently underperforming the overall market by -3.3137% year-to-date. Below is a quick view of Technical charts and trends: |
|
 XLF Weekly Chart |
|
| Long Term Trend: Good | |
| Medium Term Trend: Not Good | |
 XLF Daily Chart |
|
| Short Term Trend: Not Good | |
| Overall Trend Score: 20 | |
| YTD Performance: 11.4442% | |
| **Trend Scores & Views Are Only For Educational Purposes And Not For Investing | |
| 12Stocks.com: Top Performing Financial Sector Stocks | |||||||||||||||||||||||||||||||||||||||||||||||
 The top performing Financial sector stocks year to date are
Now, more recently, over last week, the top performing Financial sector stocks on the move are


|
|||||||||||||||||||||||||||||||||||||||||||||||
| 12Stocks.com: Investing in Financial Sector using Exchange Traded Funds | |
|
The following table shows list of key exchange traded funds (ETF) that
help investors track Financial Index. For detailed view, check out our ETF Funds section of our website. Quick View: Move mouse or cursor over ETF symbol (ticker) to view short-term Technical chart and over ETF name to view long term chart. Click on ticker or stock name for detailed view. Click on to add stock symbol to your watchlist and to view watchlist. |
12Stocks.com List of ETFs that track Financial Index
| Ticker | ETF Name | Watchlist | Recent Price | Smart Investing & Trading Score | Change % | Week % | Year-to-date % |
| CHIX | China Financials | | 10.57 | 20 | 0 | 0 | 0% |
| 12Stocks.com: Charts, Trends, Fundamental Data and Performances of Financial Stocks | |
|
We now take in-depth look at all Financial stocks including charts, multi-period performances and overall trends (as measured by Smart Investing & Trading Score). One can sort Financial stocks (click link to choose) by Daily, Weekly and by Year-to-Date performances. Also, one can sort by size of the company or by market capitalization. |
| Select Your Default Chart Type: | |||||
| |||||
| Click on stock symbol or name for detailed view. Click on to add stock symbol to your watchlist and to view watchlist. Quick View: Move mouse or cursor over "Daily" to quickly view daily Technical stock chart and over "Weekly" to view weekly Technical stock chart. | |||||

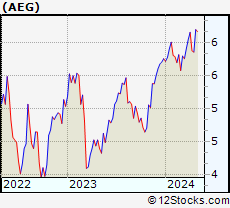 | AEG Aegon Ltd |
| Sector: Financials | |
| SubSector: Insurance - Diversified | |
| MarketCap: 11772.8 Millions | |
| Recent Price: 7.89 Smart Investing & Trading Score: 40 | |
| Day Percent Change: -0.252845% Day Change: -0.07 | |
| Week Change: -1.98758% Year-to-date Change: 37.9% | |
| AEG Links: Profile News Message Board | |
| Charts:- Daily , Weekly | |
| Add AEG to Watchlist: View: Get Complete AEG Trend Analysis ➞ | |
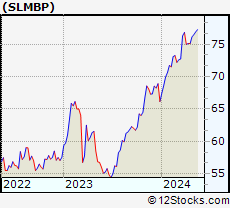 | SLMBP SLM Corporation |
| Sector: Financials | |
| SubSector: Credit Services | |
| MarketCap: 11675.8 Millions | |
| Recent Price: 76.34 Smart Investing & Trading Score: 80 | |
| Day Percent Change: 1.23326% Day Change: -0.01 | |
| Week Change: 0.262674% Year-to-date Change: 7.5% | |
| SLMBP Links: Profile News Message Board | |
| Charts:- Daily , Weekly | |
| Add SLMBP to Watchlist: View: Get Complete SLMBP Trend Analysis ➞ | |
 | AFG American Financial Group Inc |
| Sector: Financials | |
| SubSector: Insurance - Property & Casualty | |
| MarketCap: 11562.6 Millions | |
| Recent Price: 147.10 Smart Investing & Trading Score: 100 | |
| Day Percent Change: 0.409556% Day Change: 0.38 | |
| Week Change: 1.83454% Year-to-date Change: 12.4% | |
| AFG Links: Profile News Message Board | |
| Charts:- Daily , Weekly | |
| Add AFG to Watchlist: View: Get Complete AFG Trend Analysis ➞ | |
 | SF Stifel Financial Corp |
| Sector: Financials | |
| SubSector: Capital Markets | |
| MarketCap: 11502.7 Millions | |
| Recent Price: 112.09 Smart Investing & Trading Score: 0 | |
| Day Percent Change: 0.250425% Day Change: -0.34 | |
| Week Change: -0.204772% Year-to-date Change: 6.6% | |
| SF Links: Profile News Message Board | |
| Charts:- Daily , Weekly | |
| Add SF to Watchlist: View: Get Complete SF Trend Analysis ➞ | |
 | RNR RenaissanceRe Holdings Ltd |
| Sector: Financials | |
| SubSector: Insurance - Reinsurance | |
| MarketCap: 11326.5 Millions | |
| Recent Price: 255.75 Smart Investing & Trading Score: 100 | |
| Day Percent Change: -0.276846% Day Change: 0.18 | |
| Week Change: 2.12842% Year-to-date Change: 3.1% | |
| RNR Links: Profile News Message Board | |
| Charts:- Daily , Weekly | |
| Add RNR to Watchlist: View: Get Complete RNR Trend Analysis ➞ | |
 | GL Globe Life Inc |
| Sector: Financials | |
| SubSector: Insurance - Life | |
| MarketCap: 11325.1 Millions | |
| Recent Price: 139.44 Smart Investing & Trading Score: 10 | |
| Day Percent Change: -1.09235% Day Change: -1.28 | |
| Week Change: -2.69365% Year-to-date Change: 25.0% | |
| GL Links: Profile News Message Board | |
| Charts:- Daily , Weekly | |
| Add GL to Watchlist: View: Get Complete GL Trend Analysis ➞ | |
 | FHN First Horizon Corporation |
| Sector: Financials | |
| SubSector: Banks - Regional | |
| MarketCap: 11292.3 Millions | |
| Recent Price: 22.47 Smart Investing & Trading Score: 20 | |
| Day Percent Change: 0.49195% Day Change: 0.09 | |
| Week Change: -1.40412% Year-to-date Change: 14.1% | |
| FHN Links: Profile News Message Board | |
| Charts:- Daily , Weekly | |
| Add FHN to Watchlist: View: Get Complete FHN Trend Analysis ➞ | |
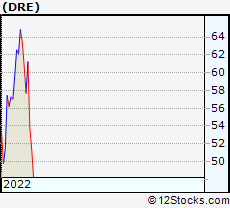 | DRE Duke Realty Corporation |
| Sector: Financials | |
| SubSector: REIT - Industrial | |
| MarketCap: 10999.9 Millions | |
| Recent Price: 85.32 Smart Investing & Trading Score: 80 | |
| Day Percent Change: 0.140845% Day Change: -9999 | |
| Week Change: 77.0125% Year-to-date Change: 0.0% | |
| DRE Links: Profile News Message Board | |
| Charts:- Daily , Weekly | |
| Add DRE to Watchlist: View: Get Complete DRE Trend Analysis ➞ | |
 | MORN Morningstar Inc |
| Sector: Financials | |
| SubSector: Financial Data & Stock Exchanges | |
| MarketCap: 10849.8 Millions | |
| Recent Price: 226.26 Smart Investing & Trading Score: 0 | |
| Day Percent Change: -0.334772% Day Change: -0.64 | |
| Week Change: -4.57594% Year-to-date Change: -31.6% | |
| MORN Links: Profile News Message Board | |
| Charts:- Daily , Weekly | |
| Add MORN to Watchlist: View: Get Complete MORN Trend Analysis ➞ | |
 | AGNC AGNC Investment Corp |
| Sector: Financials | |
| SubSector: REIT - Mortgage | |
| MarketCap: 10802.8 Millions | |
| Recent Price: 10.02 Smart Investing & Trading Score: 80 | |
| Day Percent Change: 0.906344% Day Change: 0.09 | |
| Week Change: 2.66393% Year-to-date Change: 18.0% | |
| AGNC Links: Profile News Message Board | |
| Charts:- Daily , Weekly | |
| Add AGNC to Watchlist: View: Get Complete AGNC Trend Analysis ➞ | |
 | SEIC SEI Investments Co |
| Sector: Financials | |
| SubSector: Asset Management | |
| MarketCap: 10776.4 Millions | |
| Recent Price: 84.86 Smart Investing & Trading Score: 10 | |
| Day Percent Change: 0.939693% Day Change: 1.01 | |
| Week Change: -1.29115% Year-to-date Change: 4.2% | |
| SEIC Links: Profile News Message Board | |
| Charts:- Daily , Weekly | |
| Add SEIC to Watchlist: View: Get Complete SEIC Trend Analysis ➞ | |
 | AIZ Assurant Inc |
| Sector: Financials | |
| SubSector: Insurance - Property & Casualty | |
| MarketCap: 10655.5 Millions | |
| Recent Price: 218.36 Smart Investing & Trading Score: 100 | |
| Day Percent Change: 0.404635% Day Change: 1.56 | |
| Week Change: 1.47312% Year-to-date Change: 4.1% | |
| AIZ Links: Profile News Message Board | |
| Charts:- Daily , Weekly | |
| Add AIZ to Watchlist: View: Get Complete AIZ Trend Analysis ➞ | |
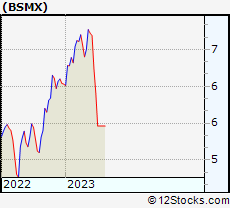 | BSMX Grupo Financiero Santander Mexico, S.A.B. de C.V. |
| Sector: Financials | |
| SubSector: Foreign Regional Banks | |
| MarketCap: 10616.2 Millions | |
| Recent Price: 75.54 Smart Investing & Trading Score: 70 | |
| Day Percent Change: 0.318725% Day Change: -9999 | |
| Week Change: 1283.52% Year-to-date Change: 0.0% | |
| BSMX Links: Profile News Message Board | |
| Charts:- Daily , Weekly | |
| Add BSMX to Watchlist: View: Get Complete BSMX Trend Analysis ➞ | |
 | KNSL Kinsale Capital Group Inc |
| Sector: Financials | |
| SubSector: Insurance - Property & Casualty | |
| MarketCap: 10610.8 Millions | |
| Recent Price: 442.56 Smart Investing & Trading Score: 80 | |
| Day Percent Change: 6.00493% Day Change: 18.62 | |
| Week Change: 2.97122% Year-to-date Change: -2.4% | |
| KNSL Links: Profile News Message Board | |
| Charts:- Daily , Weekly | |
| Add KNSL to Watchlist: View: Get Complete KNSL Trend Analysis ➞ | |
 | XL XL Group Ltd |
| Sector: Financials | |
| SubSector: Property & Casualty Insurance | |
| MarketCap: 10604.3 Millions | |
| Recent Price: 75.54 Smart Investing & Trading Score: 70 | |
| Day Percent Change: 0.318725% Day Change: -9999 | |
| Week Change: 750.676% Year-to-date Change: 0.0% | |
| XL Links: Profile News Message Board | |
| Charts:- Daily , Weekly | |
| Add XL to Watchlist: View: Get Complete XL Trend Analysis ➞ | |
 | SSB SouthState Bank Corp |
| Sector: Financials | |
| SubSector: Banks - Regional | |
| MarketCap: 10425.5 Millions | |
| Recent Price: 97.95 Smart Investing & Trading Score: 20 | |
| Day Percent Change: -0.517977% Day Change: -0.16 | |
| Week Change: -2.28452% Year-to-date Change: 2.8% | |
| SSB Links: Profile News Message Board | |
| Charts:- Daily , Weekly | |
| Add SSB to Watchlist: View: Get Complete SSB Trend Analysis ➞ | |
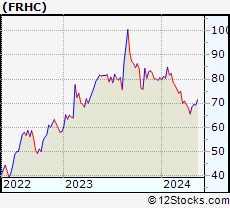 | FRHC Freedom Holding Corp |
| Sector: Financials | |
| SubSector: Financial Conglomerates | |
| MarketCap: 10374.6 Millions | |
| Recent Price: 172.67 Smart Investing & Trading Score: 50 | |
| Day Percent Change: 3.04965% Day Change: 0.44 | |
| Week Change: 1.54669% Year-to-date Change: 29.6% | |
| FRHC Links: Profile News Message Board | |
| Charts:- Daily , Weekly | |
| Add FRHC to Watchlist: View: Get Complete FRHC Trend Analysis ➞ | |
 | APSG Apollo Strategic Growth Capital |
| Sector: Financials | |
| SubSector: SPAC | |
| MarketCap: 10357 Millions | |
| Recent Price: 7.39 Smart Investing & Trading Score: 0 | |
| Day Percent Change: -2.11921% Day Change: -9999 | |
| Week Change: -25.8776% Year-to-date Change: 0.0% | |
| APSG Links: Profile News Message Board | |
| Charts:- Daily , Weekly | |
| Add APSG to Watchlist: View: Get Complete APSG Trend Analysis ➞ | |
 | WBS Webster Financial Corp |
| Sector: Financials | |
| SubSector: Banks - Regional | |
| MarketCap: 10305.4 Millions | |
| Recent Price: 58.96 Smart Investing & Trading Score: 20 | |
| Day Percent Change: -0.0508561% Day Change: -0.02 | |
| Week Change: -1.99468% Year-to-date Change: 9.9% | |
| WBS Links: Profile News Message Board | |
| Charts:- Daily , Weekly | |
| Add WBS to Watchlist: View: Get Complete WBS Trend Analysis ➞ | |
 | CIIC CIIG Merger Corp. |
| Sector: Financials | |
| SubSector: SPAC | |
| MarketCap: 10157 Millions | |
| Recent Price: 9.81 Smart Investing & Trading Score: 20 | |
| Day Percent Change: 0.102041% Day Change: -9999 | |
| Week Change: -54.5833% Year-to-date Change: 0.0% | |
| CIIC Links: Profile News Message Board | |
| Charts:- Daily , Weekly | |
| Add CIIC to Watchlist: View: Get Complete CIIC Trend Analysis ➞ | |
 | REXR Rexford Industrial Realty Inc |
| Sector: Financials | |
| SubSector: REIT - Industrial | |
| MarketCap: 10150.9 Millions | |
| Recent Price: 41.36 Smart Investing & Trading Score: 60 | |
| Day Percent Change: -1.14723% Day Change: -0.62 | |
| Week Change: -0.957854% Year-to-date Change: 10.1% | |
| REXR Links: Profile News Message Board | |
| Charts:- Daily , Weekly | |
| Add REXR to Watchlist: View: Get Complete REXR Trend Analysis ➞ | |
 | ORI Old Republic International Corp |
| Sector: Financials | |
| SubSector: Insurance - Property & Casualty | |
| MarketCap: 10050.6 Millions | |
| Recent Price: 42.87 Smart Investing & Trading Score: 100 | |
| Day Percent Change: 0.233809% Day Change: 0.04 | |
| Week Change: 3.72611% Year-to-date Change: 28.0% | |
| ORI Links: Profile News Message Board | |
| Charts:- Daily , Weekly | |
| Add ORI to Watchlist: View: Get Complete ORI Trend Analysis ➞ | |
 | WAL Western Alliance Bancorp |
| Sector: Financials | |
| SubSector: Banks - Regional | |
| MarketCap: 10004.9 Millions | |
| Recent Price: 85.48 Smart Investing & Trading Score: 10 | |
| Day Percent Change: -0.616207% Day Change: -0.88 | |
| Week Change: -3.97663% Year-to-date Change: 4.1% | |
| WAL Links: Profile News Message Board | |
| Charts:- Daily , Weekly | |
| Add WAL to Watchlist: View: Get Complete WAL Trend Analysis ➞ | |
 | XP XP Inc |
| Sector: Financials | |
| SubSector: Capital Markets | |
| MarketCap: 9964.48 Millions | |
| Recent Price: 17.57 Smart Investing & Trading Score: 20 | |
| Day Percent Change: -3.62041% Day Change: -0.49 | |
| Week Change: -8.53722% Year-to-date Change: 48.8% | |
| XP Links: Profile News Message Board | |
| Charts:- Daily , Weekly | |
| Add XP to Watchlist: View: Get Complete XP Trend Analysis ➞ | |
 | IVZ Invesco Ltd |
| Sector: Financials | |
| SubSector: Asset Management | |
| MarketCap: 9806.74 Millions | |
| Recent Price: 23.61 Smart Investing & Trading Score: 90 | |
| Day Percent Change: 2.25206% Day Change: 0.66 | |
| Week Change: 6.44725% Year-to-date Change: 37.1% | |
| IVZ Links: Profile News Message Board | |
| Charts:- Daily , Weekly | |
| Add IVZ to Watchlist: View: Get Complete IVZ Trend Analysis ➞ | |
| For tabular summary view of above stock list: Summary View ➞ 0 - 25 , 25 - 50 , 50 - 75 , 75 - 100 , 100 - 125 , 125 - 150 , 150 - 175 , 175 - 200 , 200 - 225 , 225 - 250 , 250 - 275 , 275 - 300 , 300 - 325 , 325 - 350 , 350 - 375 , 375 - 400 , 400 - 425 , 425 - 450 , 450 - 475 , 475 - 500 , 500 - 525 , 525 - 550 , 550 - 575 , 575 - 600 , 600 - 625 , 625 - 650 , 650 - 675 , 675 - 700 , 700 - 725 , 725 - 750 , 750 - 775 , 775 - 800 , 800 - 825 , 825 - 850 , 850 - 875 , 875 - 900 , 900 - 925 , 925 - 950 , 950 - 975 , 975 - 1000 , 1000 - 1025 , 1025 - 1050 , 1050 - 1075 , 1075 - 1100 , 1100 - 1125 , 1125 - 1150 , 1150 - 1175 , 1175 - 1200 , 1200 - 1225 , 1225 - 1250 , 1250 - 1275 , 1275 - 1300 , 1300 - 1325 , 1325 - 1350 , 1350 - 1375 , 1375 - 1400 , 1400 - 1425 , 1425 - 1450 , 1450 - 1475 , 1475 - 1500 , 1500 - 1525 , 1525 - 1550 | ||
| Click To Change The Sort Order: By Market Cap or Company Size Performance: Year-to-date, Week and Day | |
| Select Chart Type: | ||
|
Best Stocks Today 12Stocks.com |
© 2025 12Stocks.com Terms & Conditions Privacy Contact Us
All Information Provided Only For Education And Not To Be Used For Investing or Trading. See Terms & Conditions


One More Thing ... Get Best Stocks Delivered Daily!
Never Ever Miss A Move With Our Top Ten Stocks Lists
Find Best Stocks In Any Market - Bull or Bear Market
Take A Peek At Our Top Ten Stocks Lists: Daily, Weekly, Year-to-Date & Top Trends
Find Best Stocks In Any Market - Bull or Bear Market
Take A Peek At Our Top Ten Stocks Lists: Daily, Weekly, Year-to-Date & Top Trends
Financial Stocks With Best Up Trends [0-bearish to 100-bullish]: PIMCO California[100], Torchmark [100], PIMCO California[100], Triumph Bancorp[100], Cipher Mining[100], Lufax Holding[100], PIMCO Municipal[100], PIMCO Municipal[100], Front Yard[100], National General[100], Fifth Street[100]
Best Financial Stocks Year-to-Date:
Insight Select[12384.6%], Better Home[523.632%], IREN [363.5%], Global Medical[353.709%], Oxford Lane[287.756%], Robinhood Markets[269.422%], Metalpha Technology[225.664%], Cipher Mining[185.3%], Banco Santander[131.403%], Mr. Cooper[124.245%], Altisource Portfolio[121.195%] Best Financial Stocks This Week:
Colony Starwood[15929900%], Blackhawk Network[91300%], Macquarie Global[81662.9%], Credit Suisse[63241.6%], Pennsylvania Real[23823%], First Republic[22570.9%], Select ome[14000%], CorEnergy Infrastructure[6797.78%], FedNat Holding[5525%], BlackRock Municipal[5340%], BlackRock MuniYield[3379.04%] Best Financial Stocks Daily:
PIMCO California[11.9545%], Torchmark [11.8363%], PIMCO California[11.4754%], BlackRock Muni[10.8108%], Blackrock MuniYield[10.72%], Triumph Bancorp[10.2661%], Cipher Mining[9.36508%], AMBAC [8.24108%], BlackRock MuniYield[8.15348%], Summit [7.79817%], Concord Acquisition[7.63431%]