
 Login Sign Up


| |||||
 |  | ||||

| 12Stocks.com Market Intelligence |
Best Financial Stocks
| In a hurry? Financial Stocks Lists: Performance Trends Table, Stock Charts
Sort Financial stocks: Daily, Weekly, Year-to-Date, Market Cap & Trends. Filter Financial stocks list by size:All Financial Large Mid-Range Small & MicroCap |
| 12Stocks.com Financial Stocks Performances & Trends Daily | |||||||||
|
|  The overall Smart Investing & Trading Score is 33 (0-bearish to 100-bullish) which puts Financial sector in short term bearish to neutral trend. The Smart Investing & Trading Score from previous trading session is 26 and hence an improvement of trend.
| ||||||||
Here are the Smart Investing & Trading Scores of the most requested Financial stocks at 12Stocks.com (click stock name for detailed review):
|


| 12Stocks.com: Investing in Financial sector with Stocks | |
|
The following table helps investors and traders sort through current performance and trends (as measured by Smart Investing & Trading Score) of various
stocks in the Financial sector. Quick View: Move mouse or cursor over stock symbol (ticker) to view short-term Technical chart and over stock name to view long term chart. Click on  to add stock symbol to your watchlist and to add stock symbol to your watchlist and  to view watchlist. Click on any ticker or stock name for detailed market intelligence report for that stock. to view watchlist. Click on any ticker or stock name for detailed market intelligence report for that stock. |
12Stocks.com Performance of Stocks in Financial Sector
| Ticker | Stock Name | Watchlist | Category | Recent Price | Smart Investing & Trading Score | Change % | YTD Change% |
| HLNE | Hamilton Lane |   | Asset Mgmt | 150.90 | 38 | 2.10 | 2.29% |
| SIGI | Selective Insurance | | Insurance | 79.09 | 28 | 2.09 | -15.04% |
| ICE | Intercontinental Exchange | | Investments | 188.45 | 95 | 2.09 | 26.82% |
| KW | Kennedy-Wilson | | Property Mgmt | 7.39 | 73 | 2.07 | -24.98% |
| RKT | Rocket | | Mortgage Finance | 16.88 | 100 | 2.06 | 58.42% |
| JHG | Janus Henderson | | Asset Mgmt | 43.17 | 70 | 2.06 | 2.40% |
| PEB | Pebblebrook Hotel | | REIT | 9.90 | 46 | 2.06 | -26.87% |
| XP | XP | | Asset Mgmt | 16.69 | 44 | 2.05 | 40.84% |
| WASH | Washington Trust | | Regional Banks | 26.97 | 25 | 2.04 | -10.79% |
| TWO | Two Harbors | | Mortgage | 9.98 | 60 | 2.04 | -9.17% |
| EVR | Evercore | | Asset Mgmt | 300.01 | 58 | 2.04 | 8.60% |
| ENVA | Enova | | Credit Services | 102.60 | 36 | 2.03 | 7.01% |
| LAZ | Lazard | | Asset Mgmt | 51.21 | 43 | 2.03 | 0.42% |
| IBKR | Interactive Brokers | | Brokerage | 64.90 | 32 | 2.03 | -63.22% |
| SPG | Simon Property | | REIT - Retail | 163.94 | 48 | 2.03 | -3.62% |
| SLM | SLM | | Credit Services | 31.86 | 25 | 2.02 | 16.04% |
| GLPI | Gaming and | | REIT - | 47.08 | 85 | 2.02 | -0.72% |
| TRC | Tejon Ranch | | Property Mgmt | 18.24 | 83 | 2.01 | 14.72% |
| PFBC | Preferred Bank | | Regional Banks | 90.86 | 54 | 2.01 | 7.22% |
| ORC | Orchid Island | | Mortgage | 7.17 | 63 | 1.99 | -3.63% |
| UMBF | UMB | | Regional - Southwest Banks | 110.55 | 80 | 1.99 | -1.67% |
| CNOB | ConnectOne Bancorp | | Regional Banks | 22.68 | 10 | 1.98 | -0.34% |
| EFC | Ellington | | Mortgage | 12.95 | 51 | 1.97 | 10.11% |
| BOH | Bank of Hawaii | | Regional Banks | 62.56 | 51 | 1.97 | -11.32% |
| RILY | B. Riley | | Asset Mgmt | 5.20 | 55 | 1.96 | 13.29% |
| For chart view version of above stock list: Chart View ➞ 0 - 25 , 25 - 50 , 50 - 75 , 75 - 100 , 100 - 125 , 125 - 150 , 150 - 175 , 175 - 200 , 200 - 225 , 225 - 250 , 250 - 275 , 275 - 300 , 300 - 325 , 325 - 350 , 350 - 375 , 375 - 400 , 400 - 425 , 425 - 450 , 450 - 475 , 475 - 500 , 500 - 525 , 525 - 550 , 550 - 575 | ||
 | Click To Change The Sort Order: By Market Cap or Company Size Performance: Year-to-date, Week and Day |  |
|
Get the most comprehensive stock market coverage daily at 12Stocks.com ➞ Best Stocks Today ➞ Best Stocks Weekly ➞ Best Stocks Year-to-Date ➞ Best Stocks Trends ➞  Best Stocks Today 12Stocks.com Best Nasdaq Stocks ➞ Best S&P 500 Stocks ➞ Best Tech Stocks ➞ Best Biotech Stocks ➞ |
| Detailed Overview of Financial Stocks |
| Financial Technical Overview, Leaders & Laggards, Top Financial ETF Funds & Detailed Financial Stocks List, Charts, Trends & More |
| Financial Sector: Technical Analysis, Trends & YTD Performance | |
| Financial sector is composed of stocks
from banks, brokers, insurance, REITs
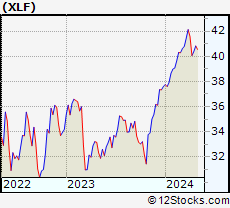
and services subsectors. Financial sector, as represented by XLF, an exchange-traded fund [ETF] that holds basket of Financial stocks (e.g, Bank of America, Goldman Sachs) is up by 7.8% and is currently outperforming the overall market by 0.27% year-to-date. Below is a quick view of Technical charts and trends: |
|
 XLF Weekly Chart |
|
| Long Term Trend: Good | |
| Medium Term Trend: Not Good | |
 XLF Daily Chart |
|
| Short Term Trend: Not Good | |
| Overall Trend Score: 33 | |
| YTD Performance: 7.8% | |
| **Trend Scores & Views Are Only For Educational Purposes And Not For Investing | |
| 12Stocks.com: Top Performing Financial Sector Stocks | ||||||||||||||||||||||||||||||||||||||||||||||||
 The top performing Financial sector stocks year to date are
Now, more recently, over last week, the top performing Financial sector stocks on the move are


|
||||||||||||||||||||||||||||||||||||||||||||||||
| 12Stocks.com: Investing in Financial Sector using Exchange Traded Funds | |
|
The following table shows list of key exchange traded funds (ETF) that
help investors track Financial Index. For detailed view, check out our ETF Funds section of our website. Quick View: Move mouse or cursor over ETF symbol (ticker) to view short-term Technical chart and over ETF name to view long term chart. Click on ticker or stock name for detailed view. Click on to add stock symbol to your watchlist and to view watchlist. |
12Stocks.com List of ETFs that track Financial Index
| Ticker | ETF Name | Watchlist | Recent Price | Smart Investing & Trading Score | Change % | Week % | Year-to-date % |
| XLF | Financial | | 51.91 | 33 | 0.99 | 0.99 | 7.8% |
| IAI | Broker-Dealers & Secs | | 174.97 | 63 | 2.34 | 2.34 | 21.82% |
| KBE | Bank | | 55.98 | 43 | 1.3 | 1.3 | 1.64% |
| FAS | Financial Bull 3X | | 161.82 | 33 | 2.91 | 2.91 | 7.48% |
| FAZ | Financial Bear 3X | | 4.54 | 62 | -2.78 | -2.78 | -27.4% |
| UYG | Financials | | 92.87 | 26 | 1.72 | 1.72 | 9% |
| KIE | Insurance | | 56.42 | 25 | 1.27 | 1.27 | 0.32% |
| 12Stocks.com: Charts, Trends, Fundamental Data and Performances of Financial Stocks | |
|
We now take in-depth look at all Financial stocks including charts, multi-period performances and overall trends (as measured by Smart Investing & Trading Score). One can sort Financial stocks (click link to choose) by Daily, Weekly and by Year-to-Date performances. Also, one can sort by size of the company or by market capitalization. |
| Select Your Default Chart Type: | |||||
| |||||
| Click on stock symbol or name for detailed view. Click on to add stock symbol to your watchlist and to view watchlist. Quick View: Move mouse or cursor over "Daily" to quickly view daily Technical stock chart and over "Weekly" to view weekly Technical stock chart. | |||||

 | HLNE Hamilton Lane Incorporated |
| Sector: Financials | |
| SubSector: Asset Management | |
| MarketCap: 2484.13 Millions | |
| Recent Price: 150.90 Smart Investing & Trading Score: 38 | |
| Day Percent Change: 2.1% Day Change: 3.11 | |
| Week Change: 2.1% Year-to-date Change: 2.3% | |
| HLNE Links: Profile News Message Board | |
| Charts:- Daily , Weekly | |
| Add HLNE to Watchlist: View: Get Complete HLNE Trend Analysis ➞ | |
 | SIGI Selective Insurance Group, Inc. |
| Sector: Financials | |
| SubSector: Property & Casualty Insurance | |
| MarketCap: 3039.12 Millions | |
| Recent Price: 79.09 Smart Investing & Trading Score: 28 | |
| Day Percent Change: 2.09% Day Change: 1.62 | |
| Week Change: 2.09% Year-to-date Change: -15.0% | |
| SIGI Links: Profile News Message Board | |
| Charts:- Daily , Weekly | |
| Add SIGI to Watchlist: View: Get Complete SIGI Trend Analysis ➞ | |
 | ICE Intercontinental Exchange, Inc. |
| Sector: Financials | |
| SubSector: Diversified Investments | |
| MarketCap: 46054.6 Millions | |
| Recent Price: 188.45 Smart Investing & Trading Score: 95 | |
| Day Percent Change: 2.09% Day Change: 3.85 | |
| Week Change: 2.09% Year-to-date Change: 26.8% | |
| ICE Links: Profile News Message Board | |
| Charts:- Daily , Weekly | |
| Add ICE to Watchlist: View: Get Complete ICE Trend Analysis ➞ | |
 | KW Kennedy-Wilson Holdings, Inc. |
| Sector: Financials | |
| SubSector: Property Management | |
| MarketCap: 2025.42 Millions | |
| Recent Price: 7.39 Smart Investing & Trading Score: 73 | |
| Day Percent Change: 2.07% Day Change: 0.15 | |
| Week Change: 2.07% Year-to-date Change: -25.0% | |
| KW Links: Profile News Message Board | |
| Charts:- Daily , Weekly | |
| Add KW to Watchlist: View: Get Complete KW Trend Analysis ➞ | |
 | RKT Rocket Companies, Inc. |
| Sector: Financials | |
| SubSector: Mortgage Finance | |
| MarketCap: 41287 Millions | |
| Recent Price: 16.88 Smart Investing & Trading Score: 100 | |
| Day Percent Change: 2.06% Day Change: 0.34 | |
| Week Change: 2.06% Year-to-date Change: 58.4% | |
| RKT Links: Profile News Message Board | |
| Charts:- Daily , Weekly | |
| Add RKT to Watchlist: View: Get Complete RKT Trend Analysis ➞ | |
 | JHG Janus Henderson Group plc |
| Sector: Financials | |
| SubSector: Asset Management | |
| MarketCap: 2992.33 Millions | |
| Recent Price: 43.17 Smart Investing & Trading Score: 70 | |
| Day Percent Change: 2.06% Day Change: 0.87 | |
| Week Change: 2.06% Year-to-date Change: 2.4% | |
| JHG Links: Profile News Message Board | |
| Charts:- Daily , Weekly | |
| Add JHG to Watchlist: View: Get Complete JHG Trend Analysis ➞ | |
 | PEB Pebblebrook Hotel Trust |
| Sector: Financials | |
| SubSector: REIT - Hotel/Motel | |
| MarketCap: 1472.84 Millions | |
| Recent Price: 9.90 Smart Investing & Trading Score: 46 | |
| Day Percent Change: 2.06% Day Change: 0.2 | |
| Week Change: 2.06% Year-to-date Change: -26.9% | |
| PEB Links: Profile News Message Board | |
| Charts:- Daily , Weekly | |
| Add PEB to Watchlist: View: Get Complete PEB Trend Analysis ➞ | |
 | XP XP Inc. |
| Sector: Financials | |
| SubSector: Asset Management | |
| MarketCap: 12990.3 Millions | |
| Recent Price: 16.69 Smart Investing & Trading Score: 44 | |
| Day Percent Change: 2.05% Day Change: 0.34 | |
| Week Change: 2.05% Year-to-date Change: 40.8% | |
| XP Links: Profile News Message Board | |
| Charts:- Daily , Weekly | |
| Add XP to Watchlist: View: Get Complete XP Trend Analysis ➞ | |
 | WASH Washington Trust Bancorp, Inc. |
| Sector: Financials | |
| SubSector: Regional - Northeast Banks | |
| MarketCap: 590.099 Millions | |
| Recent Price: 26.97 Smart Investing & Trading Score: 25 | |
| Day Percent Change: 2.04% Day Change: 0.54 | |
| Week Change: 2.04% Year-to-date Change: -10.8% | |
| WASH Links: Profile News Message Board | |
| Charts:- Daily , Weekly | |
| Add WASH to Watchlist: View: Get Complete WASH Trend Analysis ➞ | |
 | TWO Two Harbors Investment Corp. |
| Sector: Financials | |
| SubSector: Mortgage Investment | |
| MarketCap: 1979.59 Millions | |
| Recent Price: 9.98 Smart Investing & Trading Score: 60 | |
| Day Percent Change: 2.04% Day Change: 0.2 | |
| Week Change: 2.04% Year-to-date Change: -9.2% | |
| TWO Links: Profile News Message Board | |
| Charts:- Daily , Weekly | |
| Add TWO to Watchlist: View: Get Complete TWO Trend Analysis ➞ | |
 | EVR Evercore Inc. |
| Sector: Financials | |
| SubSector: Asset Management | |
| MarketCap: 1989.83 Millions | |
| Recent Price: 300.01 Smart Investing & Trading Score: 58 | |
| Day Percent Change: 2.04% Day Change: 6 | |
| Week Change: 2.04% Year-to-date Change: 8.6% | |
| EVR Links: Profile News Message Board | |
| Charts:- Daily , Weekly | |
| Add EVR to Watchlist: View: Get Complete EVR Trend Analysis ➞ | |
 | ENVA Enova International, Inc. |
| Sector: Financials | |
| SubSector: Credit Services | |
| MarketCap: 345.508 Millions | |
| Recent Price: 102.60 Smart Investing & Trading Score: 36 | |
| Day Percent Change: 2.03% Day Change: 2.04 | |
| Week Change: 2.03% Year-to-date Change: 7.0% | |
| ENVA Links: Profile News Message Board | |
| Charts:- Daily , Weekly | |
| Add ENVA to Watchlist: View: Get Complete ENVA Trend Analysis ➞ | |
 | LAZ Lazard Ltd |
| Sector: Financials | |
| SubSector: Asset Management | |
| MarketCap: 3061.13 Millions | |
| Recent Price: 51.21 Smart Investing & Trading Score: 43 | |
| Day Percent Change: 2.03% Day Change: 1.02 | |
| Week Change: 2.03% Year-to-date Change: 0.4% | |
| LAZ Links: Profile News Message Board | |
| Charts:- Daily , Weekly | |
| Add LAZ to Watchlist: View: Get Complete LAZ Trend Analysis ➞ | |
 | IBKR Interactive Brokers Group, Inc. |
| Sector: Financials | |
| SubSector: Investment Brokerage - National | |
| MarketCap: 16975.7 Millions | |
| Recent Price: 64.90 Smart Investing & Trading Score: 32 | |
| Day Percent Change: 2.03% Day Change: 1.29 | |
| Week Change: 2.03% Year-to-date Change: -63.2% | |
| IBKR Links: Profile News Message Board | |
| Charts:- Daily , Weekly | |
| Add IBKR to Watchlist: View: Get Complete IBKR Trend Analysis ➞ | |
 | SPG Simon Property Group, Inc. |
| Sector: Financials | |
| SubSector: REIT - Retail | |
| MarketCap: 17959.6 Millions | |
| Recent Price: 163.94 Smart Investing & Trading Score: 48 | |
| Day Percent Change: 2.03% Day Change: 3.26 | |
| Week Change: 2.03% Year-to-date Change: -3.6% | |
| SPG Links: Profile News Message Board | |
| Charts:- Daily , Weekly | |
| Add SPG to Watchlist: View: Get Complete SPG Trend Analysis ➞ | |
 | SLM SLM Corporation |
| Sector: Financials | |
| SubSector: Credit Services | |
| MarketCap: 3099.78 Millions | |
| Recent Price: 31.86 Smart Investing & Trading Score: 25 | |
| Day Percent Change: 2.02% Day Change: 0.63 | |
| Week Change: 2.02% Year-to-date Change: 16.0% | |
| SLM Links: Profile News Message Board | |
| Charts:- Daily , Weekly | |
| Add SLM to Watchlist: View: Get Complete SLM Trend Analysis ➞ | |
 | GLPI Gaming and Leisure Properties, Inc. |
| Sector: Financials | |
| SubSector: REIT - Diversified | |
| MarketCap: 4922.33 Millions | |
| Recent Price: 47.08 Smart Investing & Trading Score: 85 | |
| Day Percent Change: 2.02% Day Change: 0.93 | |
| Week Change: 2.02% Year-to-date Change: -0.7% | |
| GLPI Links: Profile News Message Board | |
| Charts:- Daily , Weekly | |
| Add GLPI to Watchlist: View: Get Complete GLPI Trend Analysis ➞ | |
 | TRC Tejon Ranch Co. |
| Sector: Financials | |
| SubSector: Property Management | |
| MarketCap: 346.442 Millions | |
| Recent Price: 18.24 Smart Investing & Trading Score: 83 | |
| Day Percent Change: 2.01% Day Change: 0.36 | |
| Week Change: 2.01% Year-to-date Change: 14.7% | |
| TRC Links: Profile News Message Board | |
| Charts:- Daily , Weekly | |
| Add TRC to Watchlist: View: Get Complete TRC Trend Analysis ➞ | |
 | PFBC Preferred Bank |
| Sector: Financials | |
| SubSector: Regional - Pacific Banks | |
| MarketCap: 559.629 Millions | |
| Recent Price: 90.86 Smart Investing & Trading Score: 54 | |
| Day Percent Change: 2.01% Day Change: 1.79 | |
| Week Change: 2.01% Year-to-date Change: 7.2% | |
| PFBC Links: Profile News Message Board | |
| Charts:- Daily , Weekly | |
| Add PFBC to Watchlist: View: Get Complete PFBC Trend Analysis ➞ | |
 | ORC Orchid Island Capital, Inc. |
| Sector: Financials | |
| SubSector: Mortgage Investment | |
| MarketCap: 212.339 Millions | |
| Recent Price: 7.17 Smart Investing & Trading Score: 63 | |
| Day Percent Change: 1.99% Day Change: 0.14 | |
| Week Change: 1.99% Year-to-date Change: -3.6% | |
| ORC Links: Profile News Message Board | |
| Charts:- Daily , Weekly | |
| Add ORC to Watchlist: View: Get Complete ORC Trend Analysis ➞ | |
 | UMBF UMB Financial Corporation |
| Sector: Financials | |
| SubSector: Regional - Southwest Banks | |
| MarketCap: 2207.35 Millions | |
| Recent Price: 110.55 Smart Investing & Trading Score: 80 | |
| Day Percent Change: 1.99% Day Change: 2.16 | |
| Week Change: 1.99% Year-to-date Change: -1.7% | |
| UMBF Links: Profile News Message Board | |
| Charts:- Daily , Weekly | |
| Add UMBF to Watchlist: View: Get Complete UMBF Trend Analysis ➞ | |
 | CNOB ConnectOne Bancorp, Inc. |
| Sector: Financials | |
| SubSector: Regional - Northeast Banks | |
| MarketCap: 491.899 Millions | |
| Recent Price: 22.68 Smart Investing & Trading Score: 10 | |
| Day Percent Change: 1.98% Day Change: 0.44 | |
| Week Change: 1.98% Year-to-date Change: -0.3% | |
| CNOB Links: Profile News Message Board | |
| Charts:- Daily , Weekly | |
| Add CNOB to Watchlist: View: Get Complete CNOB Trend Analysis ➞ | |
 | EFC Ellington Financial Inc. |
| Sector: Financials | |
| SubSector: Mortgage Investment | |
| MarketCap: 380.239 Millions | |
| Recent Price: 12.95 Smart Investing & Trading Score: 51 | |
| Day Percent Change: 1.97% Day Change: 0.25 | |
| Week Change: 1.97% Year-to-date Change: 10.1% | |
| EFC Links: Profile News Message Board | |
| Charts:- Daily , Weekly | |
| Add EFC to Watchlist: View: Get Complete EFC Trend Analysis ➞ | |
 | BOH Bank of Hawaii Corporation |
| Sector: Financials | |
| SubSector: Regional - Pacific Banks | |
| MarketCap: 2305.19 Millions | |
| Recent Price: 62.56 Smart Investing & Trading Score: 51 | |
| Day Percent Change: 1.97% Day Change: 1.21 | |
| Week Change: 1.97% Year-to-date Change: -11.3% | |
| BOH Links: Profile News Message Board | |
| Charts:- Daily , Weekly | |
| Add BOH to Watchlist: View: Get Complete BOH Trend Analysis ➞ | |
 | RILY B. Riley Financial, Inc. |
| Sector: Financials | |
| SubSector: Asset Management | |
| MarketCap: 443.703 Millions | |
| Recent Price: 5.20 Smart Investing & Trading Score: 55 | |
| Day Percent Change: 1.96% Day Change: 0.1 | |
| Week Change: 1.96% Year-to-date Change: 13.3% | |
| RILY Links: Profile News Message Board | |
| Charts:- Daily , Weekly | |
| Add RILY to Watchlist: View: Get Complete RILY Trend Analysis ➞ | |
| For tabular summary view of above stock list: Summary View ➞ 0 - 25 , 25 - 50 , 50 - 75 , 75 - 100 , 100 - 125 , 125 - 150 , 150 - 175 , 175 - 200 , 200 - 225 , 225 - 250 , 250 - 275 , 275 - 300 , 300 - 325 , 325 - 350 , 350 - 375 , 375 - 400 , 400 - 425 , 425 - 450 , 450 - 475 , 475 - 500 , 500 - 525 , 525 - 550 , 550 - 575 | ||
| Click To Change The Sort Order: By Market Cap or Company Size Performance: Year-to-date, Week and Day | |
| Select Chart Type: | ||
|
Best Stocks Today 12Stocks.com |
© 2025 12Stocks.com Terms & Conditions Privacy Contact Us
All Information Provided Only For Education And Not To Be Used For Investing or Trading. See Terms & Conditions


One More Thing ... Get Best Stocks Delivered Daily!
Never Ever Miss A Move With Our Top Ten Stocks Lists
Find Best Stocks In Any Market - Bull or Bear Market
Take A Peek At Our Top Ten Stocks Lists: Daily, Weekly, Year-to-Date & Top Trends
Find Best Stocks In Any Market - Bull or Bear Market
Take A Peek At Our Top Ten Stocks Lists: Daily, Weekly, Year-to-Date & Top Trends
Financial Stocks With Best Up Trends [0-bearish to 100-bullish]: Uniti [100], LendingTree [100], Mercury General[100], Perella Weinberg[100], Broadstone Net[100], LendingClub [100], TPG RE[100], CareTrust REIT[100], Stewart Information[100], Healthcare Realty[100], VICI Properties[100]
Best Financial Stocks Year-to-Date:
ESSA Bancorp[3207.77%], Easterly Government[108.45%], Mr. Cooper[86.58%], Heritage Insurance[75.29%], Root [65.29%], Industrial Logistics[64.89%], Rocket [58.42%], Diversified Healthcare[49.61%], ProAssurance [49.59%], Uniti [47.09%], SoFi Technologies[41.62%] Best Financial Stocks This Week:
Uniti [64.77%], Industrial Logistics[11.36%], LendingTree [7.32%], eXp World[7.27%], EverQuote [6.89%], Camping World[6.84%], First Foundation[6.69%], Diamond Hill[5.46%], Mercury General[5.36%], Cipher Mining[5.27%], AlTi Global[5.13%] Best Financial Stocks Daily:
Uniti [64.77%], Industrial Logistics[11.36%], LendingTree [7.32%], eXp World[7.27%], EverQuote [6.89%], Camping World[6.84%], First Foundation[6.69%], Diamond Hill[5.46%], Mercury General[5.36%], Cipher Mining[5.27%], AlTi Global[5.13%]