
 Login Sign Up


| |||||
 |  | ||||

| 12Stocks.com Market Intelligence |
Best Emerging Markets Stocks
| In a hurry? Emerging Markets Stocks Lists: Trends Table, Stock Charts
Sort Emerging Markets stocks: Daily, Weekly, Year-to-Date, Market Cap & Trends. Filter Emerging Markets stocks list by sector: Show all, Tech, Finance, Energy, Staples, Retail, Industrial, Materials, Utilities and HealthCare Filter Emerging Markets stocks list by size:All Large Medium Small |
| 12Stocks.com Emerging Markets Stocks Performances & Trends Daily | |||||||||
|
|  The overall Smart Investing & Trading Score is 100 (0-bearish to 100-bullish) which puts Emerging Markets index in short term bullish trend. The Smart Investing & Trading Score from previous trading session is 100 and an improvement of trend continues.
| ||||||||
Here are the Smart Investing & Trading Scores of the most requested Emerging Markets stocks at 12Stocks.com (click stock name for detailed review):
|


| 12Stocks.com: Top Performing Emerging Markets Index Stocks | |||||||||||||||||||||||||||||||||||||||||||||||
 The top performing Emerging Markets Index stocks year to date are
Now, more recently, over last week, the top performing Emerging Markets Index stocks on the move are


|
|||||||||||||||||||||||||||||||||||||||||||||||
| 12Stocks.com: Investing in Emerging Markets Index with Stocks | |
|
The following table helps investors and traders sort through current performance and trends (as measured by Smart Investing & Trading Score ) of various
stocks in the Emerging Markets Index. Quick View: Move mouse or cursor over stock symbol (ticker) to view short-term technical chart and over stock name to view long term chart. Click on  to add stock symbol to your watchlist and to add stock symbol to your watchlist and  to view watchlist. Click on any ticker or stock name for detailed market intelligence report for that stock. to view watchlist. Click on any ticker or stock name for detailed market intelligence report for that stock. |
12Stocks.com Performance of Stocks in Emerging Markets Index
| Ticker | Stock Name | Watchlist | Category | Recent Price | Smart Investing & Trading Score | Change % | YTD Change% |
| BBDO | Banco Bradesco |   | Financials | 2.84 | 100 | 2.53% | 66.95% |
| CTRP | Ctrip.com | | Services & Goods | 27.62 | 100 | 1.21% | 0.00% |
| ASX | ASE | | Technology | 11.20 | 80 | 1.36% | 15.83% |
| BEKE | KE | | Financials | 19.69 | 60 | -1.89% | 12.56% |
| BSBR | Banco Santander | | Financials | 5.44 | 90 | 1.30% | 43.44% |
| VIV | Telefonica Brasil | | Technology | 12.67 | 90 | 1.60% | 71.26% |
| LI | Li Auto | | Services & Goods | 26.17 | 80 | 6.90% | 8.95% |
| CHU | China Unicom | | Technology | 44.89 | 60 | -1.30% | 0.00% |
| FMX | Fomento Economico | | Consumer Staples | 94.38 | 90 | 2.24% | 15.96% |
| UMC | United Micro | | Technology | 6.85 | 80 | 1.33% | 11.43% |
| LIZI | Lizhi | | Technology | 3.40 | 20 | -3.41% | 0.00% |
| EBR | Centrais Eletricas | | Utilities | 9.02 | 100 | 4.04% | 60.71% |
| YUMC | Yum China | | Services & Goods | 43.56 | 0 | -0.93% | -5.53% |
| SBS | Companhia de | | Utilities | 23.98 | 100 | 2.17% | 71.99% |
| XPEV | XPeng | | Services & Goods | 21.33 | 90 | 2.20% | 84.68% |
| CX | Cemex S.A.B. | | Materials | 9.54 | 90 | 1.71% | 68.79% |
| TME | Tencent Music | | Technology | 25.52 | 90 | 2.08% | 125.44% |
| NTCO | Natura &Co | | Consumer Staples | 6.55 | 10 | -2.96% | 0.00% |
| YMM | Full Truck | | Technology | 13.55 | 90 | -0.51% | 25.23% |
| RDY | Dr. Reddy's | | Health Care | 14.63 | 80 | -0.20% | -6.17% |
| SUZ | Suzano S.A. | | Materials | 9.48 | 70 | 0.21% | -6.60% |
| NIO | NIO | | Services & Goods | 6.49 | 90 | 4.34% | 42.64% |
| HTHT | H World | | Services & Goods | 36.83 | 40 | -0.89% | 16.72% |
| ERJ | Embraer S.A. | | Industrials | 56.96 | 30 | -0.63% | 50.48% |
| ZTO | ZTO Express | | Industrials | 19.27 | 80 | 1.10% | 3.29% |
| For chart view version of above stock list: Chart View ➞ 0 - 25 , 25 - 50 , 50 - 75 , 75 - 100 , 100 - 125 , 125 - 150 , 150 - 175 , 175 - 200 , 200 - 225 , 225 - 250 , 250 - 275 | ||
 | Click To Change The Sort Order: By Market Cap or Company Size Performance: Year-to-date, Week and Day |  |
|
Get the most comprehensive stock market coverage daily at 12Stocks.com ➞ Best Stocks Today ➞ Best Stocks Weekly ➞ Best Stocks Year-to-Date ➞ Best Stocks Trends ➞  Best Stocks Today 12Stocks.com Best Nasdaq Stocks ➞ Best S&P 500 Stocks ➞ Best Tech Stocks ➞ Best Biotech Stocks ➞ |
| Detailed Overview of Emerging Markets Stocks |
| Emerging Markets Technical Overview, Leaders & Laggards, Top Emerging Markets ETF Funds & Detailed Emerging Markets Stocks List, Charts, Trends & More |
| Emerging Markets: Technical Analysis, Trends & YTD Performance | |
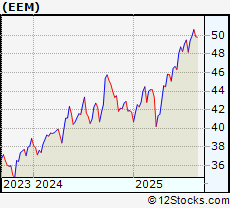
 EEM Weekly Chart |
|
| Long Term Trend: Very Good | |
| Medium Term Trend: Good | |
 EEM Daily Chart |
|
| Short Term Trend: Very Good | |
| Overall Trend Score: 100 | |
| YTD Performance: 27.6376% | |
| **Trend Scores & Views Are Only For Educational Purposes And Not For Investing | |
| 12Stocks.com: Investing in Emerging Markets Index using Exchange Traded Funds | |
|
The following table shows list of key exchange traded funds (ETF) that
help investors play Emerging Markets stock market. For detailed view, check out our ETF Funds section of our website. Quick View: Move mouse or cursor over ETF symbol (ticker) to view short-term technical chart and over ETF name to view long term chart. Click on ticker or stock name for detailed view. Click on to add stock symbol to your watchlist and to view watchlist. |
12Stocks.com List of ETFs that track Emerging Markets Index
| Ticker | ETF Name | Watchlist | Recent Price | Smart Investing & Trading Score | Change % | Week % | Year-to-date % |
| EWEM | Em Mkts Eql | | 95.84 | 70 | -0.457 | 5.08772 | 0% |
| 12Stocks.com: Charts, Trends, Fundamental Data and Performances of Emerging Markets Stocks | |
|
We now take in-depth look at all Emerging Markets stocks including charts, multi-period performances and overall trends (as measured by Smart Investing & Trading Score ). One can sort Emerging Markets stocks (click link to choose) by Daily, Weekly and by Year-to-Date performances. Also, one can sort by size of the company or by market capitalization. |
| Select Your Default Chart Type: | |||||
| |||||
| Click on stock symbol or name for detailed view. Click on to add stock symbol to your watchlist and to view watchlist. Quick View: Move mouse or cursor over "Daily" to quickly view daily technical stock chart and over "Weekly" to view weekly technical stock chart. | |||||

 | BBDO Banco Bradesco S.A. |
| Sector: Financials | |
| SubSector: Foreign Regional Banks | |
| MarketCap: 27711.4 Millions | |
| Recent Price: 2.84 Smart Investing & Trading Score : 100 | |
| Day Percent Change: 2.52708% Day Change: -0.03 | |
| Week Change: 5.18518% Year-to-date Change: 67.0% | |
| BBDO Links: Profile News Message Board | |
| Charts:- Daily , Weekly | |
| Add BBDO to Watchlist: View: Get Complete BBDO Trend Analysis ➞ | |
 | CTRP Ctrip.com International, Ltd. |
| Sector: Services & Goods | |
| SubSector: Lodging | |
| MarketCap: 23662.9 Millions | |
| Recent Price: 27.62 Smart Investing & Trading Score : 100 | |
| Day Percent Change: 1.20923% Day Change: -9999 | |
| Week Change: 18.1352% Year-to-date Change: 0.0% | |
| CTRP Links: Profile News Message Board | |
| Charts:- Daily , Weekly | |
| Add CTRP to Watchlist: View: Get Complete CTRP Trend Analysis ➞ | |
 | ASX ASE Technology Holding Co.Ltd ADR |
| Sector: Technology | |
| SubSector: Semiconductors | |
| MarketCap: 22768.3 Millions | |
| Recent Price: 11.20 Smart Investing & Trading Score : 80 | |
| Day Percent Change: 1.35747% Day Change: -0.06 | |
| Week Change: 6.9723% Year-to-date Change: 15.8% | |
| ASX Links: Profile News Message Board | |
| Charts:- Daily , Weekly | |
| Add ASX to Watchlist: View: Get Complete ASX Trend Analysis ➞ | |
 | BEKE KE Holdings Inc ADR |
| Sector: Financials | |
| SubSector: Real Estate Services | |
| MarketCap: 20791.6 Millions | |
| Recent Price: 19.69 Smart Investing & Trading Score : 60 | |
| Day Percent Change: -1.89337% Day Change: -0.04 | |
| Week Change: 3.68615% Year-to-date Change: 12.6% | |
| BEKE Links: Profile News Message Board | |
| Charts:- Daily , Weekly | |
| Add BEKE to Watchlist: View: Get Complete BEKE Trend Analysis ➞ | |
 | BSBR Banco Santander (Brasil) S.A. ADR |
| Sector: Financials | |
| SubSector: Banks - Regional | |
| MarketCap: 20321.1 Millions | |
| Recent Price: 5.44 Smart Investing & Trading Score : 90 | |
| Day Percent Change: 1.30354% Day Change: 0 | |
| Week Change: 0% Year-to-date Change: 43.4% | |
| BSBR Links: Profile News Message Board | |
| Charts:- Daily , Weekly | |
| Add BSBR to Watchlist: View: Get Complete BSBR Trend Analysis ➞ | |
 | VIV Telefonica Brasil S.A., ADR |
| Sector: Technology | |
| SubSector: Telecom Services | |
| MarketCap: 19900.9 Millions | |
| Recent Price: 12.67 Smart Investing & Trading Score : 90 | |
| Day Percent Change: 1.60385% Day Change: 0.05 | |
| Week Change: 1.60385% Year-to-date Change: 71.3% | |
| VIV Links: Profile News Message Board | |
| Charts:- Daily , Weekly | |
| Add VIV to Watchlist: View: Get Complete VIV Trend Analysis ➞ | |
 | LI Li Auto Inc ADR |
| Sector: Services & Goods | |
| SubSector: Auto Manufacturers | |
| MarketCap: 19756.7 Millions | |
| Recent Price: 26.17 Smart Investing & Trading Score : 80 | |
| Day Percent Change: 6.90359% Day Change: -0.04 | |
| Week Change: 10.6554% Year-to-date Change: 9.0% | |
| LI Links: Profile News Message Board | |
| Charts:- Daily , Weekly | |
| Add LI to Watchlist: View: Get Complete LI Trend Analysis ➞ | |
 | CHU China Unicom (Hong Kong) Limited |
| Sector: Technology | |
| SubSector: Wireless Communications | |
| MarketCap: 19006.1 Millions | |
| Recent Price: 44.89 Smart Investing & Trading Score : 60 | |
| Day Percent Change: -1.29727% Day Change: -9999 | |
| Week Change: 15.7555% Year-to-date Change: 0.0% | |
| CHU Links: Profile News Message Board | |
| Charts:- Daily , Weekly | |
| Add CHU to Watchlist: View: Get Complete CHU Trend Analysis ➞ | |
 | FMX Fomento Economico Mexicano S.A.B. de C.V. ADR |
| Sector: Consumer Staples | |
| SubSector: Beverages - Brewers | |
| MarketCap: 17575.6 Millions | |
| Recent Price: 94.38 Smart Investing & Trading Score : 90 | |
| Day Percent Change: 2.24244% Day Change: 0.77 | |
| Week Change: 10.567% Year-to-date Change: 16.0% | |
| FMX Links: Profile News Message Board | |
| Charts:- Daily , Weekly | |
| Add FMX to Watchlist: View: Get Complete FMX Trend Analysis ➞ | |
 | UMC United Micro Electronics ADR |
| Sector: Technology | |
| SubSector: Semiconductors | |
| MarketCap: 17076.6 Millions | |
| Recent Price: 6.85 Smart Investing & Trading Score : 80 | |
| Day Percent Change: 1.33136% Day Change: -0.13 | |
| Week Change: 0.735294% Year-to-date Change: 11.4% | |
| UMC Links: Profile News Message Board | |
| Charts:- Daily , Weekly | |
| Add UMC to Watchlist: View: Get Complete UMC Trend Analysis ➞ | |
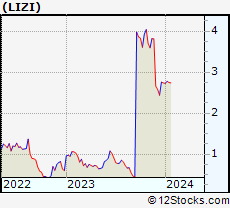 | LIZI Lizhi Inc. |
| Sector: Technology | |
| SubSector: Internet Content & Information | |
| MarketCap: 16837 Millions | |
| Recent Price: 3.40 Smart Investing & Trading Score : 20 | |
| Day Percent Change: -3.40909% Day Change: -9999 | |
| Week Change: -6.84932% Year-to-date Change: 0.0% | |
| LIZI Links: Profile News Message Board | |
| Charts:- Daily , Weekly | |
| Add LIZI to Watchlist: View: Get Complete LIZI Trend Analysis ➞ | |
 | EBR Centrais Eletricas Brasileiras S.A. ADR |
| Sector: Utilities | |
| SubSector: Utilities - Renewable | |
| MarketCap: 16657.1 Millions | |
| Recent Price: 9.02 Smart Investing & Trading Score : 100 | |
| Day Percent Change: 4.03691% Day Change: 0.08 | |
| Week Change: 6.61939% Year-to-date Change: 60.7% | |
| EBR Links: Profile News Message Board | |
| Charts:- Daily , Weekly | |
| Add EBR to Watchlist: View: Get Complete EBR Trend Analysis ➞ | |
 | YUMC Yum China Holdings Inc |
| Sector: Services & Goods | |
| SubSector: Restaurants | |
| MarketCap: 16566.5 Millions | |
| Recent Price: 43.56 Smart Investing & Trading Score : 0 | |
| Day Percent Change: -0.932454% Day Change: 0.48 | |
| Week Change: -3.04919% Year-to-date Change: -5.5% | |
| YUMC Links: Profile News Message Board | |
| Charts:- Daily , Weekly | |
| Add YUMC to Watchlist: View: Get Complete YUMC Trend Analysis ➞ | |
 | SBS Companhia de Saneamento Basico do Estado de Sao Paulo. ADR |
| Sector: Utilities | |
| SubSector: Utilities - Regulated Water | |
| MarketCap: 15830.1 Millions | |
| Recent Price: 23.98 Smart Investing & Trading Score : 100 | |
| Day Percent Change: 2.17299% Day Change: 0.29 | |
| Week Change: 3.54059% Year-to-date Change: 72.0% | |
| SBS Links: Profile News Message Board | |
| Charts:- Daily , Weekly | |
| Add SBS to Watchlist: View: Get Complete SBS Trend Analysis ➞ | |
 | XPEV XPeng Inc ADR |
| Sector: Services & Goods | |
| SubSector: Auto Manufacturers | |
| MarketCap: 15408.5 Millions | |
| Recent Price: 21.33 Smart Investing & Trading Score : 90 | |
| Day Percent Change: 2.20412% Day Change: 2.38 | |
| Week Change: 7.5643% Year-to-date Change: 84.7% | |
| XPEV Links: Profile News Message Board | |
| Charts:- Daily , Weekly | |
| Add XPEV to Watchlist: View: Get Complete XPEV Trend Analysis ➞ | |
 | CX Cemex S.A.B. De C.V. ADR |
| Sector: Materials | |
| SubSector: Building Materials | |
| MarketCap: 14210 Millions | |
| Recent Price: 9.54 Smart Investing & Trading Score : 90 | |
| Day Percent Change: 1.70576% Day Change: 0.14 | |
| Week Change: 1.48936% Year-to-date Change: 68.8% | |
| CX Links: Profile News Message Board | |
| Charts:- Daily , Weekly | |
| Add CX to Watchlist: View: Get Complete CX Trend Analysis ➞ | |
 | TME Tencent Music Entertainment Group ADR |
| Sector: Technology | |
| SubSector: Internet Content & Information | |
| MarketCap: 14109.9 Millions | |
| Recent Price: 25.52 Smart Investing & Trading Score : 90 | |
| Day Percent Change: 2.08% Day Change: -0.11 | |
| Week Change: 4.2058% Year-to-date Change: 125.4% | |
| TME Links: Profile News Message Board | |
| Charts:- Daily , Weekly | |
| Add TME to Watchlist: View: Get Complete TME Trend Analysis ➞ | |
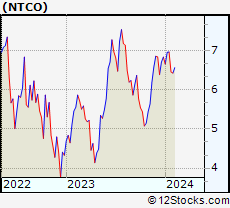 | NTCO Natura &Co Holding S.A. |
| Sector: Consumer Staples | |
| SubSector: Household & Personal Products | |
| MarketCap: 13047 Millions | |
| Recent Price: 6.55 Smart Investing & Trading Score : 10 | |
| Day Percent Change: -2.96296% Day Change: -9999 | |
| Week Change: -8.50677% Year-to-date Change: 0.0% | |
| NTCO Links: Profile News Message Board | |
| Charts:- Daily , Weekly | |
| Add NTCO to Watchlist: View: Get Complete NTCO Trend Analysis ➞ | |
 | YMM Full Truck Alliance Co Ltd ADR |
| Sector: Technology | |
| SubSector: Software - Application | |
| MarketCap: 12347.5 Millions | |
| Recent Price: 13.55 Smart Investing & Trading Score : 90 | |
| Day Percent Change: -0.51395% Day Change: 1.08 | |
| Week Change: 3.43511% Year-to-date Change: 25.2% | |
| YMM Links: Profile News Message Board | |
| Charts:- Daily , Weekly | |
| Add YMM to Watchlist: View: Get Complete YMM Trend Analysis ➞ | |
 | RDY Dr. Reddy's Laboratories Ltd. ADR |
| Sector: Health Care | |
| SubSector: Drug Manufacturers - Specialty & Generic | |
| MarketCap: 11935.6 Millions | |
| Recent Price: 14.63 Smart Investing & Trading Score : 80 | |
| Day Percent Change: -0.204638% Day Change: 0.29 | |
| Week Change: 2.02232% Year-to-date Change: -6.2% | |
| RDY Links: Profile News Message Board | |
| Charts:- Daily , Weekly | |
| Add RDY to Watchlist: View: Get Complete RDY Trend Analysis ➞ | |
 | SUZ Suzano S.A. ADR |
| Sector: Materials | |
| SubSector: Paper & Paper Products | |
| MarketCap: 11901.8 Millions | |
| Recent Price: 9.48 Smart Investing & Trading Score : 70 | |
| Day Percent Change: 0.211416% Day Change: -0.01 | |
| Week Change: -1.55763% Year-to-date Change: -6.6% | |
| SUZ Links: Profile News Message Board | |
| Charts:- Daily , Weekly | |
| Add SUZ to Watchlist: View: Get Complete SUZ Trend Analysis ➞ | |
 | NIO NIO Inc ADR |
| Sector: Services & Goods | |
| SubSector: Auto Manufacturers | |
| MarketCap: 11560.9 Millions | |
| Recent Price: 6.49 Smart Investing & Trading Score : 90 | |
| Day Percent Change: 4.34084% Day Change: 0.47 | |
| Week Change: 9.08113% Year-to-date Change: 42.6% | |
| NIO Links: Profile News Message Board | |
| Charts:- Daily , Weekly | |
| Add NIO to Watchlist: View: Get Complete NIO Trend Analysis ➞ | |
 | HTHT H World Group Limited ADR |
| Sector: Services & Goods | |
| SubSector: Lodging | |
| MarketCap: 11461.2 Millions | |
| Recent Price: 36.83 Smart Investing & Trading Score : 40 | |
| Day Percent Change: -0.888052% Day Change: 0.77 | |
| Week Change: -2.04787% Year-to-date Change: 16.7% | |
| HTHT Links: Profile News Message Board | |
| Charts:- Daily , Weekly | |
| Add HTHT to Watchlist: View: Get Complete HTHT Trend Analysis ➞ | |
 | ERJ Embraer S.A. ADR |
| Sector: Industrials | |
| SubSector: Aerospace & Defense | |
| MarketCap: 11181.3 Millions | |
| Recent Price: 56.96 Smart Investing & Trading Score : 30 | |
| Day Percent Change: -0.628053% Day Change: 0.62 | |
| Week Change: -6.577% Year-to-date Change: 50.5% | |
| ERJ Links: Profile News Message Board | |
| Charts:- Daily , Weekly | |
| Add ERJ to Watchlist: View: Get Complete ERJ Trend Analysis ➞ | |
 | ZTO ZTO Express (Cayman) Inc ADR |
| Sector: Industrials | |
| SubSector: Integrated Freight & Logistics | |
| MarketCap: 10887.5 Millions | |
| Recent Price: 19.27 Smart Investing & Trading Score : 80 | |
| Day Percent Change: 1.10178% Day Change: -0.45 | |
| Week Change: 5.07088% Year-to-date Change: 3.3% | |
| ZTO Links: Profile News Message Board | |
| Charts:- Daily , Weekly | |
| Add ZTO to Watchlist: View: Get Complete ZTO Trend Analysis ➞ | |
| For tabular summary view of above stock list: Summary View ➞ 0 - 25 , 25 - 50 , 50 - 75 , 75 - 100 , 100 - 125 , 125 - 150 , 150 - 175 , 175 - 200 , 200 - 225 , 225 - 250 , 250 - 275 | ||
| Click To Change The Sort Order: By Market Cap or Company Size Performance: Year-to-date, Week and Day | |
| Select Chart Type: | ||
|
Best Stocks Today 12Stocks.com |
© 2025 12Stocks.com Terms & Conditions Privacy Contact Us
All Information Provided Only For Education And Not To Be Used For Investing or Trading. See Terms & Conditions


One More Thing ... Get Best Stocks Delivered Daily!
Never Ever Miss A Move With Our Top Ten Stocks Lists
Find Best Stocks In Any Market - Bull or Bear Market
Take A Peek At Our Top Ten Stocks Lists: Daily, Weekly, Year-to-Date & Top Trends
Find Best Stocks In Any Market - Bull or Bear Market
Take A Peek At Our Top Ten Stocks Lists: Daily, Weekly, Year-to-Date & Top Trends
Emerging Markets Stocks With Best Up Trends [0-bearish to 100-bullish]: Net 1[100], Vasta Platform[100], Bilibili [100], JinkoSolar Holding[100], Zhihu [100], Centrais Eletricas[100], Chipmos [100], Gold Fields[100], Banco Bradesco[100], Cia Paranaense[100], Companhia de[100]
Best Emerging Markets Stocks Year-to-Date:
Regencell Bioscience[11217%], So-Young [375.53%], Sify [293.464%], QuantaSing [269.91%], Xunlei [266.667%], Oneconnect Financial[195.885%], Gold Fields[181.257%], Yatsen Holding[162.24%], DRDGold .[161.328%], Masterbeef [156.098%], Sibanye Stillwater[154.179%] Best Emerging Markets Stocks This Week:
CNOOC [137266%], Companhia Brasileira[18587.4%], Cosan [16415.2%], Nam Tai[5033.33%], Fang [4150%], Sinopec Shanghai[1992.58%], Grupo Financiero[1283.52%], PetroChina [1137.09%], China [1104.2%], China Life[690.958%], Leju [539.091%] Best Emerging Markets Stocks Daily:
Masterbeef [12.2995%], Grupo Simec[12.2572%], Net 1[9.46197%], Jianpu [7.78054%], Vasta Platform[7.06402%], Li Auto[6.90359%], Bilibili [6.40472%], Daqo New[6.08291%], Sibanye Gold[5.06135%], JinkoSolar Holding[4.90235%], NIO [4.34084%]