
 Login Sign Up


| |||||
 |  | ||||

| 12Stocks.com Market Intelligence |
Best Biotech Stocks
|
|
| Quick Read: Best Biotech Stocks List By Performances & Trends: Daily, Weekly, Year-to-Date, Market Cap (Size) & Technical Trends | |||
| Best Biotech Stocks Views: Quick Browse View, Summary & Slide Show View | |||
| 12Stocks.com Biotech Stocks Performances & Trends Daily | |||||||||
|
|  The overall market intelligence score is 100 (0-bearish to 100-bullish) which puts Biotech sector in short term bullish trend. The market intelligence score from previous trading session is 90 and an improvement of trend continues.
| ||||||||
Here are the market intelligence trend scores of the most requested Biotech stocks at 12Stocks.com (click stock name for detailed review):
|


| 12Stocks.com: Investing in Biotech sector with Stocks | |
|
The following table helps investors and traders sort through current performance and trends (as measured by market intelligence score) of various
stocks in the Biotech sector. Quick View: Move mouse or cursor over stock symbol (ticker) to view short-term Technical chart and over stock name to view long term chart. Click on  to add stock symbol to your watchlist and to add stock symbol to your watchlist and  to view watchlist. Click on any ticker or stock name for detailed market intelligence report for that stock. to view watchlist. Click on any ticker or stock name for detailed market intelligence report for that stock. |
12Stocks.com Performance of Stocks in Biotech Sector
| Ticker | Stock Name | Watchlist | Category | Recent Price | Market Intelligence Score | Change % | YTD Change% |
| GRTS | Gritstone Oncology |   | Biotechnology | 0.02 | 10 | 0.00% | 0.00% |
| ANNX | Annexon | | Biotechnology | 3.12 | 80 | 2.97% | -43.27% |
| STML | Stemline | | Biotechnology | 23.88 | 50 | -0.04% | 0.00% |
| VYGR | Voyager | | Biotechnology | 4.72 | 100 | 0.85% | -20.94% |
| LYEL | Lyell Immunopharma | | Biotechnology | 15.81 | 90 | -4.47% | 22.56% |
| TNXP | Tonix | | Biotechnology | 24.72 | 10 | 1.54% | -21.27% |
| KLDO | Kaleido | | Biotechnology | 0.01 | 80 | 9,900.00% | NA |
| ACRS | Aclaris | | Biotechnology | 1.83 | 20 | -1.87% | -26.01% |
| HUMA | Humacyte | | Biotechnology | 1.78 | 70 | 1.42% | -65.54% |
| ACIU | AC Immune | | Biotechnology | 3.16 | 100 | 3.95% | 10.88% |
| MRNS | Marinus | | Biotechnology | 0.55 | 50 | 0.00% | 3.00% |
| TNYA | Tenaya | | Biotechnology | 1.60 | 80 | -4.46% | 13.03% |
| CDXS | Codexis | | Biotechnology | 2.52 | 50 | 0.80% | -49.60% |
| AMAG | AMAG | | Biotechnology | 1.17 | 10 | -2.50% | 0.00% |
| XOMAO | XOMA | | Biotechnology | 25.39 | 40 | -0.70% | 5.44% |
| RAPT | RAPT | | Biotechnology | 27.24 | 70 | 5.62% | 108.90% |
| OABI | OmniAb | | Biotechnology | 1.60 | 10 | -0.31% | -54.14% |
| ENZY | Enzymotec | | Biotechnology | 42.29 | 70 | -1.08% | 0.00% |
| TCRR | TCR2 | | Biotechnology | 1.48 | 20 | 0.00% | 0.00% |
| CERC | Cerecor | | Biotechnology | 6652.80 | 70 | 4.05% | 0.00% |
| CDMO | Avid Bioservices | | Biotechnology | 12.49 | 40 | 0.08% | 1.38% |
| LOGC | LogicBio | | Biotechnology | 7.41 | 30 | -0.54% | 6.93% |
| OASM | Oasmia | | Biotechnology | 17.03 | 0 | -1.10% | 0.00% |
| TRDA | Entrada | | Biotechnology | 5.92 | 25 | 10.55% | -66.05% |
| SLS | SELLAS Life | | Biotechnology | 1.71 | 50 | 1.18% | 59.81% |
| To view more stocks, click on Next / Previous arrows or select different range: 0 - 25 , 25 - 50 , 50 - 75 , 75 - 100 , 100 - 125 , 125 - 150 , 150 - 175 , 175 - 200 , 200 - 225 , 225 - 250 , 250 - 275 , 275 - 300 , 300 - 325 , 325 - 350 , 350 - 375 , 375 - 400 , 400 - 425 , 425 - 450 , 450 - 475 | ||
 | Click To Change The Sort Order: By Market Cap or Company Size Performance: Year-to-date, Week and Day |  |
|
Get the most comprehensive stock market coverage daily at 12Stocks.com ➞ Best Stocks Today ➞ Best Stocks Weekly ➞ Best Stocks Year-to-Date ➞ Best Stocks Trends ➞  Best Stocks Today 12Stocks.com Best Nasdaq Stocks ➞ Best S&P 500 Stocks ➞ Best Tech Stocks ➞ Best Biotech Stocks ➞ |
| Detailed Overview of Biotech Stocks |
| Biotech Technical Overview, Leaders & Laggards, Top Biotech ETF Funds & Detailed Biotech Stocks List, Charts, Trends & More |
| Biotech Sector: Technical Analysis, Trends & YTD Performance | |
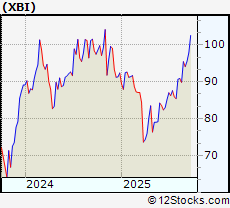
| Biotech sector, as represented by XBI, an exchange-traded fund [ETF] that holds basket of Biotech stocks (e.g, Amgen, Celgene) is up by 12.1001% and is currently underperforming the overall market by -2.6578% year-to-date. Below is a quick view of Technical charts and trends: | |
 XBI Weekly Chart |
|
| Long Term Trend: Very Good | |
| Medium Term Trend: Very Good | |
 XBI Daily Chart |
|
| Short Term Trend: Very Good | |
| Overall Trend Score: 100 | |
| YTD Performance: 12.1001% | |
| **Trend Scores & Views Are Only For Educational Purposes And Not For Investing | |
| 12Stocks.com: Top Performing Biotech Sector Stocks | ||||||||||||||||||||||||||||||||||||||||||||||
 The top performing Biotech sector stocks year to date are
Now, more recently, over last week, the top performing Biotech sector stocks on the move are


|
||||||||||||||||||||||||||||||||||||||||||||||
| 12Stocks.com: Investing in Biotech Sector using Exchange Traded Funds | |
|
The following table shows list of key exchange traded funds (ETF) that
help investors track Biotech Index. For detailed view, check out our ETF Funds section of our website. Quick View: Move mouse or cursor over ETF symbol (ticker) to view short-term Technical chart and over ETF name to view long term chart. Click on ticker or stock name for detailed view. Click on to add stock symbol to your watchlist and to view watchlist. |
12Stocks.com List of ETFs that track Biotech Index
| Ticker | ETF Name | Watchlist | Recent Price | Market Intelligence Score | Change % | Week % | Year-to-date % |
| UBIO | Biotechnology | | 73.34 | 80 | -0.0681292 | 260.748 | 0% |
| HCRF | Edge Multifactor | | 67.14 | 23 | 0 | 9999 | NA |
| SICK | Healthcare Bear 3X | | 37.90 | 36 | 0 | 9999 | NA |
| LABS | Biotech Bear 1X | | 24.18 | 56 | 0 | 9999 | NA |
| BTEC | Principal Healthcare Innovators | | 39.49 | 30 | 0 | 1.02328 | 0% |
| 12Stocks.com: Charts, Trends, Fundamental Data and Performances of Biotech Stocks | |
|
We now take in-depth look at all Biotech stocks including charts, multi-period performances and overall trends (as measured by market intelligence score). One can sort Biotech stocks (click link to choose) by Daily, Weekly and by Year-to-Date performances. Also, one can sort by size of the company or by market capitalization. |
| Select Your Default Chart Type: | |||||
| |||||
| Click on stock symbol or name for detailed view. Click on to add stock symbol to your watchlist and to view watchlist. Quick View: Move mouse or cursor over "Daily" to quickly view daily Technical stock chart and over "Weekly" to view weekly Technical stock chart. | |||||

 | GRTS Gritstone Oncology, Inc. |
| Sector: Health Care | |
| SubSector: Biotechnology | |
| MarketCap: 240.085 Millions | |
| Recent Price: 0.02 Market Intelligence Score: 10 | |
| Day Percent Change: 0% Day Change: -9999 | |
| Week Change: -7.6555% Year-to-date Change: 0.0% | |
| GRTS Links: Profile News Message Board | |
| Charts:- Daily , Weekly | |
| Add GRTS to Watchlist: View: Get Complete GRTS Trend Analysis ➞ | |
 | ANNX Annexon Inc |
| Sector: Health Care | |
| SubSector: Biotechnology | |
| MarketCap: 238.45 Millions | |
| Recent Price: 3.12 Market Intelligence Score: 80 | |
| Day Percent Change: 2.9703% Day Change: 0.03 | |
| Week Change: 10.6383% Year-to-date Change: -43.3% | |
| ANNX Links: Profile News Message Board | |
| Charts:- Daily , Weekly | |
| Add ANNX to Watchlist: View: Get Complete ANNX Trend Analysis ➞ | |
 | STML Stemline Therapeutics, Inc. |
| Sector: Health Care | |
| SubSector: Biotechnology | |
| MarketCap: 235.685 Millions | |
| Recent Price: 23.88 Market Intelligence Score: 50 | |
| Day Percent Change: -0.0418585% Day Change: -9999 | |
| Week Change: 121.933% Year-to-date Change: 0.0% | |
| STML Links: Profile News Message Board | |
| Charts:- Daily , Weekly | |
| Add STML to Watchlist: View: Get Complete STML Trend Analysis ➞ | |
 | VYGR Voyager Therapeutics Inc |
| Sector: Health Care | |
| SubSector: Biotechnology | |
| MarketCap: 235.19 Millions | |
| Recent Price: 4.72 Market Intelligence Score: 100 | |
| Day Percent Change: 0.854701% Day Change: 0.01 | |
| Week Change: 11.0588% Year-to-date Change: -20.9% | |
| VYGR Links: Profile News Message Board | |
| Charts:- Daily , Weekly | |
| Add VYGR to Watchlist: View: Get Complete VYGR Trend Analysis ➞ | |
 | LYEL Lyell Immunopharma Inc |
| Sector: Health Care | |
| SubSector: Biotechnology | |
| MarketCap: 233.42 Millions | |
| Recent Price: 15.81 Market Intelligence Score: 90 | |
| Day Percent Change: -4.4713% Day Change: 0 | |
| Week Change: 17.5465% Year-to-date Change: 22.6% | |
| LYEL Links: Profile News Message Board | |
| Charts:- Daily , Weekly | |
| Add LYEL to Watchlist: View: Get Complete LYEL Trend Analysis ➞ | |
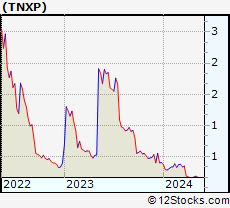 | TNXP Tonix Pharmaceuticals Holding Corp |
| Sector: Health Care | |
| SubSector: Biotechnology | |
| MarketCap: 232.65 Millions | |
| Recent Price: 24.72 Market Intelligence Score: 10 | |
| Day Percent Change: 1.53702% Day Change: -0.2 | |
| Week Change: 0.0809717% Year-to-date Change: -21.3% | |
| TNXP Links: Profile News Message Board | |
| Charts:- Daily , Weekly | |
| Add TNXP to Watchlist: View: Get Complete TNXP Trend Analysis ➞ | |
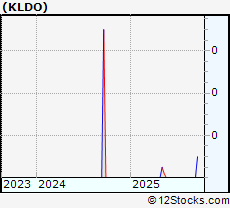 | KLDO Kaleido BioSciences, Inc. |
| Sector: Health Care | |
| SubSector: Biotechnology | |
| MarketCap: 229.185 Millions | |
| Recent Price: 0.01 Market Intelligence Score: 80 | |
| Day Percent Change: 9900% Day Change: -9999 | |
| Week Change: 9900% Year-to-date Change: 9,900.0% | |
| KLDO Links: Profile News Message Board | |
| Charts:- Daily , Weekly | |
| Add KLDO to Watchlist: View: Get Complete KLDO Trend Analysis ➞ | |
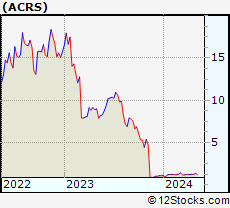 | ACRS Aclaris Therapeutics Inc |
| Sector: Health Care | |
| SubSector: Biotechnology | |
| MarketCap: 227.5 Millions | |
| Recent Price: 1.83 Market Intelligence Score: 20 | |
| Day Percent Change: -1.87166% Day Change: -0.06 | |
| Week Change: -1.87166% Year-to-date Change: -26.0% | |
| ACRS Links: Profile News Message Board | |
| Charts:- Daily , Weekly | |
| Add ACRS to Watchlist: View: Get Complete ACRS Trend Analysis ➞ | |
 | HUMA Humacyte Inc |
| Sector: Health Care | |
| SubSector: Biotechnology | |
| MarketCap: 226.47 Millions | |
| Recent Price: 1.78 Market Intelligence Score: 70 | |
| Day Percent Change: 1.42045% Day Change: -0.09 | |
| Week Change: 6.25% Year-to-date Change: -65.5% | |
| HUMA Links: Profile News Message Board | |
| Charts:- Daily , Weekly | |
| Add HUMA to Watchlist: View: Get Complete HUMA Trend Analysis ➞ | |
 | ACIU AC Immune SA |
| Sector: Health Care | |
| SubSector: Biotechnology | |
| MarketCap: 225.59 Millions | |
| Recent Price: 3.16 Market Intelligence Score: 100 | |
| Day Percent Change: 3.94737% Day Change: -0.04 | |
| Week Change: 15.7509% Year-to-date Change: 10.9% | |
| ACIU Links: Profile News Message Board | |
| Charts:- Daily , Weekly | |
| Add ACIU to Watchlist: View: Get Complete ACIU Trend Analysis ➞ | |
 | MRNS Marinus Pharmaceuticals, Inc. |
| Sector: Health Care | |
| SubSector: Biotechnology | |
| MarketCap: 222.885 Millions | |
| Recent Price: 0.55 Market Intelligence Score: 50 | |
| Day Percent Change: 0% Day Change: -9999 | |
| Week Change: 0.566831% Year-to-date Change: 3.0% | |
| MRNS Links: Profile News Message Board | |
| Charts:- Daily , Weekly | |
| Add MRNS to Watchlist: View: Get Complete MRNS Trend Analysis ➞ | |
 | TNYA Tenaya Therapeutics Inc |
| Sector: Health Care | |
| SubSector: Biotechnology | |
| MarketCap: 220.02 Millions | |
| Recent Price: 1.60 Market Intelligence Score: 80 | |
| Day Percent Change: -4.46429% Day Change: -0.08 | |
| Week Change: 2.88462% Year-to-date Change: 13.0% | |
| TNYA Links: Profile News Message Board | |
| Charts:- Daily , Weekly | |
| Add TNYA to Watchlist: View: Get Complete TNYA Trend Analysis ➞ | |
 | CDXS Codexis Inc |
| Sector: Health Care | |
| SubSector: Biotechnology | |
| MarketCap: 218.45 Millions | |
| Recent Price: 2.52 Market Intelligence Score: 50 | |
| Day Percent Change: 0.8% Day Change: 0 | |
| Week Change: 1.6129% Year-to-date Change: -49.6% | |
| CDXS Links: Profile News Message Board | |
| Charts:- Daily , Weekly | |
| Add CDXS to Watchlist: View: Get Complete CDXS Trend Analysis ➞ | |
 | AMAG AMAG Pharmaceuticals, Inc. |
| Sector: Health Care | |
| SubSector: Biotechnology | |
| MarketCap: 217.385 Millions | |
| Recent Price: 1.17 Market Intelligence Score: 10 | |
| Day Percent Change: -2.5% Day Change: -9999 | |
| Week Change: -71.9424% Year-to-date Change: 0.0% | |
| AMAG Links: Profile News Message Board | |
| Charts:- Daily , Weekly | |
| Add AMAG to Watchlist: View: Get Complete AMAG Trend Analysis ➞ | |
 | XOMAO XOMA Corporation |
| Sector: Health Care | |
| SubSector: Biotechnology | |
| MarketCap: 217 Millions | |
| Recent Price: 25.39 Market Intelligence Score: 40 | |
| Day Percent Change: -0.703562% Day Change: 0.25 | |
| Week Change: 0.0788333% Year-to-date Change: 5.4% | |
| XOMAO Links: Profile News Message Board | |
| Charts:- Daily , Weekly | |
| Add XOMAO to Watchlist: View: Get Complete XOMAO Trend Analysis ➞ | |
 | RAPT RAPT Therapeutics Inc |
| Sector: Health Care | |
| SubSector: Biotechnology | |
| MarketCap: 213.83 Millions | |
| Recent Price: 27.24 Market Intelligence Score: 70 | |
| Day Percent Change: 5.62233% Day Change: 0.4 | |
| Week Change: 29.9618% Year-to-date Change: 108.9% | |
| RAPT Links: Profile News Message Board | |
| Charts:- Daily , Weekly | |
| Add RAPT to Watchlist: View: Get Complete RAPT Trend Analysis ➞ | |
 | OABI OmniAb Inc |
| Sector: Health Care | |
| SubSector: Biotechnology | |
| MarketCap: 209.82 Millions | |
| Recent Price: 1.60 Market Intelligence Score: 10 | |
| Day Percent Change: -0.310559% Day Change: -0.03 | |
| Week Change: 1.58228% Year-to-date Change: -54.1% | |
| OABI Links: Profile News Message Board | |
| Charts:- Daily , Weekly | |
| Add OABI to Watchlist: View: Get Complete OABI Trend Analysis ➞ | |
 | ENZY Enzymotec Ltd. |
| Sector: Health Care | |
| SubSector: Biotechnology | |
| MarketCap: 209.53 Millions | |
| Recent Price: 42.29 Market Intelligence Score: 70 | |
| Day Percent Change: -1.07602% Day Change: -9999 | |
| Week Change: 2125.79% Year-to-date Change: 0.0% | |
| ENZY Links: Profile News Message Board | |
| Charts:- Daily , Weekly | |
| Add ENZY to Watchlist: View: Get Complete ENZY Trend Analysis ➞ | |
 | TCRR TCR2 Therapeutics Inc. |
| Sector: Health Care | |
| SubSector: Biotechnology | |
| MarketCap: 206.285 Millions | |
| Recent Price: 1.48 Market Intelligence Score: 20 | |
| Day Percent Change: 0% Day Change: -9999 | |
| Week Change: 0% Year-to-date Change: 0.0% | |
| TCRR Links: Profile News Message Board | |
| Charts:- Daily , Weekly | |
| Add TCRR to Watchlist: View: Get Complete TCRR Trend Analysis ➞ | |
 | CERC Cerecor Inc. |
| Sector: Health Care | |
| SubSector: Biotechnology | |
| MarketCap: 205.885 Millions | |
| Recent Price: 6652.80 Market Intelligence Score: 70 | |
| Day Percent Change: 4.05405% Day Change: -9999 | |
| Week Change: 3.125% Year-to-date Change: 0.0% | |
| CERC Links: Profile News Message Board | |
| Charts:- Daily , Weekly | |
| Add CERC to Watchlist: View: Get Complete CERC Trend Analysis ➞ | |
 | CDMO Avid Bioservices, Inc. |
| Sector: Health Care | |
| SubSector: Biotechnology | |
| MarketCap: 203.685 Millions | |
| Recent Price: 12.49 Market Intelligence Score: 40 | |
| Day Percent Change: 0.0801282% Day Change: -9999 | |
| Week Change: 0.321285% Year-to-date Change: 1.4% | |
| CDMO Links: Profile News Message Board | |
| Charts:- Daily , Weekly | |
| Add CDMO to Watchlist: View: Get Complete CDMO Trend Analysis ➞ | |
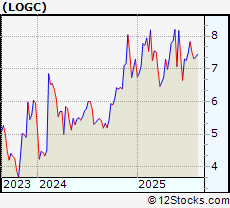 | LOGC LogicBio Therapeutics, Inc. |
| Sector: Health Care | |
| SubSector: Biotechnology | |
| MarketCap: 203.485 Millions | |
| Recent Price: 7.41 Market Intelligence Score: 30 | |
| Day Percent Change: -0.536913% Day Change: -9999 | |
| Week Change: 0.135135% Year-to-date Change: 6.9% | |
| LOGC Links: Profile News Message Board | |
| Charts:- Daily , Weekly | |
| Add LOGC to Watchlist: View: Get Complete LOGC Trend Analysis ➞ | |
 | OASM Oasmia Pharmaceutical AB (publ) |
| Sector: Health Care | |
| SubSector: Biotechnology | |
| MarketCap: 203.02 Millions | |
| Recent Price: 17.03 Market Intelligence Score: 0 | |
| Day Percent Change: -1.10337% Day Change: -9999 | |
| Week Change: -55.5585% Year-to-date Change: 0.0% | |
| OASM Links: Profile News Message Board | |
| Charts:- Daily , Weekly | |
| Add OASM to Watchlist: View: Get Complete OASM Trend Analysis ➞ | |
 | TRDA Entrada Therapeutics Inc |
| Sector: Health Care | |
| SubSector: Biotechnology | |
| MarketCap: 201.22 Millions | |
| Recent Price: 5.92 Market Intelligence Score: 25 | |
| Day Percent Change: 10.55% Day Change: 0.56 | |
| Week Change: 11.81% Year-to-date Change: -66.1% | |
| TRDA Links: Profile News Message Board | |
| Charts:- Daily , Weekly | |
| Add TRDA to Watchlist: View: Get Complete TRDA Trend Analysis ➞ | |
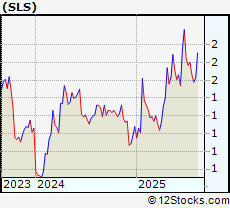 | SLS SELLAS Life Sciences Group Inc |
| Sector: Health Care | |
| SubSector: Biotechnology | |
| MarketCap: 201.12 Millions | |
| Recent Price: 1.71 Market Intelligence Score: 50 | |
| Day Percent Change: 1.18343% Day Change: -0.09 | |
| Week Change: 4.90798% Year-to-date Change: 59.8% | |
| SLS Links: Profile News Message Board | |
| Charts:- Daily , Weekly | |
| Add SLS to Watchlist: View: Get Complete SLS Trend Analysis ➞ | |
| To view more stocks, click on Next / Previous arrows or select different range: 0 - 25 , 25 - 50 , 50 - 75 , 75 - 100 , 100 - 125 , 125 - 150 , 150 - 175 , 175 - 200 , 200 - 225 , 225 - 250 , 250 - 275 , 275 - 300 , 300 - 325 , 325 - 350 , 350 - 375 , 375 - 400 , 400 - 425 , 425 - 450 , 450 - 475 | ||
| Click To Change The Sort Order: By Market Cap or Company Size Performance: Year-to-date, Week and Day | |
| Select Chart Type: | ||
|
Best Stocks Today 12Stocks.com |
© 2025 12Stocks.com Terms & Conditions Privacy Contact Us
All Information Provided Only For Education And Not To Be Used For Investing or Trading. See Terms & Conditions


One More Thing ... Get Best Stocks Delivered Daily!
Never Ever Miss A Move With Our Top Ten Stocks Lists
Find Best Stocks In Any Market - Bull or Bear Market
Take A Peek At Our Top Ten Stocks Lists: Daily, Weekly, Year-to-Date & Top Trends
Find Best Stocks In Any Market - Bull or Bear Market
Take A Peek At Our Top Ten Stocks Lists: Daily, Weekly, Year-to-Date & Top Trends
Biotech Stocks With Best Up Trends [0-bearish to 100-bullish]: Taysha Gene[100], DBV Technologies[100], Valneva SE[100], Prime Medicine[100], AlloVir [100], Sarepta [100], Monopar [100], Cara [100], Absci Corp[100], Spruce [100], Cabaletta Bio[100]
Best Biotech Stocks Year-to-Date:
Kaleido [9900%], Vor Biopharma[3175%], Nanobiotix ADR[581.379%], I-Mab ADR[357.506%], Monopar [337.489%], Nektar [319.84%], DBV Technologies[276.923%], Celcuity [276.39%], Galectin [263.248%], Cidara [260.806%], Lineage Cell[233.981%] Best Biotech Stocks This Week:
Athersys [193287%], VBI Vaccines[86898.5%], ContraFect [47677.8%], Clovis Oncology[39610.5%], NanoString Technologies[17224.7%], Neptune Wellness[14100%], Achillion [10033.3%], Kaleido [9900%], Nymox [8258.49%], Epizyme [5739.46%], Portola [4717.55%] Best Biotech Stocks Daily:
Kaleido [9900%], Neoleukin [332.665%], Syros [226.23%], Athenex [103.333%], Taysha Gene[53.4591%], DBV Technologies[21.6485%], Valneva SE[20.197%], Prime Medicine[19.4097%], Aptose [17.5439%], AlloVir [16.9215%], Sarepta [15.6832%]