
 Login Sign Up


| |||||
 |  | ||||

| 12Stocks.com Market Intelligence |
Best Biotech Stocks
|
|
| Quick Read: Best Biotech Stocks List By Performances & Trends: Daily, Weekly, Year-to-Date, Market Cap (Size) & Technical Trends | |||
| Best Biotech Stocks Views: Quick Browse View, Summary & Slide Show View | |||
| 12Stocks.com Biotech Stocks Performances & Trends Daily | |||||||||
|
|  The overall market intelligence score is 10 (0-bearish to 100-bullish) which puts Biotech sector in short term bearish trend. The market intelligence score from previous trading session is 0 and hence an improvement of trend.
| ||||||||
Here are the market intelligence trend scores of the most requested Biotech stocks at 12Stocks.com (click stock name for detailed review):
|


| 12Stocks.com: Investing in Biotech sector with Stocks | |
|
The following table helps investors and traders sort through current performance and trends (as measured by market intelligence score) of various
stocks in the Biotech sector. Quick View: Move mouse or cursor over stock symbol (ticker) to view short-term Technical chart and over stock name to view long term chart. Click on  to add stock symbol to your watchlist and to add stock symbol to your watchlist and  to view watchlist. Click on any ticker or stock name for detailed market intelligence report for that stock. to view watchlist. Click on any ticker or stock name for detailed market intelligence report for that stock. |
12Stocks.com Performance of Stocks in Biotech Sector
| Ticker | Stock Name | Watchlist | Category | Recent Price | Market Intelligence Score | Change % | YTD Change% |
| FATE | Fate |   | Biotechnology | 4.79 | 15 | -4.96% | 28.07% |
| DNLI | Denali | | Biotechnology | 15.98 | 13 | -3.73% | -25.54% |
| IGMS | IGM | | Biotechnology | 7.20 | 5 | -2.83% | -13.36% |
| VTYX | Ventyx | | Biotechnology | 4.47 | 53 | 0.45% | 80.61% |
| CRON | Cronos | | Biotechnology | 2.37 | 41 | -1.66% | 13.40% |
| ABCL | AbCellera Biologics | | Biotechnology | 3.87 | 5 | -2.27% | -31.50% |
| XNCR | Xencor | | Biotechnology | 18.38 | 0 | -3.01% | -13.42% |
| SAGE | Sage | | Biotechnology | 13.33 | 17 | 2.26% | -38.49% |
| GPCR | Structure | | Biotechnology | 36.36 | 0 | -1.34% | -4.50% |
| ACLX | Arcellx | | Biotechnology | 51.65 | 10 | -4.78% | -7.45% |
| AMLX | Amylyx | | Biotechnology | 1.87 | 15 | -7.20% | -87.07% |
| AXON | Axovant | | Biotechnology | 293.61 | 26 | -1.34% | 13.66% |
| KPTI | Karyopharm | | Biotechnology | 1.17 | 51 | -8.59% | 35.26% |
| RXRX | Recursion | | Biotechnology | 7.35 | 10 | -2.58% | -24.92% |
| INSM | Insmed | | Biotechnology | 24.32 | 0 | -1.94% | -21.52% |
| PRME | Prime Medicine | | Biotechnology | 4.51 | 55 | -8.52% | -50.55% |
| TBPH | Theravance Biopharma | | Biotechnology | 9.34 | 32 | 1.52% | -16.90% |
| ZYME | Zymeworks | | Biotechnology | 8.85 | 17 | 2.08% | -14.82% |
| LGND | Ligand | | Biotechnology | 72.47 | 31 | -0.07% | 1.47% |
| AUPH | Aurinia | | Biotechnology | 4.99 | 27 | 3.74% | -44.49% |
| DERM | Dermira | | Biotechnology | 3.48 | 10 | -2.79% | -39.58% |
| SWTX | SpringWorks | | Biotechnology | 40.08 | 0 | -5.64% | 9.79% |
| RGNX | REGENXBIO | | Biotechnology | 15.69 | 36 | -2.61% | -12.59% |
| CORT | Corcept | | Biotechnology | 22.95 | 36 | 1.28% | -29.34% |
| SANA | Sana nology | | Biotechnology | 7.61 | 31 | -3.30% | 84.04% |
| To view more stocks, click on Next / Previous arrows or select different range: 0 - 25 , 25 - 50 , 50 - 75 , 75 - 100 , 100 - 125 , 125 - 150 , 150 - 175 , 175 - 200 , 200 - 225 , 225 - 250 , 250 - 275 , 275 - 300 , 300 - 325 , 325 - 350 , 350 - 375 , 375 - 400 | ||
 | Click To Change The Sort Order: By Market Cap or Company Size Performance: Year-to-date, Week and Day |  |
|
Get the most comprehensive stock market coverage daily at 12Stocks.com ➞ Best Stocks Today ➞ Best Stocks Weekly ➞ Best Stocks Year-to-Date ➞ Best Stocks Trends ➞  Best Stocks Today 12Stocks.com Best Nasdaq Stocks ➞ Best S&P 500 Stocks ➞ Best Tech Stocks ➞ Best Biotech Stocks ➞ |
| Detailed Overview of Biotech Stocks |
| Biotech Technical Overview, Leaders & Laggards, Top Biotech ETF Funds & Detailed Biotech Stocks List, Charts, Trends & More |
| Biotech Sector: Technical Analysis, Trends & YTD Performance | |
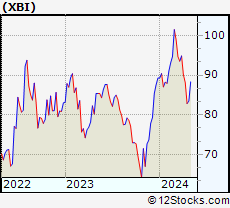
| Biotech sector, as represented by XBI, an exchange-traded fund [ETF] that holds basket of Biotech stocks (e.g, Amgen, Celgene) is down by -7.23% and is currently underperforming the overall market by -10.61% year-to-date. Below is a quick view of Technical charts and trends: | |
 XBI Weekly Chart |
|
| Long Term Trend: Not Good | |
| Medium Term Trend: Not Good | |
 XBI Daily Chart |
|
| Short Term Trend: Very Good | |
| Overall Trend Score: 10 | |
| YTD Performance: -7.23% | |
| **Trend Scores & Views Are Only For Educational Purposes And Not For Investing | |
| 12Stocks.com: Top Performing Biotech Sector Stocks | ||||||||||||||||||||||||||||||||||||||||||||||||
 The top performing Biotech sector stocks year to date are
Now, more recently, over last week, the top performing Biotech sector stocks on the move are


|
||||||||||||||||||||||||||||||||||||||||||||||||
| 12Stocks.com: Investing in Biotech Sector using Exchange Traded Funds | |
|
The following table shows list of key exchange traded funds (ETF) that
help investors track Biotech Index. For detailed view, check out our ETF Funds section of our website. Quick View: Move mouse or cursor over ETF symbol (ticker) to view short-term Technical chart and over ETF name to view long term chart. Click on ticker or stock name for detailed view. Click on to add stock symbol to your watchlist and to view watchlist. |
12Stocks.com List of ETFs that track Biotech Index
| Ticker | ETF Name | Watchlist | Recent Price | Market Intelligence Score | Change % | Week % | Year-to-date % |
| LABD | Biotech Bear 3X | | 10.80 | 80 | 2.66 | 20.27 | 11.46% |
| XBI | Biotech | | 82.83 | 10 | -0.78 | -6.04 | -7.23% |
| LABU | Biotech Bull 3X | | 86.05 | 10 | -2.26 | -17.54 | -29.45% |
| IBB | Biotechnology | | 124.72 | 10 | 0.06 | -3.75 | -8.19% |
| IYH | Healthcare | | 58.16 | 10 | 0.19 | -0.41 | 1.59% |
| IXJ | Global Healthcare | | 87.75 | 25 | 0.39 | -0.26 | 1.19% |
| IHF | Healthcare Providers | | 52.21 | 62 | 1.29 | 3.3 | -0.57% |
| CURE | Healthcare Bull 3X | | 103.33 | 25 | 1.09 | -0.06 | 1.56% |
| FBT | First NYSE | | 141.68 | 10 | 0.11 | -3.83 | -10.36% |
| BIB | Biotechnology | | 48.20 | 10 | 0.54 | -6.21 | -15.51% |
| BIS | Short Biotech | | 20.90 | 95 | 0.14 | 6.61 | 15.63% |
| PTH | DWA Healthcare Momentum | | 39.53 | 23 | -0.10 | -5.5 | 1% |
| BBH | Biotech | | 152.36 | 10 | 0.01 | -3.32 | -7.83% |
| PBE | Biotech & Genome | | 59.85 | 10 | 0.39 | -2.29 | -9.1% |
| BBC | Bio Biotechnology Clinical | | 24.71 | 23 | -3.02 | -8.9 | 1.05% |
| BBP | Bio Biotechnology Products | | 50.43 | 0 | -0.34 | -5.02 | -13.19% |
| BTEC | Principal Healthcare Innovators | | 33.86 | 0 | -0.67 | -5.92 | -6.8% |
| 12Stocks.com: Charts, Trends, Fundamental Data and Performances of Biotech Stocks | |
|
We now take in-depth look at all Biotech stocks including charts, multi-period performances and overall trends (as measured by market intelligence score). One can sort Biotech stocks (click link to choose) by Daily, Weekly and by Year-to-Date performances. Also, one can sort by size of the company or by market capitalization. |
| Select Your Default Chart Type: | |||||
| |||||
| Click on stock symbol or name for detailed view. Click on to add stock symbol to your watchlist and to view watchlist. Quick View: Move mouse or cursor over "Daily" to quickly view daily Technical stock chart and over "Weekly" to view weekly Technical stock chart. | |||||

 | FATE Fate Therapeutics, Inc. |
| Sector: Health Care | |
| SubSector: Biotechnology | |
| MarketCap: 2022.45 Millions | |
| Recent Price: 4.79 Market Intelligence Score: 15 | |
| Day Percent Change: -4.96% Day Change: -0.25 | |
| Week Change: -19.5% Year-to-date Change: 28.1% | |
| FATE Links: Profile News Message Board | |
| Charts:- Daily , Weekly | |
| Add FATE to Watchlist: View: Get Complete FATE Trend Analysis ➞ | |
 | DNLI Denali Therapeutics Inc. |
| Sector: Health Care | |
| SubSector: Biotechnology | |
| MarketCap: 2020.05 Millions | |
| Recent Price: 15.98 Market Intelligence Score: 13 | |
| Day Percent Change: -3.73% Day Change: -0.62 | |
| Week Change: -12.49% Year-to-date Change: -25.5% | |
| DNLI Links: Profile News Message Board | |
| Charts:- Daily , Weekly | |
| Add DNLI to Watchlist: View: Get Complete DNLI Trend Analysis ➞ | |
 | IGMS IGM Biosciences, Inc. |
| Sector: Health Care | |
| SubSector: Biotechnology | |
| MarketCap: 2000.05 Millions | |
| Recent Price: 7.20 Market Intelligence Score: 5 | |
| Day Percent Change: -2.83% Day Change: -0.21 | |
| Week Change: -21.4% Year-to-date Change: -13.4% | |
| IGMS Links: Profile News Message Board | |
| Charts:- Daily , Weekly | |
| Add IGMS to Watchlist: View: Get Complete IGMS Trend Analysis ➞ | |
 | VTYX Ventyx Biosciences, Inc. |
| Sector: Health Care | |
| SubSector: Biotechnology | |
| MarketCap: 1950 Millions | |
| Recent Price: 4.47 Market Intelligence Score: 53 | |
| Day Percent Change: 0.45% Day Change: 0.02 | |
| Week Change: -2.83% Year-to-date Change: 80.6% | |
| VTYX Links: Profile News Message Board | |
| Charts:- Daily , Weekly | |
| Add VTYX to Watchlist: View: Get Complete VTYX Trend Analysis ➞ | |
 | CRON Cronos Group Inc. |
| Sector: Health Care | |
| SubSector: Biotechnology | |
| MarketCap: 1935.95 Millions | |
| Recent Price: 2.37 Market Intelligence Score: 41 | |
| Day Percent Change: -1.66% Day Change: -0.04 | |
| Week Change: -6.69% Year-to-date Change: 13.4% | |
| CRON Links: Profile News Message Board | |
| Charts:- Daily , Weekly | |
| Add CRON to Watchlist: View: Get Complete CRON Trend Analysis ➞ | |
 | ABCL AbCellera Biologics Inc. |
| Sector: Health Care | |
| SubSector: Biotechnology | |
| MarketCap: 1870 Millions | |
| Recent Price: 3.87 Market Intelligence Score: 5 | |
| Day Percent Change: -2.27% Day Change: -0.09 | |
| Week Change: -10.83% Year-to-date Change: -31.5% | |
| ABCL Links: Profile News Message Board | |
| Charts:- Daily , Weekly | |
| Add ABCL to Watchlist: View: Get Complete ABCL Trend Analysis ➞ | |
 | XNCR Xencor, Inc. |
| Sector: Health Care | |
| SubSector: Biotechnology | |
| MarketCap: 1744.35 Millions | |
| Recent Price: 18.38 Market Intelligence Score: 0 | |
| Day Percent Change: -3.01% Day Change: -0.57 | |
| Week Change: -10.25% Year-to-date Change: -13.4% | |
| XNCR Links: Profile News Message Board | |
| Charts:- Daily , Weekly | |
| Add XNCR to Watchlist: View: Get Complete XNCR Trend Analysis ➞ | |
 | SAGE Sage Therapeutics, Inc. |
| Sector: Health Care | |
| SubSector: Biotechnology | |
| MarketCap: 1683.75 Millions | |
| Recent Price: 13.33 Market Intelligence Score: 17 | |
| Day Percent Change: 2.26% Day Change: 0.29 | |
| Week Change: -13.67% Year-to-date Change: -38.5% | |
| SAGE Links: Profile News Message Board | |
| Charts:- Daily , Weekly | |
| Add SAGE to Watchlist: View: Get Complete SAGE Trend Analysis ➞ | |
 | GPCR Structure Therapeutics Inc. |
| Sector: Health Care | |
| SubSector: Biotechnology | |
| MarketCap: 1530 Millions | |
| Recent Price: 36.36 Market Intelligence Score: 0 | |
| Day Percent Change: -1.34% Day Change: -0.49 | |
| Week Change: -7.53% Year-to-date Change: -4.5% | |
| GPCR Links: Profile News Message Board | |
| Charts:- Daily , Weekly | |
| Add GPCR to Watchlist: View: Get Complete GPCR Trend Analysis ➞ | |
 | ACLX Arcellx, Inc. |
| Sector: Health Care | |
| SubSector: Biotechnology | |
| MarketCap: 1530 Millions | |
| Recent Price: 51.65 Market Intelligence Score: 10 | |
| Day Percent Change: -4.78% Day Change: -2.59 | |
| Week Change: -11.06% Year-to-date Change: -7.5% | |
| ACLX Links: Profile News Message Board | |
| Charts:- Daily , Weekly | |
| Add ACLX to Watchlist: View: Get Complete ACLX Trend Analysis ➞ | |
 | AMLX Amylyx Pharmaceuticals, Inc. |
| Sector: Health Care | |
| SubSector: Biotechnology | |
| MarketCap: 1500 Millions | |
| Recent Price: 1.87 Market Intelligence Score: 15 | |
| Day Percent Change: -7.20% Day Change: -0.15 | |
| Week Change: -10.95% Year-to-date Change: -87.1% | |
| AMLX Links: Profile News Message Board | |
| Charts:- Daily , Weekly | |
| Add AMLX to Watchlist: View: Get Complete AMLX Trend Analysis ➞ | |
 | AXON Axovant Sciences Ltd. |
| Sector: Health Care | |
| SubSector: Biotechnology | |
| MarketCap: 1492.04 Millions | |
| Recent Price: 293.61 Market Intelligence Score: 26 | |
| Day Percent Change: -1.34% Day Change: -3.98 | |
| Week Change: -5.54% Year-to-date Change: 13.7% | |
| AXON Links: Profile News Message Board | |
| Charts:- Daily , Weekly | |
| Add AXON to Watchlist: View: Get Complete AXON Trend Analysis ➞ | |
 | KPTI Karyopharm Therapeutics Inc. |
| Sector: Health Care | |
| SubSector: Biotechnology | |
| MarketCap: 1471.85 Millions | |
| Recent Price: 1.17 Market Intelligence Score: 51 | |
| Day Percent Change: -8.59% Day Change: -0.11 | |
| Week Change: -4.1% Year-to-date Change: 35.3% | |
| KPTI Links: Profile News Message Board | |
| Charts:- Daily , Weekly | |
| Add KPTI to Watchlist: View: Get Complete KPTI Trend Analysis ➞ | |
 | RXRX Recursion Pharmaceuticals, Inc. |
| Sector: Health Care | |
| SubSector: Biotechnology | |
| MarketCap: 1470 Millions | |
| Recent Price: 7.35 Market Intelligence Score: 10 | |
| Day Percent Change: -2.58% Day Change: -0.20 | |
| Week Change: -12.6% Year-to-date Change: -24.9% | |
| RXRX Links: Profile News Message Board | |
| Charts:- Daily , Weekly | |
| Add RXRX to Watchlist: View: Get Complete RXRX Trend Analysis ➞ | |
 | INSM Insmed Incorporated |
| Sector: Health Care | |
| SubSector: Biotechnology | |
| MarketCap: 1452.45 Millions | |
| Recent Price: 24.32 Market Intelligence Score: 0 | |
| Day Percent Change: -1.94% Day Change: -0.48 | |
| Week Change: -10.75% Year-to-date Change: -21.5% | |
| INSM Links: Profile News Message Board | |
| Charts:- Daily , Weekly | |
| Add INSM to Watchlist: View: Get Complete INSM Trend Analysis ➞ | |
 | PRME Prime Medicine, Inc. |
| Sector: Health Care | |
| SubSector: Biotechnology | |
| MarketCap: 1440 Millions | |
| Recent Price: 4.51 Market Intelligence Score: 55 | |
| Day Percent Change: -8.52% Day Change: -0.42 | |
| Week Change: -21.29% Year-to-date Change: -50.6% | |
| PRME Links: Profile News Message Board | |
| Charts:- Daily , Weekly | |
| Add PRME to Watchlist: View: Get Complete PRME Trend Analysis ➞ | |
 | TBPH Theravance Biopharma, Inc. |
| Sector: Health Care | |
| SubSector: Biotechnology | |
| MarketCap: 1404.55 Millions | |
| Recent Price: 9.34 Market Intelligence Score: 32 | |
| Day Percent Change: 1.52% Day Change: 0.14 | |
| Week Change: -2.81% Year-to-date Change: -16.9% | |
| TBPH Links: Profile News Message Board | |
| Charts:- Daily , Weekly | |
| Add TBPH to Watchlist: View: Get Complete TBPH Trend Analysis ➞ | |
 | ZYME Zymeworks Inc. |
| Sector: Health Care | |
| SubSector: Biotechnology | |
| MarketCap: 1373.55 Millions | |
| Recent Price: 8.85 Market Intelligence Score: 17 | |
| Day Percent Change: 2.08% Day Change: 0.18 | |
| Week Change: -4.32% Year-to-date Change: -14.8% | |
| ZYME Links: Profile News Message Board | |
| Charts:- Daily , Weekly | |
| Add ZYME to Watchlist: View: Get Complete ZYME Trend Analysis ➞ | |
 | LGND Ligand Pharmaceuticals Incorporated |
| Sector: Health Care | |
| SubSector: Biotechnology | |
| MarketCap: 1344.45 Millions | |
| Recent Price: 72.47 Market Intelligence Score: 31 | |
| Day Percent Change: -0.07% Day Change: -0.05 | |
| Week Change: -10.93% Year-to-date Change: 1.5% | |
| LGND Links: Profile News Message Board | |
| Charts:- Daily , Weekly | |
| Add LGND to Watchlist: View: Get Complete LGND Trend Analysis ➞ | |
 | AUPH Aurinia Pharmaceuticals Inc. |
| Sector: Health Care | |
| SubSector: Biotechnology | |
| MarketCap: 1319.75 Millions | |
| Recent Price: 4.99 Market Intelligence Score: 27 | |
| Day Percent Change: 3.74% Day Change: 0.18 | |
| Week Change: -2.16% Year-to-date Change: -44.5% | |
| AUPH Links: Profile News Message Board | |
| Charts:- Daily , Weekly | |
| Add AUPH to Watchlist: View: Get Complete AUPH Trend Analysis ➞ | |
 | DERM Dermira, Inc. |
| Sector: Health Care | |
| SubSector: Biotechnology | |
| MarketCap: 1312.25 Millions | |
| Recent Price: 3.48 Market Intelligence Score: 10 | |
| Day Percent Change: -2.79% Day Change: -0.10 | |
| Week Change: -21.27% Year-to-date Change: -39.6% | |
| DERM Links: Profile News Message Board | |
| Charts:- Daily , Weekly | |
| Add DERM to Watchlist: View: Get Complete DERM Trend Analysis ➞ | |
 | SWTX SpringWorks Therapeutics, Inc. |
| Sector: Health Care | |
| SubSector: Biotechnology | |
| MarketCap: 1311.85 Millions | |
| Recent Price: 40.08 Market Intelligence Score: 0 | |
| Day Percent Change: -5.64% Day Change: -2.39 | |
| Week Change: -6.26% Year-to-date Change: 9.8% | |
| SWTX Links: Profile News Message Board | |
| Charts:- Daily , Weekly | |
| Add SWTX to Watchlist: View: Get Complete SWTX Trend Analysis ➞ | |
 | RGNX REGENXBIO Inc. |
| Sector: Health Care | |
| SubSector: Biotechnology | |
| MarketCap: 1232.85 Millions | |
| Recent Price: 15.69 Market Intelligence Score: 36 | |
| Day Percent Change: -2.61% Day Change: -0.42 | |
| Week Change: -13.27% Year-to-date Change: -12.6% | |
| RGNX Links: Profile News Message Board | |
| Charts:- Daily , Weekly | |
| Add RGNX to Watchlist: View: Get Complete RGNX Trend Analysis ➞ | |
 | CORT Corcept Therapeutics Incorporated |
| Sector: Health Care | |
| SubSector: Biotechnology | |
| MarketCap: 1228.45 Millions | |
| Recent Price: 22.95 Market Intelligence Score: 36 | |
| Day Percent Change: 1.28% Day Change: 0.29 | |
| Week Change: -2.38% Year-to-date Change: -29.3% | |
| CORT Links: Profile News Message Board | |
| Charts:- Daily , Weekly | |
| Add CORT to Watchlist: View: Get Complete CORT Trend Analysis ➞ | |
 | SANA Sana Biotechnology, Inc. |
| Sector: Health Care | |
| SubSector: Biotechnology | |
| MarketCap: 1210 Millions | |
| Recent Price: 7.61 Market Intelligence Score: 31 | |
| Day Percent Change: -3.30% Day Change: -0.26 | |
| Week Change: -15.07% Year-to-date Change: 84.0% | |
| SANA Links: Profile News Message Board | |
| Charts:- Daily , Weekly | |
| Add SANA to Watchlist: View: Get Complete SANA Trend Analysis ➞ | |
| To view more stocks, click on Next / Previous arrows or select different range: 0 - 25 , 25 - 50 , 50 - 75 , 75 - 100 , 100 - 125 , 125 - 150 , 150 - 175 , 175 - 200 , 200 - 225 , 225 - 250 , 250 - 275 , 275 - 300 , 300 - 325 , 325 - 350 , 350 - 375 , 375 - 400 | ||
| Click To Change The Sort Order: By Market Cap or Company Size Performance: Year-to-date, Week and Day | |
| Select Chart Type: | ||
|
Best Stocks Today 12Stocks.com |
© 2024 12Stocks.com Terms & Conditions Privacy Contact Us
All Information Provided Only For Education And Not To Be Used For Investing or Trading. See Terms & Conditions


One More Thing ... Get Best Stocks Delivered Daily!
Never Ever Miss A Move With Our Top Ten Stocks Lists
Find Best Stocks In Any Market - Bull or Bear Market
Take A Peek At Our Top Ten Stocks Lists: Daily, Weekly, Year-to-Date & Top Trends
Find Best Stocks In Any Market - Bull or Bear Market
Take A Peek At Our Top Ten Stocks Lists: Daily, Weekly, Year-to-Date & Top Trends
Biotech Stocks With Best Up Trends [0-bearish to 100-bullish]: Vanda [100], Humacyte [95], ALX Oncology[95], United [93], Mesoblast [88], OPKO Health[88], Reneo [86], XOMA [83], Anika [83], Agios [83], Shattuck Labs[83]
Best Biotech Stocks Year-to-Date:
Precision [2571.23%], Inovio [1798.04%], Assembly [1535.17%], Adverum nologies[1406.38%], NuCana [1188.03%], Affimed N.V[724%], Corbus [549.67%], Agenus [541.38%], Mesoblast [373.64%], Janux [353.14%], Addex [244.17%] Best Biotech Stocks This Week:
NuCana [1601.65%], Rani [30.93%], Humacyte [28.47%], Vanda [24.03%], ALX Oncology[22.49%], ProKidney [16.57%], Galera [15.36%], ADC [10.93%], Intra-Cellular Therapies[9.85%], VBI Vaccines[9.26%], Day One[8.64%] Best Biotech Stocks Daily:
Rani [15.71%], Genelux [14.25%], Humacyte [14.02%], Emergent Bio[9.68%], Adaptimmune [8.72%], BioXcel [8.63%], Corbus [7.42%], RedHill Biopharma[7.41%], bluebird bio[7.03%], ProQR [6.99%], Agenus [6.84%]