
 Login Sign Up


| |||||
 |  | ||||

| 12Stocks.com Market Intelligence |
Best Biotech Stocks
|
|
| Quick Read: Best Biotech Stocks List By Performances & Trends: Daily, Weekly, Year-to-Date, Market Cap (Size) & Technical Trends | |||
| Best Biotech Stocks Views: Quick Browse View, Summary & Slide Show View | |||
| 12Stocks.com Biotech Stocks Performances & Trends Daily | |||||||||
|
|  The overall market intelligence score is 25 (0-bearish to 100-bullish) which puts Biotech sector in short term bearish to neutral trend. The market intelligence score from previous trading session is 32 and hence a deterioration of trend.
| ||||||||
Here are the market intelligence trend scores of the most requested Biotech stocks at 12Stocks.com (click stock name for detailed review):
|


| 12Stocks.com: Investing in Biotech sector with Stocks | |
|
The following table helps investors and traders sort through current performance and trends (as measured by market intelligence score) of various
stocks in the Biotech sector. Quick View: Move mouse or cursor over stock symbol (ticker) to view short-term Technical chart and over stock name to view long term chart. Click on  to add stock symbol to your watchlist and to add stock symbol to your watchlist and  to view watchlist. Click on any ticker or stock name for detailed market intelligence report for that stock. to view watchlist. Click on any ticker or stock name for detailed market intelligence report for that stock. |
12Stocks.com Performance of Stocks in Biotech Sector
| Ticker | Stock Name | Watchlist | Category | Recent Price | Market Intelligence Score | Change % | YTD Change% |
| GTHX | G1 |   | Biotechnology | 3.99 | 46 | -4.77% | 30.82% |
| CVM | CEL-SCI | | Biotechnology | 1.46 | 20 | -0.68% | -46.32% |
| TRDA | Entrada | | Biotechnology | 12.54 | 35 | -2.34% | -23.58% |
| APLM | Apollomics | | Biotechnology | 0.45 | 20 | -3.23% | -51.05% |
| AVTE | Aerovate | | Biotechnology | 21.27 | 61 | -8.46% | -5.76% |
| PHVS | Pharvaris N.V | | Biotechnology | 21.10 | 35 | -2.76% | -25.51% |
| MESO | Mesoblast | | Biotechnology | 6.22 | 95 | 3.67% | 465.45% |
| PACB | Pacific | | Biotechnology | 1.36 | 10 | -7.48% | -86.14% |
| AURA | Aura | | Biotechnology | 7.12 | 43 | -1.66% | -19.55% |
| VNDA | Vanda | | Biotechnology | 4.56 | 43 | -1.51% | 8.06% |
| OCS | Oculis Holding | | Biotechnology | 12.00 | 52 | 0.17% | 8.10% |
| NAUT | Nautilus nology | | Biotechnology | 2.43 | 20 | -0.82% | -26.14% |
| WVE | Wave Life | | Biotechnology | 5.01 | 58 | -1.38% | -0.79% |
| QTRX | Quanterix | | Biotechnology | 16.04 | 10 | -0.37% | -41.33% |
| SRRK | Scholar Rock | | Biotechnology | 14.09 | 76 | -4.73% | -25.05% |
| ANIK | Anika | | Biotechnology | 25.90 | 83 | 0.43% | 14.30% |
| CGEM | Cullinan Oncology | | Biotechnology | 18.90 | 53 | 13.55% | 85.38% |
| BYSI | BeyondSpring | | Biotechnology | 2.43 | 70 | 6.11% | 170.00% |
| SIGA | SIGA Technologies | | Biotechnology | 8.66 | 68 | -1.14% | 54.64% |
| XBIT | X | | Biotechnology | 8.07 | 76 | -1.34% | 101.75% |
| ERAS | Erasca | | Biotechnology | 1.88 | 61 | -2.59% | -11.74% |
| MRUS | Merus N.V | | Biotechnology | 41.97 | 58 | 2.82% | 52.62% |
| CMPX | Compass | | Biotechnology | 1.49 | 46 | -1.32% | -2.93% |
| ANAB | AnaptysBio | | Biotechnology | 19.27 | 0 | 0.47% | -10.04% |
| DBVT | DBV Technologies | | Biotechnology | 0.69 | 22 | 1.62% | -27.48% |
| To view more stocks, click on Next / Previous arrows or select different range: 0 - 25 , 25 - 50 , 50 - 75 , 75 - 100 , 100 - 125 , 125 - 150 , 150 - 175 , 175 - 200 , 200 - 225 , 225 - 250 , 250 - 275 , 275 - 300 , 300 - 325 , 325 - 350 , 350 - 375 , 375 - 400 | ||
 | Click To Change The Sort Order: By Market Cap or Company Size Performance: Year-to-date, Week and Day |  |
|
Get the most comprehensive stock market coverage daily at 12Stocks.com ➞ Best Stocks Today ➞ Best Stocks Weekly ➞ Best Stocks Year-to-Date ➞ Best Stocks Trends ➞  Best Stocks Today 12Stocks.com Best Nasdaq Stocks ➞ Best S&P 500 Stocks ➞ Best Tech Stocks ➞ Best Biotech Stocks ➞ |
| Detailed Overview of Biotech Stocks |
| Biotech Technical Overview, Leaders & Laggards, Top Biotech ETF Funds & Detailed Biotech Stocks List, Charts, Trends & More |
| Biotech Sector: Technical Analysis, Trends & YTD Performance | |
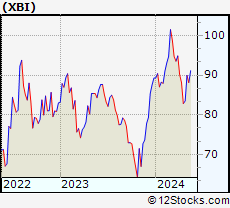
| Biotech sector, as represented by XBI, an exchange-traded fund [ETF] that holds basket of Biotech stocks (e.g, Amgen, Celgene) is down by -5.99% and is currently underperforming the overall market by -11.65% year-to-date. Below is a quick view of Technical charts and trends: | |
 XBI Weekly Chart |
|
| Long Term Trend: Not Good | |
| Medium Term Trend: Not Good | |
 XBI Daily Chart |
|
| Short Term Trend: Very Good | |
| Overall Trend Score: 25 | |
| YTD Performance: -5.99% | |
| **Trend Scores & Views Are Only For Educational Purposes And Not For Investing | |
| 12Stocks.com: Top Performing Biotech Sector Stocks | ||||||||||||||||||||||||||||||||||||||||||||||||
 The top performing Biotech sector stocks year to date are
Now, more recently, over last week, the top performing Biotech sector stocks on the move are


|
||||||||||||||||||||||||||||||||||||||||||||||||
| 12Stocks.com: Investing in Biotech Sector using Exchange Traded Funds | |
|
The following table shows list of key exchange traded funds (ETF) that
help investors track Biotech Index. For detailed view, check out our ETF Funds section of our website. Quick View: Move mouse or cursor over ETF symbol (ticker) to view short-term Technical chart and over ETF name to view long term chart. Click on ticker or stock name for detailed view. Click on to add stock symbol to your watchlist and to view watchlist. |
12Stocks.com List of ETFs that track Biotech Index
| Ticker | ETF Name | Watchlist | Recent Price | Market Intelligence Score | Change % | Week % | Year-to-date % |
| LABD | Biotech Bear 3X | | 10.37 | 75 | 2.98 | -3.98 | 7.02% |
| XBI | Biotech | | 83.94 | 25 | -0.89 | 1.34 | -5.99% |
| LABU | Biotech Bull 3X | | 89.40 | 25 | -2.80 | 3.89 | -26.7% |
| IBB | Biotechnology | | 127.76 | 32 | -0.20 | 2.44 | -5.96% |
| IYH | Healthcare | | 59.09 | 45 | -0.20 | 1.6 | 3.22% |
| IXJ | Global Healthcare | | 89.31 | 45 | -0.35 | 1.78 | 2.99% |
| IHF | Healthcare Providers | | 52.26 | 55 | -0.11 | 0.1 | -0.48% |
| CURE | Healthcare Bull 3X | | 107.85 | 32 | -0.25 | 4.37 | 6.01% |
| FBT | First NYSE | | 145.40 | 25 | 0.05 | 2.62 | -8.01% |
| BIB | Biotechnology | | 50.18 | 32 | -0.30 | 4.11 | -12.04% |
| BIS | Short Biotech | | 20.09 | 61 | 0.75 | -3.85 | 11.18% |
| BBH | Biotech | | 157.33 | 49 | 0.03 | 3.26 | -4.83% |
| PBE | Biotech & Genome | | 60.88 | 32 | -0.43 | 1.72 | -7.53% |
| PTH | DWA Healthcare Momentum | | 39.63 | 46 | -1.34 | 0.25 | 1.25% |
| BTEC | Principal Healthcare Innovators | | 34.20 | 18 | -1.73 | 1.02 | -5.85% |
| BBP | Bio Biotechnology Products | | 52.40 | 20 | 0.02 | 3.91 | -9.8% |
| BBC | Bio Biotechnology Clinical | | 25.63 | 36 | -0.17 | 3.71 | 4.81% |
| 12Stocks.com: Charts, Trends, Fundamental Data and Performances of Biotech Stocks | |
|
We now take in-depth look at all Biotech stocks including charts, multi-period performances and overall trends (as measured by market intelligence score). One can sort Biotech stocks (click link to choose) by Daily, Weekly and by Year-to-Date performances. Also, one can sort by size of the company or by market capitalization. |
| Select Your Default Chart Type: | |||||
| |||||
| Click on stock symbol or name for detailed view. Click on to add stock symbol to your watchlist and to view watchlist. Quick View: Move mouse or cursor over "Daily" to quickly view daily Technical stock chart and over "Weekly" to view weekly Technical stock chart. | |||||

 | GTHX G1 Therapeutics, Inc. |
| Sector: Health Care | |
| SubSector: Biotechnology | |
| MarketCap: 484.085 Millions | |
| Recent Price: 3.99 Market Intelligence Score: 46 | |
| Day Percent Change: -4.77% Day Change: -0.20 | |
| Week Change: -3.16% Year-to-date Change: 30.8% | |
| GTHX Links: Profile News Message Board | |
| Charts:- Daily , Weekly | |
| Add GTHX to Watchlist: View: Get Complete GTHX Trend Analysis ➞ | |
 | CVM CEL-SCI Corporation |
| Sector: Health Care | |
| SubSector: Biotechnology | |
| MarketCap: 483.885 Millions | |
| Recent Price: 1.46 Market Intelligence Score: 20 | |
| Day Percent Change: -0.68% Day Change: -0.01 | |
| Week Change: -6.41% Year-to-date Change: -46.3% | |
| CVM Links: Profile News Message Board | |
| Charts:- Daily , Weekly | |
| Add CVM to Watchlist: View: Get Complete CVM Trend Analysis ➞ | |
 | TRDA Entrada Therapeutics, Inc. |
| Sector: Health Care | |
| SubSector: Biotechnology | |
| MarketCap: 481 Millions | |
| Recent Price: 12.54 Market Intelligence Score: 35 | |
| Day Percent Change: -2.34% Day Change: -0.30 | |
| Week Change: 3.21% Year-to-date Change: -23.6% | |
| TRDA Links: Profile News Message Board | |
| Charts:- Daily , Weekly | |
| Add TRDA to Watchlist: View: Get Complete TRDA Trend Analysis ➞ | |
 | APLM Apollomics, Inc. |
| Sector: Health Care | |
| SubSector: Biotechnology | |
| MarketCap: 481 Millions | |
| Recent Price: 0.45 Market Intelligence Score: 20 | |
| Day Percent Change: -3.23% Day Change: -0.02 | |
| Week Change: -3.64% Year-to-date Change: -51.1% | |
| APLM Links: Profile News Message Board | |
| Charts:- Daily , Weekly | |
| Add APLM to Watchlist: View: Get Complete APLM Trend Analysis ➞ | |
 | AVTE Aerovate Therapeutics, Inc. |
| Sector: Health Care | |
| SubSector: Biotechnology | |
| MarketCap: 478 Millions | |
| Recent Price: 21.27 Market Intelligence Score: 61 | |
| Day Percent Change: -8.46% Day Change: -1.96 | |
| Week Change: -3.54% Year-to-date Change: -5.8% | |
| AVTE Links: Profile News Message Board | |
| Charts:- Daily , Weekly | |
| Add AVTE to Watchlist: View: Get Complete AVTE Trend Analysis ➞ | |
 | PHVS Pharvaris N.V. |
| Sector: Health Care | |
| SubSector: Biotechnology | |
| MarketCap: 475 Millions | |
| Recent Price: 21.10 Market Intelligence Score: 35 | |
| Day Percent Change: -2.76% Day Change: -0.60 | |
| Week Change: 10.13% Year-to-date Change: -25.5% | |
| PHVS Links: Profile News Message Board | |
| Charts:- Daily , Weekly | |
| Add PHVS to Watchlist: View: Get Complete PHVS Trend Analysis ➞ | |
 | MESO Mesoblast Limited |
| Sector: Health Care | |
| SubSector: Biotechnology | |
| MarketCap: 471.385 Millions | |
| Recent Price: 6.22 Market Intelligence Score: 95 | |
| Day Percent Change: 3.67% Day Change: 0.22 | |
| Week Change: 19.39% Year-to-date Change: 465.5% | |
| MESO Links: Profile News Message Board | |
| Charts:- Daily , Weekly | |
| Add MESO to Watchlist: View: Get Complete MESO Trend Analysis ➞ | |
 | PACB Pacific Biosciences of California, Inc. |
| Sector: Health Care | |
| SubSector: Biotechnology | |
| MarketCap: 470.685 Millions | |
| Recent Price: 1.36 Market Intelligence Score: 10 | |
| Day Percent Change: -7.48% Day Change: -0.11 | |
| Week Change: -12.26% Year-to-date Change: -86.1% | |
| PACB Links: Profile News Message Board | |
| Charts:- Daily , Weekly | |
| Add PACB to Watchlist: View: Get Complete PACB Trend Analysis ➞ | |
 | AURA Aura Biosciences, Inc. |
| Sector: Health Care | |
| SubSector: Biotechnology | |
| MarketCap: 469 Millions | |
| Recent Price: 7.12 Market Intelligence Score: 43 | |
| Day Percent Change: -1.66% Day Change: -0.12 | |
| Week Change: -0.97% Year-to-date Change: -19.6% | |
| AURA Links: Profile News Message Board | |
| Charts:- Daily , Weekly | |
| Add AURA to Watchlist: View: Get Complete AURA Trend Analysis ➞ | |
 | VNDA Vanda Pharmaceuticals Inc. |
| Sector: Health Care | |
| SubSector: Biotechnology | |
| MarketCap: 464.585 Millions | |
| Recent Price: 4.56 Market Intelligence Score: 43 | |
| Day Percent Change: -1.51% Day Change: -0.07 | |
| Week Change: -10.76% Year-to-date Change: 8.1% | |
| VNDA Links: Profile News Message Board | |
| Charts:- Daily , Weekly | |
| Add VNDA to Watchlist: View: Get Complete VNDA Trend Analysis ➞ | |
 | OCS Oculis Holding AG |
| Sector: Health Care | |
| SubSector: Biotechnology | |
| MarketCap: 460 Millions | |
| Recent Price: 12.00 Market Intelligence Score: 52 | |
| Day Percent Change: 0.17% Day Change: 0.02 | |
| Week Change: 1.87% Year-to-date Change: 8.1% | |
| OCS Links: Profile News Message Board | |
| Charts:- Daily , Weekly | |
| Add OCS to Watchlist: View: Get Complete OCS Trend Analysis ➞ | |
 | NAUT Nautilus Biotechnology, Inc. |
| Sector: Health Care | |
| SubSector: Biotechnology | |
| MarketCap: 458 Millions | |
| Recent Price: 2.43 Market Intelligence Score: 20 | |
| Day Percent Change: -0.82% Day Change: -0.02 | |
| Week Change: -1.22% Year-to-date Change: -26.1% | |
| NAUT Links: Profile News Message Board | |
| Charts:- Daily , Weekly | |
| Add NAUT to Watchlist: View: Get Complete NAUT Trend Analysis ➞ | |
 | WVE Wave Life Sciences Ltd. |
| Sector: Health Care | |
| SubSector: Biotechnology | |
| MarketCap: 452.785 Millions | |
| Recent Price: 5.01 Market Intelligence Score: 58 | |
| Day Percent Change: -1.38% Day Change: -0.07 | |
| Week Change: 2.87% Year-to-date Change: -0.8% | |
| WVE Links: Profile News Message Board | |
| Charts:- Daily , Weekly | |
| Add WVE to Watchlist: View: Get Complete WVE Trend Analysis ➞ | |
 | QTRX Quanterix Corporation |
| Sector: Health Care | |
| SubSector: Biotechnology | |
| MarketCap: 448.685 Millions | |
| Recent Price: 16.04 Market Intelligence Score: 10 | |
| Day Percent Change: -0.37% Day Change: -0.06 | |
| Week Change: 1.26% Year-to-date Change: -41.3% | |
| QTRX Links: Profile News Message Board | |
| Charts:- Daily , Weekly | |
| Add QTRX to Watchlist: View: Get Complete QTRX Trend Analysis ➞ | |
 | SRRK Scholar Rock Holding Corporation |
| Sector: Health Care | |
| SubSector: Biotechnology | |
| MarketCap: 441.385 Millions | |
| Recent Price: 14.09 Market Intelligence Score: 76 | |
| Day Percent Change: -4.73% Day Change: -0.70 | |
| Week Change: 1.73% Year-to-date Change: -25.1% | |
| SRRK Links: Profile News Message Board | |
| Charts:- Daily , Weekly | |
| Add SRRK to Watchlist: View: Get Complete SRRK Trend Analysis ➞ | |
 | ANIK Anika Therapeutics, Inc. |
| Sector: Health Care | |
| SubSector: Biotechnology | |
| MarketCap: 438.385 Millions | |
| Recent Price: 25.90 Market Intelligence Score: 83 | |
| Day Percent Change: 0.43% Day Change: 0.11 | |
| Week Change: 0.23% Year-to-date Change: 14.3% | |
| ANIK Links: Profile News Message Board | |
| Charts:- Daily , Weekly | |
| Add ANIK to Watchlist: View: Get Complete ANIK Trend Analysis ➞ | |
 | CGEM Cullinan Oncology, Inc. |
| Sector: Health Care | |
| SubSector: Biotechnology | |
| MarketCap: 433 Millions | |
| Recent Price: 18.90 Market Intelligence Score: 53 | |
| Day Percent Change: 13.55% Day Change: 2.25 | |
| Week Change: 20.69% Year-to-date Change: 85.4% | |
| CGEM Links: Profile News Message Board | |
| Charts:- Daily , Weekly | |
| Add CGEM to Watchlist: View: Get Complete CGEM Trend Analysis ➞ | |
 | BYSI BeyondSpring Inc. |
| Sector: Health Care | |
| SubSector: Biotechnology | |
| MarketCap: 432.785 Millions | |
| Recent Price: 2.43 Market Intelligence Score: 70 | |
| Day Percent Change: 6.11% Day Change: 0.14 | |
| Week Change: 35% Year-to-date Change: 170.0% | |
| BYSI Links: Profile News Message Board | |
| Charts:- Daily , Weekly | |
| Add BYSI to Watchlist: View: Get Complete BYSI Trend Analysis ➞ | |
 | SIGA SIGA Technologies, Inc. |
| Sector: Health Care | |
| SubSector: Biotechnology | |
| MarketCap: 424.285 Millions | |
| Recent Price: 8.66 Market Intelligence Score: 68 | |
| Day Percent Change: -1.14% Day Change: -0.10 | |
| Week Change: 3.84% Year-to-date Change: 54.6% | |
| SIGA Links: Profile News Message Board | |
| Charts:- Daily , Weekly | |
| Add SIGA to Watchlist: View: Get Complete SIGA Trend Analysis ➞ | |
 | XBIT XBiotech Inc. |
| Sector: Health Care | |
| SubSector: Biotechnology | |
| MarketCap: 420.385 Millions | |
| Recent Price: 8.07 Market Intelligence Score: 76 | |
| Day Percent Change: -1.34% Day Change: -0.11 | |
| Week Change: 0.37% Year-to-date Change: 101.8% | |
| XBIT Links: Profile News Message Board | |
| Charts:- Daily , Weekly | |
| Add XBIT to Watchlist: View: Get Complete XBIT Trend Analysis ➞ | |
 | ERAS Erasca, Inc. |
| Sector: Health Care | |
| SubSector: Biotechnology | |
| MarketCap: 419 Millions | |
| Recent Price: 1.88 Market Intelligence Score: 61 | |
| Day Percent Change: -2.59% Day Change: -0.05 | |
| Week Change: 5.03% Year-to-date Change: -11.7% | |
| ERAS Links: Profile News Message Board | |
| Charts:- Daily , Weekly | |
| Add ERAS to Watchlist: View: Get Complete ERAS Trend Analysis ➞ | |
 | MRUS Merus N.V. |
| Sector: Health Care | |
| SubSector: Biotechnology | |
| MarketCap: 417.385 Millions | |
| Recent Price: 41.97 Market Intelligence Score: 58 | |
| Day Percent Change: 2.82% Day Change: 1.15 | |
| Week Change: 5.43% Year-to-date Change: 52.6% | |
| MRUS Links: Profile News Message Board | |
| Charts:- Daily , Weekly | |
| Add MRUS to Watchlist: View: Get Complete MRUS Trend Analysis ➞ | |
 | CMPX Compass Therapeutics, Inc. |
| Sector: Health Care | |
| SubSector: Biotechnology | |
| MarketCap: 406 Millions | |
| Recent Price: 1.49 Market Intelligence Score: 46 | |
| Day Percent Change: -1.32% Day Change: -0.02 | |
| Week Change: 1.36% Year-to-date Change: -2.9% | |
| CMPX Links: Profile News Message Board | |
| Charts:- Daily , Weekly | |
| Add CMPX to Watchlist: View: Get Complete CMPX Trend Analysis ➞ | |
 | ANAB AnaptysBio, Inc. |
| Sector: Health Care | |
| SubSector: Biotechnology | |
| MarketCap: 405.985 Millions | |
| Recent Price: 19.27 Market Intelligence Score: 0 | |
| Day Percent Change: 0.47% Day Change: 0.09 | |
| Week Change: -3.02% Year-to-date Change: -10.0% | |
| ANAB Links: Profile News Message Board | |
| Charts:- Daily , Weekly | |
| Add ANAB to Watchlist: View: Get Complete ANAB Trend Analysis ➞ | |
 | DBVT DBV Technologies S.A. |
| Sector: Health Care | |
| SubSector: Biotechnology | |
| MarketCap: 405.885 Millions | |
| Recent Price: 0.69 Market Intelligence Score: 22 | |
| Day Percent Change: 1.62% Day Change: 0.01 | |
| Week Change: 1.36% Year-to-date Change: -27.5% | |
| DBVT Links: Profile News Message Board | |
| Charts:- Daily , Weekly | |
| Add DBVT to Watchlist: View: Get Complete DBVT Trend Analysis ➞ | |
| To view more stocks, click on Next / Previous arrows or select different range: 0 - 25 , 25 - 50 , 50 - 75 , 75 - 100 , 100 - 125 , 125 - 150 , 150 - 175 , 175 - 200 , 200 - 225 , 225 - 250 , 250 - 275 , 275 - 300 , 300 - 325 , 325 - 350 , 350 - 375 , 375 - 400 | ||
| Click To Change The Sort Order: By Market Cap or Company Size Performance: Year-to-date, Week and Day | |
| Select Chart Type: | ||
|
Best Stocks Today 12Stocks.com |
© 2024 12Stocks.com Terms & Conditions Privacy Contact Us
All Information Provided Only For Education And Not To Be Used For Investing or Trading. See Terms & Conditions


One More Thing ... Get Best Stocks Delivered Daily!
Never Ever Miss A Move With Our Top Ten Stocks Lists
Find Best Stocks In Any Market - Bull or Bear Market
Take A Peek At Our Top Ten Stocks Lists: Daily, Weekly, Year-to-Date & Top Trends
Find Best Stocks In Any Market - Bull or Bear Market
Take A Peek At Our Top Ten Stocks Lists: Daily, Weekly, Year-to-Date & Top Trends
Biotech Stocks With Best Up Trends [0-bearish to 100-bullish]: Annovis Bio[100], PureTech Health[100], Agios [100], Pieris [100], Avadel [100], Agenus [95], Mesoblast [95], AlloVir [95], Day One[93], Exelixis [90], Avidity [90]
Best Biotech Stocks Year-to-Date:
Pieris [6427.47%], Precision [2590.41%], Inovio [1892.16%], Assembly [1543.7%], Adverum nologies[1253.61%], NuCana [1198.17%], Agenus [796.24%], Affimed N.V[680.8%], Corbus [488.41%], Mesoblast [465.45%], Janux [352.07%] Best Biotech Stocks This Week:
Pieris [8093.1%], Agenus [39.74%], BeyondSpring [35%], Seres [30.29%], Annovis Bio[27.4%], ProKidney [23.28%], Cullinan Oncology[20.69%], Mesoblast [19.39%], Molecular Partners[16.87%], HOOKIPA Pharma[16.17%], Longboard [13.3%] Best Biotech Stocks Daily:
Agenus [14.86%], Cullinan Oncology[13.55%], HOOKIPA Pharma[11.11%], Gritstone Oncology[10.06%], Sage [8.11%], Relay [7.46%], Annovis Bio[7.24%], BeyondSpring [6.11%], Sarepta [6.09%], Molecular Templates[5.81%], Vigil Neuroscience[5.66%]