
 Login Sign Up


| |||||
 |  | ||||

| 12Stocks.com Market Intelligence |
Best Biotech Stocks
|
|
| Quick Read: Best Biotech Stocks List By Performances & Trends: Daily, Weekly, Year-to-Date, Market Cap (Size) & Technical Trends | |||
| Best Biotech Stocks Views: Quick Browse View, Summary & Slide Show View | |||
| 12Stocks.com Biotech Stocks Performances & Trends Daily | |||||||||
|
|  The overall market intelligence score is 100 (0-bearish to 100-bullish) which puts Biotech sector in short term bullish trend. The market intelligence score from previous trading session is 90 and an improvement of trend continues.
| ||||||||
Here are the market intelligence trend scores of the most requested Biotech stocks at 12Stocks.com (click stock name for detailed review):
|


| 12Stocks.com: Investing in Biotech sector with Stocks | |
|
The following table helps investors and traders sort through current performance and trends (as measured by market intelligence score) of various
stocks in the Biotech sector. Quick View: Move mouse or cursor over stock symbol (ticker) to view short-term Technical chart and over stock name to view long term chart. Click on  to add stock symbol to your watchlist and to add stock symbol to your watchlist and  to view watchlist. Click on any ticker or stock name for detailed market intelligence report for that stock. to view watchlist. Click on any ticker or stock name for detailed market intelligence report for that stock. |
12Stocks.com Performance of Stocks in Biotech Sector
| Ticker | Stock Name | Watchlist | Category | Recent Price | Market Intelligence Score | Change % | YTD Change% |
| TBPH | Theravance Biopharma |   | Biotechnology | 14.06 | 40 | -2.50% | 51.51% |
| ORTX | Orchard | | Biotechnology | 16.70 | 70 | 0.00% | 0.00% |
| ODT | Odonate | | Biotechnology | 12900.00 | 10 | 0.00% | 0.00% |
| FREQ | Frequency | | Biotechnology | 14.98 | 80 | 5.94% | 0.00% |
| TYRA | Tyra | | Biotechnology | 13.38 | 40 | -0.34% | -7.31% |
| GOSS | Gossamer Bio | | Biotechnology | 2.48 | 20 | -0.40% | 155.67% |
| PRME | Prime Medicine | | Biotechnology | 6.67 | 100 | 19.41% | 123.24% |
| VSTM | Verastem | | Biotechnology | 8.99 | 70 | 2.16% | 38.52% |
| PROK | ProKidney Corp | | Biotechnology | 2.78 | 80 | 6.92% | 60.69% |
| PTLA | Portola | | Biotechnology | 172.95 | 100 | 0.65% | 0.00% |
| DNA | Ginkgo Bioworks | | Biotechnology | 15.97 | 100 | 8.86% | 56.26% |
| SVRA | Savara | | Biotechnology | 3.48 | 40 | -1.55% | 13.52% |
| MRVI | Maravai Life | | Biotechnology | 2.96 | 90 | -5.57% | -45.99% |
| KROS | Keros | | Biotechnology | 15.60 | 30 | 2.09% | -2.01% |
| TERN | Terns | | Biotechnology | 8.03 | 70 | 2.82% | 41.62% |
| ATNX | Athenex | | Biotechnology | 0.01 | 50 | 103.33% | 0.00% |
| AVRO | AVROBIO | | Biotechnology | 1.40 | 10 | -1.41% | 0.00% |
| MGTX | MeiraGTx | | Biotechnology | 8.39 | 80 | 1.45% | 33.81% |
| BLU | BELLUS Health | | Biotechnology | 14.74 | 30 | 0.00% | 0.00% |
| ZIOP | ZIOPHARM Oncology | | Biotechnology | 31.11 | 70 | -2.63% | 0.00% |
| ANAB | AnaptysBio | | Biotechnology | 31.33 | 100 | -2.00% | 134.51% |
| XNCR | Xencor | | Biotechnology | 11.83 | 90 | 0.00% | -50.27% |
| KERX | Keryx Bio | | Biotechnology | 14.32 | 70 | 0.28% | 0.00% |
| CARA | Cara | | Biotechnology | 18.25 | 100 | 14.34% | 13.49% |
| CMPX | Compass | | Biotechnology | 3.47 | 30 | 3.27% | 147.86% |
| To view more stocks, click on Next / Previous arrows or select different range: 0 - 25 , 25 - 50 , 50 - 75 , 75 - 100 , 100 - 125 , 125 - 150 , 150 - 175 , 175 - 200 , 200 - 225 , 225 - 250 , 250 - 275 , 275 - 300 , 300 - 325 , 325 - 350 , 350 - 375 , 375 - 400 , 400 - 425 , 425 - 450 , 450 - 475 | ||
 | Click To Change The Sort Order: By Market Cap or Company Size Performance: Year-to-date, Week and Day |  |
|
Get the most comprehensive stock market coverage daily at 12Stocks.com ➞ Best Stocks Today ➞ Best Stocks Weekly ➞ Best Stocks Year-to-Date ➞ Best Stocks Trends ➞  Best Stocks Today 12Stocks.com Best Nasdaq Stocks ➞ Best S&P 500 Stocks ➞ Best Tech Stocks ➞ Best Biotech Stocks ➞ |
| Detailed Overview of Biotech Stocks |
| Biotech Technical Overview, Leaders & Laggards, Top Biotech ETF Funds & Detailed Biotech Stocks List, Charts, Trends & More |
| Biotech Sector: Technical Analysis, Trends & YTD Performance | |
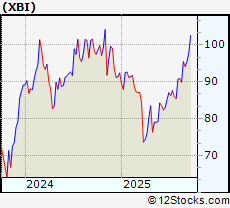
| Biotech sector, as represented by XBI, an exchange-traded fund [ETF] that holds basket of Biotech stocks (e.g, Amgen, Celgene) is up by 12.1001% and is currently underperforming the overall market by -2.6578% year-to-date. Below is a quick view of Technical charts and trends: | |
 XBI Weekly Chart |
|
| Long Term Trend: Very Good | |
| Medium Term Trend: Very Good | |
 XBI Daily Chart |
|
| Short Term Trend: Very Good | |
| Overall Trend Score: 100 | |
| YTD Performance: 12.1001% | |
| **Trend Scores & Views Are Only For Educational Purposes And Not For Investing | |
| 12Stocks.com: Top Performing Biotech Sector Stocks | ||||||||||||||||||||||||||||||||||||||||||||||
 The top performing Biotech sector stocks year to date are
Now, more recently, over last week, the top performing Biotech sector stocks on the move are


|
||||||||||||||||||||||||||||||||||||||||||||||
| 12Stocks.com: Investing in Biotech Sector using Exchange Traded Funds | |
|
The following table shows list of key exchange traded funds (ETF) that
help investors track Biotech Index. For detailed view, check out our ETF Funds section of our website. Quick View: Move mouse or cursor over ETF symbol (ticker) to view short-term Technical chart and over ETF name to view long term chart. Click on ticker or stock name for detailed view. Click on to add stock symbol to your watchlist and to view watchlist. |
12Stocks.com List of ETFs that track Biotech Index
| Ticker | ETF Name | Watchlist | Recent Price | Market Intelligence Score | Change % | Week % | Year-to-date % |
| UBIO | Biotechnology | | 73.34 | 80 | -0.0681292 | 260.748 | 0% |
| HCRF | Edge Multifactor | | 67.14 | 23 | 0 | 9999 | NA |
| SICK | Healthcare Bear 3X | | 37.90 | 36 | 0 | 9999 | NA |
| LABS | Biotech Bear 1X | | 24.18 | 56 | 0 | 9999 | NA |
| BTEC | Principal Healthcare Innovators | | 39.49 | 30 | 0 | 1.02328 | 0% |
| 12Stocks.com: Charts, Trends, Fundamental Data and Performances of Biotech Stocks | |
|
We now take in-depth look at all Biotech stocks including charts, multi-period performances and overall trends (as measured by market intelligence score). One can sort Biotech stocks (click link to choose) by Daily, Weekly and by Year-to-Date performances. Also, one can sort by size of the company or by market capitalization. |
| Select Your Default Chart Type: | |||||
| |||||
| Click on stock symbol or name for detailed view. Click on to add stock symbol to your watchlist and to view watchlist. Quick View: Move mouse or cursor over "Daily" to quickly view daily Technical stock chart and over "Weekly" to view weekly Technical stock chart. | |||||

 | TBPH Theravance Biopharma Inc |
| Sector: Health Care | |
| SubSector: Biotechnology | |
| MarketCap: 702.54 Millions | |
| Recent Price: 14.06 Market Intelligence Score: 40 | |
| Day Percent Change: -2.49653% Day Change: 0.27 | |
| Week Change: 0.0711744% Year-to-date Change: 51.5% | |
| TBPH Links: Profile News Message Board | |
| Charts:- Daily , Weekly | |
| Add TBPH to Watchlist: View: Get Complete TBPH Trend Analysis ➞ | |
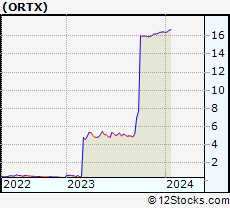 | ORTX Orchard Therapeutics plc |
| Sector: Health Care | |
| SubSector: Biotechnology | |
| MarketCap: 684.585 Millions | |
| Recent Price: 16.70 Market Intelligence Score: 70 | |
| Day Percent Change: 0% Day Change: -9999 | |
| Week Change: 0.906344% Year-to-date Change: 0.0% | |
| ORTX Links: Profile News Message Board | |
| Charts:- Daily , Weekly | |
| Add ORTX to Watchlist: View: Get Complete ORTX Trend Analysis ➞ | |
 | ODT Odonate Therapeutics, Inc. |
| Sector: Health Care | |
| SubSector: Biotechnology | |
| MarketCap: 684.485 Millions | |
| Recent Price: 12900.00 Market Intelligence Score: 10 | |
| Day Percent Change: 0% Day Change: -9999 | |
| Week Change: -5.14706% Year-to-date Change: 0.0% | |
| ODT Links: Profile News Message Board | |
| Charts:- Daily , Weekly | |
| Add ODT to Watchlist: View: Get Complete ODT Trend Analysis ➞ | |
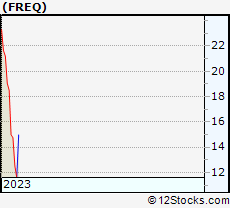 | FREQ Frequency Therapeutics, Inc. |
| Sector: Health Care | |
| SubSector: Biotechnology | |
| MarketCap: 676.085 Millions | |
| Recent Price: 14.98 Market Intelligence Score: 80 | |
| Day Percent Change: 5.94059% Day Change: -9999 | |
| Week Change: 26.6272% Year-to-date Change: 0.0% | |
| FREQ Links: Profile News Message Board | |
| Charts:- Daily , Weekly | |
| Add FREQ to Watchlist: View: Get Complete FREQ Trend Analysis ➞ | |
 | TYRA Tyra Biosciences Inc |
| Sector: Health Care | |
| SubSector: Biotechnology | |
| MarketCap: 674.21 Millions | |
| Recent Price: 13.38 Market Intelligence Score: 40 | |
| Day Percent Change: -0.33532% Day Change: 1.46 | |
| Week Change: 4.81975% Year-to-date Change: -7.3% | |
| TYRA Links: Profile News Message Board | |
| Charts:- Daily , Weekly | |
| Add TYRA to Watchlist: View: Get Complete TYRA Trend Analysis ➞ | |
 | GOSS Gossamer Bio Inc |
| Sector: Health Care | |
| SubSector: Biotechnology | |
| MarketCap: 668.5 Millions | |
| Recent Price: 2.48 Market Intelligence Score: 20 | |
| Day Percent Change: -0.401606% Day Change: 0.22 | |
| Week Change: -17.0569% Year-to-date Change: 155.7% | |
| GOSS Links: Profile News Message Board | |
| Charts:- Daily , Weekly | |
| Add GOSS to Watchlist: View: Get Complete GOSS Trend Analysis ➞ | |
 | PRME Prime Medicine Inc |
| Sector: Health Care | |
| SubSector: Biotechnology | |
| MarketCap: 662.89 Millions | |
| Recent Price: 6.67 Market Intelligence Score: 100 | |
| Day Percent Change: 19.4097% Day Change: -0.02 | |
| Week Change: 20.054% Year-to-date Change: 123.2% | |
| PRME Links: Profile News Message Board | |
| Charts:- Daily , Weekly | |
| Add PRME to Watchlist: View: Get Complete PRME Trend Analysis ➞ | |
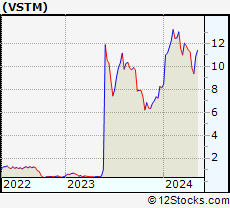 | VSTM Verastem Inc |
| Sector: Health Care | |
| SubSector: Biotechnology | |
| MarketCap: 662.84 Millions | |
| Recent Price: 8.99 Market Intelligence Score: 70 | |
| Day Percent Change: 2.15909% Day Change: 0.31 | |
| Week Change: 4.41347% Year-to-date Change: 38.5% | |
| VSTM Links: Profile News Message Board | |
| Charts:- Daily , Weekly | |
| Add VSTM to Watchlist: View: Get Complete VSTM Trend Analysis ➞ | |
 | PROK ProKidney Corp |
| Sector: Health Care | |
| SubSector: Biotechnology | |
| MarketCap: 662.14 Millions | |
| Recent Price: 2.78 Market Intelligence Score: 80 | |
| Day Percent Change: 6.92308% Day Change: 0.04 | |
| Week Change: 2.20588% Year-to-date Change: 60.7% | |
| PROK Links: Profile News Message Board | |
| Charts:- Daily , Weekly | |
| Add PROK to Watchlist: View: Get Complete PROK Trend Analysis ➞ | |
 | PTLA Portola Pharmaceuticals, Inc. |
| Sector: Health Care | |
| SubSector: Biotechnology | |
| MarketCap: 660.185 Millions | |
| Recent Price: 172.95 Market Intelligence Score: 100 | |
| Day Percent Change: 0.651807% Day Change: -9999 | |
| Week Change: 4717.55% Year-to-date Change: 0.0% | |
| PTLA Links: Profile News Message Board | |
| Charts:- Daily , Weekly | |
| Add PTLA to Watchlist: View: Get Complete PTLA Trend Analysis ➞ | |
 | DNA Ginkgo Bioworks Holdings Inc |
| Sector: Health Care | |
| SubSector: Biotechnology | |
| MarketCap: 660.08 Millions | |
| Recent Price: 15.97 Market Intelligence Score: 100 | |
| Day Percent Change: 8.86162% Day Change: 1.1 | |
| Week Change: 38.5082% Year-to-date Change: 56.3% | |
| DNA Links: Profile News Message Board | |
| Charts:- Daily , Weekly | |
| Add DNA to Watchlist: View: Get Complete DNA Trend Analysis ➞ | |
 | SVRA Savara Inc |
| Sector: Health Care | |
| SubSector: Biotechnology | |
| MarketCap: 642.95 Millions | |
| Recent Price: 3.48 Market Intelligence Score: 40 | |
| Day Percent Change: -1.55367% Day Change: -0.04 | |
| Week Change: -0.712251% Year-to-date Change: 13.5% | |
| SVRA Links: Profile News Message Board | |
| Charts:- Daily , Weekly | |
| Add SVRA to Watchlist: View: Get Complete SVRA Trend Analysis ➞ | |
 | MRVI Maravai LifeSciences Holdings Inc |
| Sector: Health Care | |
| SubSector: Biotechnology | |
| MarketCap: 640.96 Millions | |
| Recent Price: 2.96 Market Intelligence Score: 90 | |
| Day Percent Change: -5.57325% Day Change: -0.06 | |
| Week Change: 9.00735% Year-to-date Change: -46.0% | |
| MRVI Links: Profile News Message Board | |
| Charts:- Daily , Weekly | |
| Add MRVI to Watchlist: View: Get Complete MRVI Trend Analysis ➞ | |
 | KROS Keros Therapeutics Inc |
| Sector: Health Care | |
| SubSector: Biotechnology | |
| MarketCap: 633.19 Millions | |
| Recent Price: 15.60 Market Intelligence Score: 30 | |
| Day Percent Change: 2.09424% Day Change: 0.94 | |
| Week Change: -0.952381% Year-to-date Change: -2.0% | |
| KROS Links: Profile News Message Board | |
| Charts:- Daily , Weekly | |
| Add KROS to Watchlist: View: Get Complete KROS Trend Analysis ➞ | |
 | TERN Terns Pharmaceuticals Inc |
| Sector: Health Care | |
| SubSector: Biotechnology | |
| MarketCap: 631.83 Millions | |
| Recent Price: 8.03 Market Intelligence Score: 70 | |
| Day Percent Change: 2.8169% Day Change: 0.46 | |
| Week Change: 2.03304% Year-to-date Change: 41.6% | |
| TERN Links: Profile News Message Board | |
| Charts:- Daily , Weekly | |
| Add TERN to Watchlist: View: Get Complete TERN Trend Analysis ➞ | |
 | ATNX Athenex, Inc. |
| Sector: Health Care | |
| SubSector: Biotechnology | |
| MarketCap: 631.785 Millions | |
| Recent Price: 0.01 Market Intelligence Score: 50 | |
| Day Percent Change: 103.333% Day Change: -9999 | |
| Week Change: -95.6429% Year-to-date Change: 0.0% | |
| ATNX Links: Profile News Message Board | |
| Charts:- Daily , Weekly | |
| Add ATNX to Watchlist: View: Get Complete ATNX Trend Analysis ➞ | |
 | AVRO AVROBIO, Inc. |
| Sector: Health Care | |
| SubSector: Biotechnology | |
| MarketCap: 626.185 Millions | |
| Recent Price: 1.40 Market Intelligence Score: 10 | |
| Day Percent Change: -1.40845% Day Change: -9999 | |
| Week Change: -6.04027% Year-to-date Change: 0.0% | |
| AVRO Links: Profile News Message Board | |
| Charts:- Daily , Weekly | |
| Add AVRO to Watchlist: View: Get Complete AVRO Trend Analysis ➞ | |
 | MGTX MeiraGTx Holdings plc |
| Sector: Health Care | |
| SubSector: Biotechnology | |
| MarketCap: 618.64 Millions | |
| Recent Price: 8.39 Market Intelligence Score: 80 | |
| Day Percent Change: 1.45103% Day Change: 0.29 | |
| Week Change: 1.20627% Year-to-date Change: 33.8% | |
| MGTX Links: Profile News Message Board | |
| Charts:- Daily , Weekly | |
| Add MGTX to Watchlist: View: Get Complete MGTX Trend Analysis ➞ | |
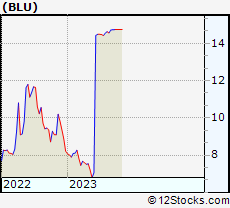 | BLU BELLUS Health Inc. |
| Sector: Health Care | |
| SubSector: Biotechnology | |
| MarketCap: 614.985 Millions | |
| Recent Price: 14.74 Market Intelligence Score: 30 | |
| Day Percent Change: 0% Day Change: -9999 | |
| Week Change: 0% Year-to-date Change: 0.0% | |
| BLU Links: Profile News Message Board | |
| Charts:- Daily , Weekly | |
| Add BLU to Watchlist: View: Get Complete BLU Trend Analysis ➞ | |
 | ZIOP ZIOPHARM Oncology, Inc. |
| Sector: Health Care | |
| SubSector: Biotechnology | |
| MarketCap: 614.785 Millions | |
| Recent Price: 31.11 Market Intelligence Score: 70 | |
| Day Percent Change: -2.62911% Day Change: -9999 | |
| Week Change: 137.463% Year-to-date Change: 0.0% | |
| ZIOP Links: Profile News Message Board | |
| Charts:- Daily , Weekly | |
| Add ZIOP to Watchlist: View: Get Complete ZIOP Trend Analysis ➞ | |
 | ANAB AnaptysBio Inc |
| Sector: Health Care | |
| SubSector: Biotechnology | |
| MarketCap: 613.13 Millions | |
| Recent Price: 31.33 Market Intelligence Score: 100 | |
| Day Percent Change: -2.00188% Day Change: 0.21 | |
| Week Change: 41.5086% Year-to-date Change: 134.5% | |
| ANAB Links: Profile News Message Board | |
| Charts:- Daily , Weekly | |
| Add ANAB to Watchlist: View: Get Complete ANAB Trend Analysis ➞ | |
 | XNCR Xencor Inc |
| Sector: Health Care | |
| SubSector: Biotechnology | |
| MarketCap: 609.81 Millions | |
| Recent Price: 11.83 Market Intelligence Score: 90 | |
| Day Percent Change: 0% Day Change: -0.07 | |
| Week Change: 12.7741% Year-to-date Change: -50.3% | |
| XNCR Links: Profile News Message Board | |
| Charts:- Daily , Weekly | |
| Add XNCR to Watchlist: View: Get Complete XNCR Trend Analysis ➞ | |
 | KERX Keryx Biopharmaceuticals, Inc. |
| Sector: Health Care | |
| SubSector: Biotechnology | |
| MarketCap: 606.8 Millions | |
| Recent Price: 14.32 Market Intelligence Score: 70 | |
| Day Percent Change: 0.280112% Day Change: -9999 | |
| Week Change: 2.28571% Year-to-date Change: 0.0% | |
| KERX Links: Profile News Message Board | |
| Charts:- Daily , Weekly | |
| Add KERX to Watchlist: View: Get Complete KERX Trend Analysis ➞ | |
 | CARA Cara Therapeutics, Inc. |
| Sector: Health Care | |
| SubSector: Biotechnology | |
| MarketCap: 597.985 Millions | |
| Recent Price: 18.25 Market Intelligence Score: 100 | |
| Day Percent Change: 14.3396% Day Change: -9999 | |
| Week Change: 25.4199% Year-to-date Change: 13.5% | |
| CARA Links: Profile News Message Board | |
| Charts:- Daily , Weekly | |
| Add CARA to Watchlist: View: Get Complete CARA Trend Analysis ➞ | |
 | CMPX Compass Therapeutics Inc |
| Sector: Health Care | |
| SubSector: Biotechnology | |
| MarketCap: 590.21 Millions | |
| Recent Price: 3.47 Market Intelligence Score: 30 | |
| Day Percent Change: 3.27381% Day Change: 0.02 | |
| Week Change: -0.573066% Year-to-date Change: 147.9% | |
| CMPX Links: Profile News Message Board | |
| Charts:- Daily , Weekly | |
| Add CMPX to Watchlist: View: Get Complete CMPX Trend Analysis ➞ | |
| To view more stocks, click on Next / Previous arrows or select different range: 0 - 25 , 25 - 50 , 50 - 75 , 75 - 100 , 100 - 125 , 125 - 150 , 150 - 175 , 175 - 200 , 200 - 225 , 225 - 250 , 250 - 275 , 275 - 300 , 300 - 325 , 325 - 350 , 350 - 375 , 375 - 400 , 400 - 425 , 425 - 450 , 450 - 475 | ||
| Click To Change The Sort Order: By Market Cap or Company Size Performance: Year-to-date, Week and Day | |
| Select Chart Type: | ||
|
Best Stocks Today 12Stocks.com |
© 2025 12Stocks.com Terms & Conditions Privacy Contact Us
All Information Provided Only For Education And Not To Be Used For Investing or Trading. See Terms & Conditions


One More Thing ... Get Best Stocks Delivered Daily!
Never Ever Miss A Move With Our Top Ten Stocks Lists
Find Best Stocks In Any Market - Bull or Bear Market
Take A Peek At Our Top Ten Stocks Lists: Daily, Weekly, Year-to-Date & Top Trends
Find Best Stocks In Any Market - Bull or Bear Market
Take A Peek At Our Top Ten Stocks Lists: Daily, Weekly, Year-to-Date & Top Trends
Biotech Stocks With Best Up Trends [0-bearish to 100-bullish]: Taysha Gene[100], DBV Technologies[100], Valneva SE[100], Prime Medicine[100], AlloVir [100], Sarepta [100], Monopar [100], Cara [100], Absci Corp[100], Spruce [100], Cabaletta Bio[100]
Best Biotech Stocks Year-to-Date:
Kaleido [9900%], Vor Biopharma[3175%], Nanobiotix ADR[581.379%], I-Mab ADR[357.506%], Monopar [337.489%], Nektar [319.84%], DBV Technologies[276.923%], Celcuity [276.39%], Galectin [263.248%], Cidara [260.806%], Lineage Cell[233.981%] Best Biotech Stocks This Week:
Athersys [193287%], VBI Vaccines[86898.5%], ContraFect [47677.8%], Clovis Oncology[39610.5%], NanoString Technologies[17224.7%], Neptune Wellness[14100%], Achillion [10033.3%], Kaleido [9900%], Nymox [8258.49%], Epizyme [5739.46%], Portola [4717.55%] Best Biotech Stocks Daily:
Kaleido [9900%], Neoleukin [332.665%], Syros [226.23%], Athenex [103.333%], Taysha Gene[53.4591%], DBV Technologies[21.6485%], Valneva SE[20.197%], Prime Medicine[19.4097%], Aptose [17.5439%], AlloVir [16.9215%], Sarepta [15.6832%]