
 Login Sign Up


| |||||
 |  | ||||

| 12Stocks.com Market Intelligence |
Best Asia Stocks
|
|
| Quick Read: Top Asia Stocks By Performances & Trends: Daily, Weekly, Year-to-Date, Market Cap (Size) & Technical Trends | |||
| Best Asia Views: Quick Browse View, Summary & Slide Show | |||
| 12Stocks.com Asia Stocks Performances & Trends Daily | |||||||||
|
|  The overall market intelligence score is 31 (0-bearish to 100-bullish) which puts Asia index in short term bearish to neutral trend. The market intelligence score from previous trading session is 58 and hence a deterioration of trend.
| ||||||||
Here are the market intelligence trend scores of the most requested Asia stocks at 12Stocks.com (click stock name for detailed review):
|


| Consider signing up for our daily 12Stocks.com "Best Stocks Newsletter". You will never ever miss a big stock move again! |
| 12Stocks.com: Top Performing Asia Index Stocks | ||||||||||||||||||||||||||||||||||||||||||||||||
 The top performing Asia Index stocks year to date are
Now, more recently, over last week, the top performing Asia Index stocks on the move are


|
||||||||||||||||||||||||||||||||||||||||||||||||
| 12Stocks.com: Investing in Asia Index with Stocks | |
|
The following table helps investors and traders sort through current performance and trends (as measured by market intelligence score) of various
stocks in the Asia Index. Quick View: Move mouse or cursor over stock symbol (ticker) to view short-term technical chart and over stock name to view long term chart. Click on  to add stock symbol to your watchlist and to add stock symbol to your watchlist and  to view watchlist. Click on any ticker or stock name for detailed market intelligence report for that stock. to view watchlist. Click on any ticker or stock name for detailed market intelligence report for that stock. |
12Stocks.com Performance of Stocks in Asia Index
| Ticker | Stock Name | Watchlist | Category | Recent Price | Market Intelligence Score | Change % | YTD Change% |
| CWS | AdvisorShares Focused |   | Utilities | 60.91 | 36 | -0.15 | 2.68% |
| INFY | Infosys | | Technology | 17.01 | 35 | -0.18 | -7.45% |
| IMOS | ChipMOS | | Technology | 28.34 | 56 | -0.21 | 4.15% |
| SPI | SPI Energy | | Technology | 0.54 | 30 | -0.22 | -31.83% |
| SOHU | Sohu.com | | Technology | 11.20 | 68 | -0.27 | 12.79% |
| IMAB | I Mab | | Health Care | 1.80 | 41 | -0.28 | -5.00% |
| CGA | China Green | | Materials | 2.99 | 68 | -0.33 | -1.32% |
| SMI | Semiconductor | | Technology | 45.59 | 43 | -0.34 | -1.85% |
| JKS | JinkoSolar Holding | | Technology | 23.09 | 52 | -0.35 | -37.49% |
| XIN | Xinyuan Real | | Financials | 2.72 | 49 | -0.37 | 0.00% |
| HOLI | Hollysys Automation | | Industrials | 24.43 | 18 | -0.37 | -7.29% |
| TCOM | Trip.com | | Services & Goods | 50.41 | 73 | -0.37 | 40.00% |
| PERF | Perfect | | Technology | 2.32 | 68 | -0.43 | -25.16% |
| VIPS | Vipshop | | Services & Goods | 15.74 | 38 | -0.44 | -11.37% |
| BHAT | Fujian Blue | | Technology | 1.11 | 76 | -0.45 | 15.87% |
| YY | JOYY | | Technology | 33.23 | 73 | -0.45 | -16.30% |
| NIO | NIO | | Consumer Staples | 4.13 | 20 | -0.48 | -54.47% |
| MFG | Mizuho Financial | | Financials | 3.89 | 26 | -0.51 | 13.08% |
| JOF | Japan Smaller | | Financials | 7.59 | 51 | -0.52 | 0.00% |
| WIT | Wipro | | Technology | 5.44 | 42 | -0.55 | -2.33% |
| FANH | Fanhua | | Financials | 3.53 | 42 | -0.56 | -46.92% |
| MOMO | Momo | | Technology | 5.72 | 42 | -0.69 | -17.70% |
| ATHM | Autohome | | Technology | 25.05 | 39 | -0.71 | -10.73% |
| LU | Lufax Holding | | Financials | 4.51 | 90 | -0.77 | 47.07% |
| XPEV | XPeng | | Services & Goods | 7.03 | 20 | -0.78 | -51.85% |
| To view more stocks, click on Next / Previous arrows or select different range: 0 - 25 , 25 - 50 , 50 - 75 , 75 - 100 , 100 - 125 , 125 - 150 , 150 - 175 , 175 - 200 , 200 - 225 | ||
 | Click To Change The Sort Order: By Market Cap or Company Size Performance: Year-to-date, Week and Day |  |
|
Get the most comprehensive stock market coverage daily at 12Stocks.com ➞ Best Stocks Today ➞ Best Stocks Weekly ➞ Best Stocks Year-to-Date ➞ Best Stocks Trends ➞  Best Stocks Today 12Stocks.com Best Nasdaq Stocks ➞ Best S&P 500 Stocks ➞ Best Tech Stocks ➞ Best Biotech Stocks ➞ |
| Detailed Overview of Asia Stocks |
| Asia Technical Overview, Leaders & Laggards, Top Asia ETF Funds & Detailed Asia Stocks List, Charts, Trends & More |
| Asia: Technical Analysis, Trends & YTD Performance | |
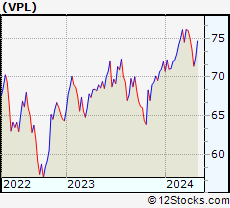
 VPL Weekly Chart |
|
| Long Term Trend: Good | |
| Medium Term Trend: Not Good | |
 VPL Daily Chart |
|
| Short Term Trend: Deteriorating | |
| Overall Trend Score: 31 | |
| YTD Performance: -0.01% | |
| **Trend Scores & Views Are Only For Educational Purposes And Not For Investing | |
| 12Stocks.com: Investing in Asia Index using Exchange Traded Funds | |
|
The following table shows list of key exchange traded funds (ETF) that
help investors play Asia stock market. For detailed view, check out our ETF Funds section of our website. Quick View: Move mouse or cursor over ETF symbol (ticker) to view short-term technical chart and over ETF name to view long term chart. Click on ticker or stock name for detailed view. Click on to add stock symbol to your watchlist and to view watchlist. |
12Stocks.com List of ETFs that track Asia Index
| Ticker | ETF Name | Watchlist | Recent Price | Market Intelligence Score | Change % | Week % | Year-to-date % |
| VPL | Pacific | | 72.02 | 31 | -0.94 | 0.83 | -0.01% |
| EEMA | Emerging Markets Asia | | 68.17 | 68 | 0.50 | 3.15 | 3.12% |
| AIA | Asia 50 | | 60.82 | 61 | 0.26 | 4.66 | 4.92% |
| AAXJ | All Country Asia | | 67.68 | 78 | 0.40 | 3.34 | 1.67% |
| GMF | Emerging Asia Pacific | | 104.07 | 60 | 0.54 | 2.94 | 2.97% |
| EPP | Pacific ex Japan | | 41.81 | 78 | -0.12 | 2.48 | -3.69% |
| ASEA | Southeast Asia | | 14.82 | 63 | -0.34 | 2.28 | -1.73% |
| DVYA | Asia/Pacific Dividend | | 36.13 | 66 | -0.15 | 2.19 | 1.05% |
| IPAC | Core Pacific | | 59.94 | 36 | -1.12 | 0.59 | 0.72% |
| FXI | China Large-Cap | | 25.44 | 100 | 0.67 | 5.96 | 5.87% |
| EWY | South Korea | | 62.90 | 51 | -0.41 | 2.58 | -4.01% |
| EWT | Taiwan | | 46.54 | 56 | 0.02 | 1.82 | 1.11% |
| EWJ | Japan | | 66.56 | 23 | -1.55 | 0.11 | 3.77% |
| EWH | Hong Kong | | 15.71 | 80 | 1.35 | 6.87 | -9.56% |
| EWS | Singapore | | 18.96 | 100 | 0.42 | 4.12 | 1.39% |
| EWM | Malaysia | | 22.05 | 78 | -0.18 | 1.33 | 3.76% |
| EPHE | Philippines | | 25.21 | 25 | 0.00 | 1.9 | -3% |
| EIDO | Indonesia | | 20.86 | 25 | -0.76 | 0.38 | -6.54% |
| THD | Thailand | | 57.59 | 45 | -0.19 | 1.75 | -9.82% |
| VNM | Vietnam | | 12.25 | 25 | 0.33 | 3.38 | -5.19% |
| 12Stocks.com: Charts, Trends, Fundamental Data and Performances of Asia Stocks | |
|
We now take in-depth look at all Asia stocks including charts, multi-period performances and overall trends (as measured by market intelligence score). One can sort Asia stocks (click link to choose) by Daily, Weekly and by Year-to-Date performances. Also, one can sort by size of the company or by market capitalization. |
| Select Your Default Chart Type: | |||||
| |||||
| Click on stock symbol or name for detailed view. Click on to add stock symbol to your watchlist and to view watchlist. Quick View: Move mouse or cursor over "Daily" to quickly view daily technical stock chart and over "Weekly" to view weekly technical stock chart. | |||||

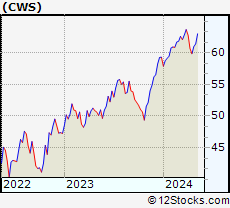 | CWS AdvisorShares Focused Equity ETF |
| Sector: Utilities | |
| SubSector: Exchange Traded Fund | |
| MarketCap: 0 Millions | |
| Recent Price: 60.91 Market Intelligence Score: 36 | |
| Day Percent Change: -0.15% Day Change: -0.09 | |
| Week Change: 1.72% Year-to-date Change: 2.7% | |
| CWS Links: Profile News Message Board | |
| Charts:- Daily , Weekly | |
| Add CWS to Watchlist: View: Get Complete CWS Trend Analysis ➞ | |
 | INFY Infosys Limited |
| Sector: Technology | |
| SubSector: Information Technology Services | |
| MarketCap: 33819.1 Millions | |
| Recent Price: 17.01 Market Intelligence Score: 35 | |
| Day Percent Change: -0.18% Day Change: -0.03 | |
| Week Change: 1.19% Year-to-date Change: -7.5% | |
| INFY Links: Profile News Message Board | |
| Charts:- Daily , Weekly | |
| Add INFY to Watchlist: View: Get Complete INFY Trend Analysis ➞ | |
 | IMOS ChipMOS TECHNOLOGIES INC. |
| Sector: Technology | |
| SubSector: Semiconductor Equipment & Materials | |
| MarketCap: 658.918 Millions | |
| Recent Price: 28.34 Market Intelligence Score: 56 | |
| Day Percent Change: -0.21% Day Change: -0.06 | |
| Week Change: 1.91% Year-to-date Change: 4.2% | |
| IMOS Links: Profile News Message Board | |
| Charts:- Daily , Weekly | |
| Add IMOS to Watchlist: View: Get Complete IMOS Trend Analysis ➞ | |
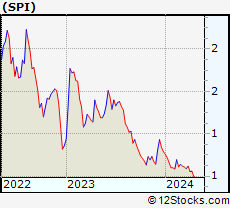 | SPI SPI Energy Co., Ltd. |
| Sector: Technology | |
| SubSector: Semiconductor - Specialized | |
| MarketCap: 12.066 Millions | |
| Recent Price: 0.54 Market Intelligence Score: 30 | |
| Day Percent Change: -0.22% Day Change: 0.00 | |
| Week Change: 8.87% Year-to-date Change: -31.8% | |
| SPI Links: Profile News Message Board | |
| Charts:- Daily , Weekly | |
| Add SPI to Watchlist: View: Get Complete SPI Trend Analysis ➞ | |
 | SOHU Sohu.com Limited |
| Sector: Technology | |
| SubSector: Internet Information Providers | |
| MarketCap: 243.48 Millions | |
| Recent Price: 11.20 Market Intelligence Score: 68 | |
| Day Percent Change: -0.27% Day Change: -0.03 | |
| Week Change: 2.1% Year-to-date Change: 12.8% | |
| SOHU Links: Profile News Message Board | |
| Charts:- Daily , Weekly | |
| Add SOHU to Watchlist: View: Get Complete SOHU Trend Analysis ➞ | |
 | IMAB I Mab |
| Sector: Health Care | |
| SubSector: Biotechnology | |
| MarketCap: 26187 Millions | |
| Recent Price: 1.80 Market Intelligence Score: 41 | |
| Day Percent Change: -0.28% Day Change: -0.01 | |
| Week Change: -0.28% Year-to-date Change: -5.0% | |
| IMAB Links: Profile News Message Board | |
| Charts:- Daily , Weekly | |
| Add IMAB to Watchlist: View: Get Complete IMAB Trend Analysis ➞ | |
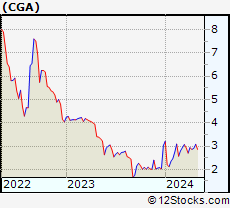 | CGA China Green Agriculture, Inc. |
| Sector: Materials | |
| SubSector: Agricultural Chemicals | |
| MarketCap: 18.2429 Millions | |
| Recent Price: 2.99 Market Intelligence Score: 68 | |
| Day Percent Change: -0.33% Day Change: -0.01 | |
| Week Change: 2.75% Year-to-date Change: -1.3% | |
| CGA Links: Profile News Message Board | |
| Charts:- Daily , Weekly | |
| Add CGA to Watchlist: View: Get Complete CGA Trend Analysis ➞ | |
 | SMI Semiconductor Manufacturing International Corporation |
| Sector: Technology | |
| SubSector: Semiconductor - Integrated Circuits | |
| MarketCap: 6287.56 Millions | |
| Recent Price: 45.59 Market Intelligence Score: 43 | |
| Day Percent Change: -0.34% Day Change: -0.15 | |
| Week Change: -0.29% Year-to-date Change: -1.9% | |
| SMI Links: Profile News Message Board | |
| Charts:- Daily , Weekly | |
| Add SMI to Watchlist: View: Get Complete SMI Trend Analysis ➞ | |
 | JKS JinkoSolar Holding Co., Ltd. |
| Sector: Technology | |
| SubSector: Semiconductor - Specialized | |
| MarketCap: 629.36 Millions | |
| Recent Price: 23.09 Market Intelligence Score: 52 | |
| Day Percent Change: -0.35% Day Change: -0.08 | |
| Week Change: 7.1% Year-to-date Change: -37.5% | |
| JKS Links: Profile News Message Board | |
| Charts:- Daily , Weekly | |
| Add JKS to Watchlist: View: Get Complete JKS Trend Analysis ➞ | |
 | XIN Xinyuan Real Estate Co., Ltd. |
| Sector: Financials | |
| SubSector: Real Estate Development | |
| MarketCap: 136.119 Millions | |
| Recent Price: 2.72 Market Intelligence Score: 49 | |
| Day Percent Change: -0.37% Day Change: -0.01 | |
| Week Change: 4.62% Year-to-date Change: 0.0% | |
| XIN Links: Profile News Message Board | |
| Charts:- Daily , Weekly | |
| Add XIN to Watchlist: View: Get Complete XIN Trend Analysis ➞ | |
 | HOLI Hollysys Automation Technologies Ltd. |
| Sector: Industrials | |
| SubSector: Industrial Electrical Equipment | |
| MarketCap: 668.379 Millions | |
| Recent Price: 24.43 Market Intelligence Score: 18 | |
| Day Percent Change: -0.37% Day Change: -0.09 | |
| Week Change: -0.49% Year-to-date Change: -7.3% | |
| HOLI Links: Profile News Message Board | |
| Charts:- Daily , Weekly | |
| Add HOLI to Watchlist: View: Get Complete HOLI Trend Analysis ➞ | |
 | TCOM Trip.com Group Limited |
| Sector: Services & Goods | |
| SubSector: Lodging | |
| MarketCap: 13449.6 Millions | |
| Recent Price: 50.41 Market Intelligence Score: 73 | |
| Day Percent Change: -0.37% Day Change: -0.19 | |
| Week Change: 5.03% Year-to-date Change: 40.0% | |
| TCOM Links: Profile News Message Board | |
| Charts:- Daily , Weekly | |
| Add TCOM to Watchlist: View: Get Complete TCOM Trend Analysis ➞ | |
 | PERF Perfect Corp. |
| Sector: Technology | |
| SubSector: Software - Application | |
| MarketCap: 582 Millions | |
| Recent Price: 2.32 Market Intelligence Score: 68 | |
| Day Percent Change: -0.43% Day Change: -0.01 | |
| Week Change: 0.87% Year-to-date Change: -25.2% | |
| PERF Links: Profile News Message Board | |
| Charts:- Daily , Weekly | |
| Add PERF to Watchlist: View: Get Complete PERF Trend Analysis ➞ | |
 | VIPS Vipshop Holdings Limited |
| Sector: Services & Goods | |
| SubSector: Catalog & Mail Order Houses | |
| MarketCap: 10496.2 Millions | |
| Recent Price: 15.74 Market Intelligence Score: 38 | |
| Day Percent Change: -0.44% Day Change: -0.07 | |
| Week Change: 3.83% Year-to-date Change: -11.4% | |
| VIPS Links: Profile News Message Board | |
| Charts:- Daily , Weekly | |
| Add VIPS to Watchlist: View: Get Complete VIPS Trend Analysis ➞ | |
 | BHAT Fujian Blue Hat Interactive Entertainment Technology Ltd. |
| Sector: Technology | |
| SubSector: Multimedia & Graphics Software | |
| MarketCap: 28.3586 Millions | |
| Recent Price: 1.11 Market Intelligence Score: 76 | |
| Day Percent Change: -0.45% Day Change: 0.00 | |
| Week Change: 4.72% Year-to-date Change: 15.9% | |
| BHAT Links: Profile News Message Board | |
| Charts:- Daily , Weekly | |
| Add BHAT to Watchlist: View: Get Complete BHAT Trend Analysis ➞ | |
 | YY JOYY Inc. |
| Sector: Technology | |
| SubSector: Internet Information Providers | |
| MarketCap: 3527.6 Millions | |
| Recent Price: 33.23 Market Intelligence Score: 73 | |
| Day Percent Change: -0.45% Day Change: -0.15 | |
| Week Change: 3.1% Year-to-date Change: -16.3% | |
| YY Links: Profile News Message Board | |
| Charts:- Daily , Weekly | |
| Add YY to Watchlist: View: Get Complete YY Trend Analysis ➞ | |
 | NIO NIO Limited |
| Sector: Consumer Staples | |
| SubSector: Auto Manufacturers - Major | |
| MarketCap: 2679.71 Millions | |
| Recent Price: 4.13 Market Intelligence Score: 20 | |
| Day Percent Change: -0.48% Day Change: -0.02 | |
| Week Change: 8.68% Year-to-date Change: -54.5% | |
| NIO Links: Profile News Message Board | |
| Charts:- Daily , Weekly | |
| Add NIO to Watchlist: View: Get Complete NIO Trend Analysis ➞ | |
 | MFG Mizuho Financial Group, Inc. |
| Sector: Financials | |
| SubSector: Foreign Regional Banks | |
| MarketCap: 27893.1 Millions | |
| Recent Price: 3.89 Market Intelligence Score: 26 | |
| Day Percent Change: -0.51% Day Change: -0.02 | |
| Week Change: 1.04% Year-to-date Change: 13.1% | |
| MFG Links: Profile News Message Board | |
| Charts:- Daily , Weekly | |
| Add MFG to Watchlist: View: Get Complete MFG Trend Analysis ➞ | |
 | JOF Japan Smaller Capitalization Fund, Inc. |
| Sector: Financials | |
| SubSector: Closed-End Fund - Foreign | |
| MarketCap: 172.247 Millions | |
| Recent Price: 7.59 Market Intelligence Score: 51 | |
| Day Percent Change: -0.52% Day Change: -0.04 | |
| Week Change: 0.53% Year-to-date Change: 0.0% | |
| JOF Links: Profile News Message Board | |
| Charts:- Daily , Weekly | |
| Add JOF to Watchlist: View: Get Complete JOF Trend Analysis ➞ | |
 | WIT Wipro Limited |
| Sector: Technology | |
| SubSector: Information Technology Services | |
| MarketCap: 15101.3 Millions | |
| Recent Price: 5.44 Market Intelligence Score: 42 | |
| Day Percent Change: -0.55% Day Change: -0.03 | |
| Week Change: 3.62% Year-to-date Change: -2.3% | |
| WIT Links: Profile News Message Board | |
| Charts:- Daily , Weekly | |
| Add WIT to Watchlist: View: Get Complete WIT Trend Analysis ➞ | |
 | FANH Fanhua Inc. |
| Sector: Financials | |
| SubSector: Insurance Brokers | |
| MarketCap: 1436.67 Millions | |
| Recent Price: 3.53 Market Intelligence Score: 42 | |
| Day Percent Change: -0.56% Day Change: -0.02 | |
| Week Change: 0.86% Year-to-date Change: -46.9% | |
| FANH Links: Profile News Message Board | |
| Charts:- Daily , Weekly | |
| Add FANH to Watchlist: View: Get Complete FANH Trend Analysis ➞ | |
 | MOMO Momo Inc. |
| Sector: Technology | |
| SubSector: Internet Software & Services | |
| MarketCap: 4796.71 Millions | |
| Recent Price: 5.72 Market Intelligence Score: 42 | |
| Day Percent Change: -0.69% Day Change: -0.04 | |
| Week Change: 2.33% Year-to-date Change: -17.7% | |
| MOMO Links: Profile News Message Board | |
| Charts:- Daily , Weekly | |
| Add MOMO to Watchlist: View: Get Complete MOMO Trend Analysis ➞ | |
 | ATHM Autohome Inc. |
| Sector: Technology | |
| SubSector: Internet Information Providers | |
| MarketCap: 7984.2 Millions | |
| Recent Price: 25.05 Market Intelligence Score: 39 | |
| Day Percent Change: -0.71% Day Change: -0.18 | |
| Week Change: 3.17% Year-to-date Change: -10.7% | |
| ATHM Links: Profile News Message Board | |
| Charts:- Daily , Weekly | |
| Add ATHM to Watchlist: View: Get Complete ATHM Trend Analysis ➞ | |
 | LU Lufax Holding Ltd |
| Sector: Financials | |
| SubSector: Credit Services | |
| MarketCap: 33457 Millions | |
| Recent Price: 4.51 Market Intelligence Score: 90 | |
| Day Percent Change: -0.77% Day Change: -0.04 | |
| Week Change: 3.79% Year-to-date Change: 47.1% | |
| LU Links: Profile News Message Board | |
| Charts:- Daily , Weekly | |
| Add LU to Watchlist: View: Get Complete LU Trend Analysis ➞ | |
 | XPEV XPeng Inc. |
| Sector: Services & Goods | |
| SubSector: Auto Manufacturers | |
| MarketCap: 32917 Millions | |
| Recent Price: 7.03 Market Intelligence Score: 20 | |
| Day Percent Change: -0.78% Day Change: -0.05 | |
| Week Change: -0.28% Year-to-date Change: -51.9% | |
| XPEV Links: Profile News Message Board | |
| Charts:- Daily , Weekly | |
| Add XPEV to Watchlist: View: Get Complete XPEV Trend Analysis ➞ | |
| To view more stocks, click on Next / Previous arrows or select different range: 0 - 25 , 25 - 50 , 50 - 75 , 75 - 100 , 100 - 125 , 125 - 150 , 150 - 175 , 175 - 200 , 200 - 225 | ||
| Click To Change The Sort Order: By Market Cap or Company Size Performance: Year-to-date, Week and Day | |
| Select Chart Type: | ||
|
Best Stocks Today 12Stocks.com |
© 2024 12Stocks.com Terms & Conditions Privacy Contact Us
All Information Provided Only For Education And Not To Be Used For Investing or Trading. See Terms & Conditions


One More Thing ... Get Best Stocks Delivered Daily!
Never Ever Miss A Move With Our Top Ten Stocks Lists
Find Best Stocks In Any Market - Bull or Bear Market
Take A Peek At Our Top Ten Stocks Lists: Daily, Weekly, Year-to-Date & Top Trends
Find Best Stocks In Any Market - Bull or Bear Market
Take A Peek At Our Top Ten Stocks Lists: Daily, Weekly, Year-to-Date & Top Trends
Asia Stocks With Best Up Trends [0-bearish to 100-bullish]: Yatsen Holding[100], Kanzhun [100], JD.com [100], Dada Nexus[100], ZTO Express[100], Alibaba [100], Baozun [95], MOGU [93], Full Truck[93], MINISO [93], U Power[93]
Best Asia Stocks Year-to-Date:
U Power[2852.01%], DouYu [791.58%], MicroCloud Hologram[668.35%], China Liberal[520.81%], Yatsen Holding[502.79%], Zhongchao [312.22%], Uxin [172.47%], QuantaSing [103.7%], GigaCloud [97.54%], Cheetah Mobile[88.16%], Yiren Digital[61.54%] Best Asia Stocks This Week:
WiMi Hologram[33.51%], Yatsen Holding[21.99%], Cheetah Mobile[21.19%], iQIYI [17.99%], Aesthetic Medical[17.77%], TAL Education[16.8%], Golden Heaven[15.91%], Hutchison China[15.16%], BeiGene [14.7%], Bilibili [14.67%], TOP Financial[14.04%] Best Asia Stocks Daily:
Boqii Holding[15.69%], MicroCloud Hologram[13.86%], TAL Education[8.89%], MOGU [8.43%], Cheetah Mobile[8.33%], Shengfeng Development[7.69%], Viomi [7.13%], Sify [5.88%], Fangdd Network[5.41%], Secoo Holding[5.19%], 21Vianet [5.06%]