
 Login Sign Up


| |||||
 |  | ||||

| 12Stocks.com Market Intelligence |
Best Asia Stocks
|
|
| Quick Read: Top Asia Stocks By Performances & Trends: Daily, Weekly, Year-to-Date, Market Cap (Size) & Technical Trends | |||
| Best Asia Views: Quick Browse View, Summary & Slide Show | |||
| 12Stocks.com Asia Stocks Performances & Trends Daily | |||||||||
|
|  The overall market intelligence score is 100 (0-bearish to 100-bullish) which puts Asia index in short term bullish trend. The market intelligence score from previous trading session is 90 and an improvement of trend continues.
| ||||||||
Here are the market intelligence trend scores of the most requested Asia stocks at 12Stocks.com (click stock name for detailed review):
|


| Consider signing up for our daily 12Stocks.com "Best Stocks Newsletter". You will never ever miss a big stock move again! |
| 12Stocks.com: Top Performing Asia Index Stocks | |||||||||||||||||||||||||||||||||||||||||||||||
 The top performing Asia Index stocks year to date are
Now, more recently, over last week, the top performing Asia Index stocks on the move are


|
|||||||||||||||||||||||||||||||||||||||||||||||
| 12Stocks.com: Investing in Asia Index with Stocks | |
|
The following table helps investors and traders sort through current performance and trends (as measured by market intelligence score) of various
stocks in the Asia Index. Quick View: Move mouse or cursor over stock symbol (ticker) to view short-term technical chart and over stock name to view long term chart. Click on  to add stock symbol to your watchlist and to add stock symbol to your watchlist and  to view watchlist. Click on any ticker or stock name for detailed market intelligence report for that stock. to view watchlist. Click on any ticker or stock name for detailed market intelligence report for that stock. |
12Stocks.com Performance of Stocks in Asia Index
| Ticker | Stock Name | Watchlist | Category | Recent Price | Market Intelligence Score | Change % | YTD Change% |
| QFIN | Qfin |   | Financials | 28.36 | 40 | -1.46% | -25.32% |
| YY | JOYY | | Technology | 47.85 | 70 | -2.39% | 20.29% |
| ZLAB | Zai Lab | | Health Care | 32.80 | 40 | 0.99% | 32.20% |
| TTM | Tata Motors | | Consumer Staples | 25.14 | 20 | 0.00% | 0.00% |
| ATHM | Autohome | | Technology | 29.42 | 100 | -0.34% | 14.16% |
| WNS | WNS () | | Technology | 75.63 | 90 | -0.15% | 59.89% |
| RNW | ReNew Energy | | Utilities | 7.62 | 30 | 0.13% | 12.06% |
| SIMO | Silicon Motion | | Technology | 88.73 | 100 | -0.39% | 66.51% |
| HSAI | Hesai | | Services & Goods | 28.57 | 61 | -11.00% | 66.86% |
| HCM | HUTCHMED (China) | | Health Care | 17.93 | 90 | 9.53% | 18.90% |
| LU | Lufax Holding | | Financials | 3.01 | 30 | -0.33% | 25.94% |
| NORD | Nord Anglia | | Services & Goods | 1.80 | 10 | -5.26% | -80.00% |
| RLX | RLX | | Consumer Staples | 2.61 | 60 | -2.97% | 18.10% |
| GSH | Guangshen Railway | | Transports | 283.85 | 30 | 1.27% | 0.00% |
| SINA | SINA | | Technology | 79.70 | 100 | 1.07% | 0.00% |
| VNET | VNET | | Technology | 9.57 | 100 | 5.05% | 89.13% |
| CHA | Chagee | | Services & Goods | 16.64 | 10 | -3.03% | -40.57% |
| BEST | BEST | | Consumer Staples | 2.78 | 20 | -0.71% | 5.30% |
| DQ | Daqo New | | Technology | 25.81 | 50 | -0.23% | 27.52% |
| WB | Weibo Corp | | Technology | 12.25 | 70 | 2.85% | 47.40% |
| HIMX | Himax | | Technology | 8.27 | 30 | -0.72% | 15.07% |
| FANH | Fanhua | | Financials | 1.51 | 10 | -1.31% | 0.00% |
| IQ | iQIYI | | Technology | 2.61 | 50 | -0.38% | 31.16% |
| TUYA | Tuya | | Technology | 2.58 | 70 | -1.90% | 50.10% |
| JKS | JinkoSolar Holding | | Technology | 25.09 | 90 | 6.31% | 2.64% |
| To view more stocks, click on Next / Previous arrows or select different range: 0 - 25 , 25 - 50 , 50 - 75 , 75 - 100 , 100 - 125 , 125 - 150 , 150 - 175 , 175 - 200 , 200 - 225 , 225 - 250 , 250 - 275 , 275 - 300 , 300 - 325 , 325 - 350 | ||
 | Click To Change The Sort Order: By Market Cap or Company Size Performance: Year-to-date, Week and Day |  |
|
Get the most comprehensive stock market coverage daily at 12Stocks.com ➞ Best Stocks Today ➞ Best Stocks Weekly ➞ Best Stocks Year-to-Date ➞ Best Stocks Trends ➞  Best Stocks Today 12Stocks.com Best Nasdaq Stocks ➞ Best S&P 500 Stocks ➞ Best Tech Stocks ➞ Best Biotech Stocks ➞ |
| Detailed Overview of Asia Stocks |
| Asia Technical Overview, Leaders & Laggards, Top Asia ETF Funds & Detailed Asia Stocks List, Charts, Trends & More |
| Asia: Technical Analysis, Trends & YTD Performance | |
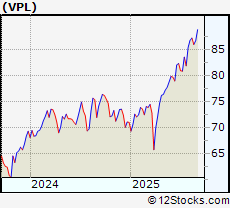
 VPL Weekly Chart |
|
| Long Term Trend: Very Good | |
| Medium Term Trend: Good | |
 VPL Daily Chart |
|
| Short Term Trend: Very Good | |
| Overall Trend Score: 100 | |
| YTD Performance: 26.1881% | |
| **Trend Scores & Views Are Only For Educational Purposes And Not For Investing | |
| 12Stocks.com: Investing in Asia Index using Exchange Traded Funds | |
|
The following table shows list of key exchange traded funds (ETF) that
help investors play Asia stock market. For detailed view, check out our ETF Funds section of our website. Quick View: Move mouse or cursor over ETF symbol (ticker) to view short-term technical chart and over ETF name to view long term chart. Click on ticker or stock name for detailed view. Click on to add stock symbol to your watchlist and to view watchlist. |
12Stocks.com List of ETFs that track Asia Index
| Ticker | ETF Name | Watchlist | Recent Price | Market Intelligence Score | Change % | Week % | Year-to-date % |
| AYT | GEMS Asia 8 | | 4.23 | 0 | 0.475059 | -79.1933 | 0% |
| ALD | Asia Local Debt | | 31.68 | 70 | -0.0946074 | 6.30872 | 0% |
| ADRA | Asia 50 ADR | | 3.29 | 50 | 9.66667 | 2.49221 | 0% |
| INP | India ETN | | 52.85 | 70 | 0.132626 | 7.6594 | 0% |
| 12Stocks.com: Charts, Trends, Fundamental Data and Performances of Asia Stocks | |
|
We now take in-depth look at all Asia stocks including charts, multi-period performances and overall trends (as measured by market intelligence score). One can sort Asia stocks (click link to choose) by Daily, Weekly and by Year-to-Date performances. Also, one can sort by size of the company or by market capitalization. |
| Select Your Default Chart Type: | |||||
| |||||
| Click on stock symbol or name for detailed view. Click on to add stock symbol to your watchlist and to view watchlist. Quick View: Move mouse or cursor over "Daily" to quickly view daily technical stock chart and over "Weekly" to view weekly technical stock chart. | |||||

 | QFIN Qfin Holdings Inc. ADR |
| Sector: Financials | |
| SubSector: Credit Services | |
| MarketCap: 3718.52 Millions | |
| Recent Price: 28.36 Market Intelligence Score: 40 | |
| Day Percent Change: -1.45935% Day Change: 0.99 | |
| Week Change: -1.86851% Year-to-date Change: -25.3% | |
| QFIN Links: Profile News Message Board | |
| Charts:- Daily , Weekly | |
| Add QFIN to Watchlist: View: Get Complete QFIN Trend Analysis ➞ | |
 | YY JOYY Inc. |
| Sector: Technology | |
| SubSector: Internet Information Providers | |
| MarketCap: 3527.6 Millions | |
| Recent Price: 47.85 Market Intelligence Score: 70 | |
| Day Percent Change: -2.38678% Day Change: -9999 | |
| Week Change: 10.8922% Year-to-date Change: 20.3% | |
| YY Links: Profile News Message Board | |
| Charts:- Daily , Weekly | |
| Add YY to Watchlist: View: Get Complete YY Trend Analysis ➞ | |
 | ZLAB Zai Lab Limited ADR |
| Sector: Health Care | |
| SubSector: Biotechnology | |
| MarketCap: 3422.67 Millions | |
| Recent Price: 32.80 Market Intelligence Score: 40 | |
| Day Percent Change: 0.985222% Day Change: 0.49 | |
| Week Change: 4.79233% Year-to-date Change: 32.2% | |
| ZLAB Links: Profile News Message Board | |
| Charts:- Daily , Weekly | |
| Add ZLAB to Watchlist: View: Get Complete ZLAB Trend Analysis ➞ | |
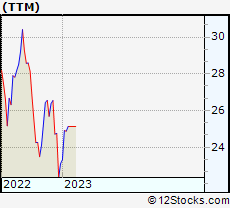 | TTM Tata Motors Limited |
| Sector: Consumer Staples | |
| SubSector: Auto Manufacturers - Major | |
| MarketCap: 3396.01 Millions | |
| Recent Price: 25.14 Market Intelligence Score: 20 | |
| Day Percent Change: 0% Day Change: -9999 | |
| Week Change: 0% Year-to-date Change: 0.0% | |
| TTM Links: Profile News Message Board | |
| Charts:- Daily , Weekly | |
| Add TTM to Watchlist: View: Get Complete TTM Trend Analysis ➞ | |
 | ATHM Autohome Inc ADR |
| Sector: Technology | |
| SubSector: Internet Content & Information | |
| MarketCap: 3388.57 Millions | |
| Recent Price: 29.42 Market Intelligence Score: 100 | |
| Day Percent Change: -0.338753% Day Change: 0.28 | |
| Week Change: 2.83118% Year-to-date Change: 14.2% | |
| ATHM Links: Profile News Message Board | |
| Charts:- Daily , Weekly | |
| Add ATHM to Watchlist: View: Get Complete ATHM Trend Analysis ➞ | |
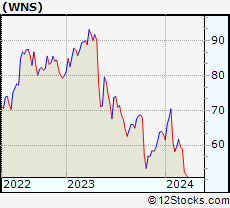 | WNS WNS (Holdings) Limited |
| Sector: Technology | |
| SubSector: Information Technology Services | |
| MarketCap: 3233.91 Millions | |
| Recent Price: 75.63 Market Intelligence Score: 90 | |
| Day Percent Change: -0.145234% Day Change: 0.21 | |
| Week Change: 0.30504% Year-to-date Change: 59.9% | |
| WNS Links: Profile News Message Board | |
| Charts:- Daily , Weekly | |
| Add WNS to Watchlist: View: Get Complete WNS Trend Analysis ➞ | |
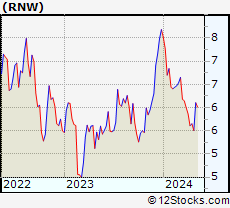 | RNW ReNew Energy Global plc |
| Sector: Utilities | |
| SubSector: Utilities - Renewable | |
| MarketCap: 2829.6 Millions | |
| Recent Price: 7.62 Market Intelligence Score: 30 | |
| Day Percent Change: 0.131406% Day Change: -0.04 | |
| Week Change: -0.26178% Year-to-date Change: 12.1% | |
| RNW Links: Profile News Message Board | |
| Charts:- Daily , Weekly | |
| Add RNW to Watchlist: View: Get Complete RNW Trend Analysis ➞ | |
 | SIMO Silicon Motion Technology Corp ADR |
| Sector: Technology | |
| SubSector: Semiconductors | |
| MarketCap: 2799.27 Millions | |
| Recent Price: 88.73 Market Intelligence Score: 100 | |
| Day Percent Change: -0.392905% Day Change: 0.06 | |
| Week Change: 9.31379% Year-to-date Change: 66.5% | |
| SIMO Links: Profile News Message Board | |
| Charts:- Daily , Weekly | |
| Add SIMO to Watchlist: View: Get Complete SIMO Trend Analysis ➞ | |
 | HSAI Hesai Group ADR |
| Sector: Services & Goods | |
| SubSector: Auto Parts | |
| MarketCap: 2793.9 Millions | |
| Recent Price: 28.57 Market Intelligence Score: 61 | |
| Day Percent Change: -11% Day Change: -2.85 | |
| Week Change: -1.11% Year-to-date Change: 66.9% | |
| HSAI Links: Profile News Message Board | |
| Charts:- Daily , Weekly | |
| Add HSAI to Watchlist: View: Get Complete HSAI Trend Analysis ➞ | |
 | HCM HUTCHMED (China) Limited ADR |
| Sector: Health Care | |
| SubSector: Drug Manufacturers - Specialty & Generic | |
| MarketCap: 2785.49 Millions | |
| Recent Price: 17.93 Market Intelligence Score: 90 | |
| Day Percent Change: 9.52963% Day Change: 0.23 | |
| Week Change: 20.8221% Year-to-date Change: 18.9% | |
| HCM Links: Profile News Message Board | |
| Charts:- Daily , Weekly | |
| Add HCM to Watchlist: View: Get Complete HCM Trend Analysis ➞ | |
 | LU Lufax Holding Ltd ADR |
| Sector: Financials | |
| SubSector: Credit Services | |
| MarketCap: 2522.68 Millions | |
| Recent Price: 3.01 Market Intelligence Score: 30 | |
| Day Percent Change: -0.331126% Day Change: 0.15 | |
| Week Change: -1.9544% Year-to-date Change: 25.9% | |
| LU Links: Profile News Message Board | |
| Charts:- Daily , Weekly | |
| Add LU to Watchlist: View: Get Complete LU Trend Analysis ➞ | |
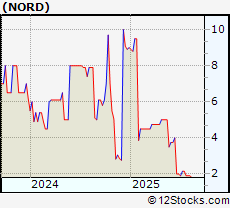 | NORD Nord Anglia Education, Inc. |
| Sector: Services & Goods | |
| SubSector: Education & Training Services | |
| MarketCap: 2506.4 Millions | |
| Recent Price: 1.80 Market Intelligence Score: 10 | |
| Day Percent Change: -5.26316% Day Change: -9999 | |
| Week Change: -5.26316% Year-to-date Change: -80.0% | |
| NORD Links: Profile News Message Board | |
| Charts:- Daily , Weekly | |
| Add NORD to Watchlist: View: Get Complete NORD Trend Analysis ➞ | |
 | RLX RLX Technology Inc ADR |
| Sector: Consumer Staples | |
| SubSector: Tobacco | |
| MarketCap: 2374.4 Millions | |
| Recent Price: 2.61 Market Intelligence Score: 60 | |
| Day Percent Change: -2.97398% Day Change: 0 | |
| Week Change: 1.95312% Year-to-date Change: 18.1% | |
| RLX Links: Profile News Message Board | |
| Charts:- Daily , Weekly | |
| Add RLX to Watchlist: View: Get Complete RLX Trend Analysis ➞ | |
 | GSH Guangshen Railway Company Limited |
| Sector: Transports | |
| SubSector: Railroads | |
| MarketCap: 2283.52 Millions | |
| Recent Price: 283.85 Market Intelligence Score: 30 | |
| Day Percent Change: 1.27373% Day Change: -9999 | |
| Week Change: -6.83057% Year-to-date Change: 0.0% | |
| GSH Links: Profile News Message Board | |
| Charts:- Daily , Weekly | |
| Add GSH to Watchlist: View: Get Complete GSH Trend Analysis ➞ | |
 | SINA SINA Corporation |
| Sector: Technology | |
| SubSector: Internet Software & Services | |
| MarketCap: 2168.61 Millions | |
| Recent Price: 79.70 Market Intelligence Score: 100 | |
| Day Percent Change: 1.06518% Day Change: -9999 | |
| Week Change: 64.9762% Year-to-date Change: 0.0% | |
| SINA Links: Profile News Message Board | |
| Charts:- Daily , Weekly | |
| Add SINA to Watchlist: View: Get Complete SINA Trend Analysis ➞ | |
 | VNET VNET Group Inc ADR |
| Sector: Technology | |
| SubSector: Information Technology Services | |
| MarketCap: 2084.81 Millions | |
| Recent Price: 9.57 Market Intelligence Score: 100 | |
| Day Percent Change: 5.0494% Day Change: -0.64 | |
| Week Change: 26.2533% Year-to-date Change: 89.1% | |
| VNET Links: Profile News Message Board | |
| Charts:- Daily , Weekly | |
| Add VNET to Watchlist: View: Get Complete VNET Trend Analysis ➞ | |
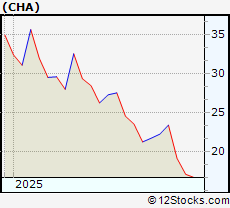 | CHA Chagee Holdings Ltd. ADR |
| Sector: Services & Goods | |
| SubSector: Restaurants | |
| MarketCap: 2019.04 Millions | |
| Recent Price: 16.64 Market Intelligence Score: 10 | |
| Day Percent Change: -3.0303% Day Change: 0.24 | |
| Week Change: -6.72646% Year-to-date Change: -40.6% | |
| CHA Links: Profile News Message Board | |
| Charts:- Daily , Weekly | |
| Add CHA to Watchlist: View: Get Complete CHA Trend Analysis ➞ | |
 | BEST BEST Inc. |
| Sector: Consumer Staples | |
| SubSector: Packaging & Containers | |
| MarketCap: 1981.73 Millions | |
| Recent Price: 2.78 Market Intelligence Score: 20 | |
| Day Percent Change: -0.714286% Day Change: -9999 | |
| Week Change: 0% Year-to-date Change: 5.3% | |
| BEST Links: Profile News Message Board | |
| Charts:- Daily , Weekly | |
| Add BEST to Watchlist: View: Get Complete BEST Trend Analysis ➞ | |
 | DQ Daqo New Energy Corp ADR |
| Sector: Technology | |
| SubSector: Solar | |
| MarketCap: 1949.77 Millions | |
| Recent Price: 25.81 Market Intelligence Score: 50 | |
| Day Percent Change: -0.231929% Day Change: -0.36 | |
| Week Change: -4.26558% Year-to-date Change: 27.5% | |
| DQ Links: Profile News Message Board | |
| Charts:- Daily , Weekly | |
| Add DQ to Watchlist: View: Get Complete DQ Trend Analysis ➞ | |
 | WB Weibo Corp ADR |
| Sector: Technology | |
| SubSector: Internet Content & Information | |
| MarketCap: 1832.03 Millions | |
| Recent Price: 12.25 Market Intelligence Score: 70 | |
| Day Percent Change: 2.85474% Day Change: 0.12 | |
| Week Change: 6.15251% Year-to-date Change: 47.4% | |
| WB Links: Profile News Message Board | |
| Charts:- Daily , Weekly | |
| Add WB to Watchlist: View: Get Complete WB Trend Analysis ➞ | |
 | HIMX Himax Technologies ADR |
| Sector: Technology | |
| SubSector: Semiconductors | |
| MarketCap: 1464.06 Millions | |
| Recent Price: 8.27 Market Intelligence Score: 30 | |
| Day Percent Change: -0.720288% Day Change: 0.01 | |
| Week Change: -0.600962% Year-to-date Change: 15.1% | |
| HIMX Links: Profile News Message Board | |
| Charts:- Daily , Weekly | |
| Add HIMX to Watchlist: View: Get Complete HIMX Trend Analysis ➞ | |
 | FANH Fanhua Inc. |
| Sector: Financials | |
| SubSector: Insurance Brokers | |
| MarketCap: 1436.67 Millions | |
| Recent Price: 1.51 Market Intelligence Score: 10 | |
| Day Percent Change: -1.30719% Day Change: -9999 | |
| Week Change: -7.92683% Year-to-date Change: 0.0% | |
| FANH Links: Profile News Message Board | |
| Charts:- Daily , Weekly | |
| Add FANH to Watchlist: View: Get Complete FANH Trend Analysis ➞ | |
 | IQ iQIYI Inc ADR |
| Sector: Technology | |
| SubSector: Entertainment | |
| MarketCap: 1431.96 Millions | |
| Recent Price: 2.61 Market Intelligence Score: 50 | |
| Day Percent Change: -0.381679% Day Change: 0.05 | |
| Week Change: -3.69004% Year-to-date Change: 31.2% | |
| IQ Links: Profile News Message Board | |
| Charts:- Daily , Weekly | |
| Add IQ to Watchlist: View: Get Complete IQ Trend Analysis ➞ | |
 | TUYA Tuya Inc ADR |
| Sector: Technology | |
| SubSector: Software - Infrastructure | |
| MarketCap: 1359.24 Millions | |
| Recent Price: 2.58 Market Intelligence Score: 70 | |
| Day Percent Change: -1.90114% Day Change: 0.07 | |
| Week Change: 4.03226% Year-to-date Change: 50.1% | |
| TUYA Links: Profile News Message Board | |
| Charts:- Daily , Weekly | |
| Add TUYA to Watchlist: View: Get Complete TUYA Trend Analysis ➞ | |
 | JKS JinkoSolar Holding Co. Ltd ADR |
| Sector: Technology | |
| SubSector: Solar | |
| MarketCap: 1277.06 Millions | |
| Recent Price: 25.09 Market Intelligence Score: 90 | |
| Day Percent Change: 6.31356% Day Change: -0.97 | |
| Week Change: 3.46392% Year-to-date Change: 2.6% | |
| JKS Links: Profile News Message Board | |
| Charts:- Daily , Weekly | |
| Add JKS to Watchlist: View: Get Complete JKS Trend Analysis ➞ | |
| To view more stocks, click on Next / Previous arrows or select different range: 0 - 25 , 25 - 50 , 50 - 75 , 75 - 100 , 100 - 125 , 125 - 150 , 150 - 175 , 175 - 200 , 200 - 225 , 225 - 250 , 250 - 275 , 275 - 300 , 300 - 325 , 325 - 350 | ||
| Click To Change The Sort Order: By Market Cap or Company Size Performance: Year-to-date, Week and Day | |
| Select Chart Type: | ||
|
Best Stocks Today 12Stocks.com |
© 2025 12Stocks.com Terms & Conditions Privacy Contact Us
All Information Provided Only For Education And Not To Be Used For Investing or Trading. See Terms & Conditions


One More Thing ... Get Best Stocks Delivered Daily!
Never Ever Miss A Move With Our Top Ten Stocks Lists
Find Best Stocks In Any Market - Bull or Bear Market
Take A Peek At Our Top Ten Stocks Lists: Daily, Weekly, Year-to-Date & Top Trends
Find Best Stocks In Any Market - Bull or Bear Market
Take A Peek At Our Top Ten Stocks Lists: Daily, Weekly, Year-to-Date & Top Trends
Asia Stocks With Best Up Trends [0-bearish to 100-bullish]: Sony [100], Baozun [100], VNET [100], Baidu [100], NetEase [100], China [100], Ctrip.com [100], SINA [100], Hollysys Automation[100], Vipshop [100], Taiwan Semiconductor[100]
Best Asia Stocks Year-to-Date:
Regencell Bioscience[11493.1%], So-Young [375.53%], Sify [281.373%], QuantaSing [269.91%], Xunlei [259.524%], Oneconnect Financial[196.708%], Yatsen Holding[165.104%], Niu [132.759%], Masterbeef [128.049%], Tencent Music[120.848%], HUYA [104.307%] Best Asia Stocks This Week:
CNOOC [137266%], Nam Tai[5033.33%], Fang [4150%], Sinopec Shanghai[1992.58%], PetroChina [1137.09%], China [1104.2%], Internet Initiative[913.355%], China Life[690.958%], Leju [539.091%], Aluminum [516.255%], Global Cord[335.132%] Best Asia Stocks Daily:
Sony [194.565%], China SXT[15.1163%], HUTCHMED (China)[9.52963%], Regencell Bioscience[9.29368%], Perfect Corp[8.33333%], Jianpu [7.78054%], Baozun [6.95067%], JinkoSolar Holding[6.31356%], VNET [5.0494%], Bilibili [4.08998%], QuantaSing [3.9%]