
 Login Sign Up


| |||||
 |  | ||||

| 12Stocks.com Market Intelligence |
Best Asia Stocks
|
|
| Quick Read: Top Asia Stocks By Performances & Trends: Daily, Weekly, Year-to-Date, Market Cap (Size) & Technical Trends | |||
| Best Asia Views: Quick Browse View, Summary & Slide Show | |||
| 12Stocks.com Asia Stocks Performances & Trends Daily | |||||||||
|
|  The overall market intelligence score is 100 (0-bearish to 100-bullish) which puts Asia index in short term bullish trend. The market intelligence score from previous trading session is 90 and an improvement of trend continues.
| ||||||||
Here are the market intelligence trend scores of the most requested Asia stocks at 12Stocks.com (click stock name for detailed review):
|


| Consider signing up for our daily 12Stocks.com "Best Stocks Newsletter". You will never ever miss a big stock move again! |
| 12Stocks.com: Top Performing Asia Index Stocks | |||||||||||||||||||||||||||||||||||||||||||||||
 The top performing Asia Index stocks year to date are
Now, more recently, over last week, the top performing Asia Index stocks on the move are


|
|||||||||||||||||||||||||||||||||||||||||||||||
| 12Stocks.com: Investing in Asia Index with Stocks | |
|
The following table helps investors and traders sort through current performance and trends (as measured by market intelligence score) of various
stocks in the Asia Index. Quick View: Move mouse or cursor over stock symbol (ticker) to view short-term technical chart and over stock name to view long term chart. Click on  to add stock symbol to your watchlist and to add stock symbol to your watchlist and  to view watchlist. Click on any ticker or stock name for detailed market intelligence report for that stock. to view watchlist. Click on any ticker or stock name for detailed market intelligence report for that stock. |
12Stocks.com Performance of Stocks in Asia Index
| Ticker | Stock Name | Watchlist | Category | Recent Price | Market Intelligence Score | Change % | Weekly Change% |
| MOMO | Hello |   | Technology | 7.48 | 0 | -0.66% | -10.42% |
| TYHT | Shineco | | Health Care | 67.00 | 10 | 1.98% | -10.55% |
| UTSI | UTStarcom | | Technology | 2.31 | 0 | -7.64% | -11.49% |
| CJJD | China Jo-Jo | | Services & Goods | 1.44 | 10 | -5.26% | -12.20% |
| PN | Skycorp Solar | | Technology | 0.90 | 10 | -10.00% | -12.62% |
| GSX | GSX Techedu | | Services & Goods | 12.97 | 10 | -4.35% | -13.24% |
| ALN | American Lorain | | Consumer Staples | 0.20 | 0 | -4.88% | -13.33% |
| MB | Masterbeef | | Services & Goods | 9.35 | 40 | -8.51% | -13.90% |
| HX | Hexindai | | Financials | 1.47 | 10 | -10.37% | -14.04% |
| RETO | ReTo Eco- | | Materials | 1.36 | 0 | -12.82% | -15.29% |
| SPI | SPI Energy | | Technology | 0.36 | 10 | -53.02% | -16.30% |
| JFIN | Jiayin | | Technology | 11.01 | 0 | 1.38% | -16.46% |
| GMM | Global Mofy | | Technology | 1.92 | 10 | -14.29% | -17.60% |
| SPIL | Siliconware Precision | | Technology | 47.27 | 40 | 0.81% | -18.27% |
| ICG | Intchains | | Technology | 1.86 | 46 | -2.00% | -18.84% |
| GDHG | Golden Heaven | | Services & Goods | 7.56 | 51 | -5.67% | -19.69% |
| CIFS | China Internet | | Financials | 6.07 | 30 | 2.36% | -22.58% |
| UCL | Ucloudlink | | Technology | 2.57 | 30 | 0.19% | -22.82% |
| WUBA | 58.com | | Technology | 78.83 | 0 | -1.08% | -24.09% |
| HLG | Hailiang Education | | Services & Goods | 10.79 | 20 | -0.46% | -24.55% |
| HGSH | China HGS | | Financials | 1.49 | 0 | -3.25% | -25.84% |
| AUO | AU Optronics | | Technology | 20.25 | 10 | 0.40% | -27.50% |
| SORL | SORL Auto | | Consumer Staples | 0.49 | 10 | -2.00% | -28.99% |
| ZPIN | Zhaopin | | Services & Goods | 58.69 | 10 | -0.46% | -29.23% |
| SYT | SYLA | | Technology | 1.50 | 0 | 0.00% | -29.25% |
| To view more stocks, click on Next / Previous arrows or select different range: 0 - 25 , 25 - 50 , 50 - 75 , 75 - 100 , 100 - 125 , 125 - 150 , 150 - 175 , 175 - 200 , 200 - 225 , 225 - 250 , 250 - 275 , 275 - 300 , 300 - 325 , 325 - 350 | ||
 | Click To Change The Sort Order: By Market Cap or Company Size Performance: Year-to-date, Week and Day |  |
|
Get the most comprehensive stock market coverage daily at 12Stocks.com ➞ Best Stocks Today ➞ Best Stocks Weekly ➞ Best Stocks Year-to-Date ➞ Best Stocks Trends ➞  Best Stocks Today 12Stocks.com Best Nasdaq Stocks ➞ Best S&P 500 Stocks ➞ Best Tech Stocks ➞ Best Biotech Stocks ➞ |
| Detailed Overview of Asia Stocks |
| Asia Technical Overview, Leaders & Laggards, Top Asia ETF Funds & Detailed Asia Stocks List, Charts, Trends & More |
| Asia: Technical Analysis, Trends & YTD Performance | |
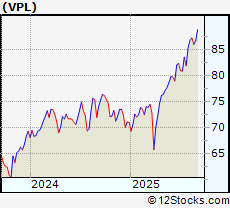
 VPL Weekly Chart |
|
| Long Term Trend: Very Good | |
| Medium Term Trend: Good | |
 VPL Daily Chart |
|
| Short Term Trend: Very Good | |
| Overall Trend Score: 100 | |
| YTD Performance: 26.1881% | |
| **Trend Scores & Views Are Only For Educational Purposes And Not For Investing | |
| 12Stocks.com: Investing in Asia Index using Exchange Traded Funds | |
|
The following table shows list of key exchange traded funds (ETF) that
help investors play Asia stock market. For detailed view, check out our ETF Funds section of our website. Quick View: Move mouse or cursor over ETF symbol (ticker) to view short-term technical chart and over ETF name to view long term chart. Click on ticker or stock name for detailed view. Click on to add stock symbol to your watchlist and to view watchlist. |
12Stocks.com List of ETFs that track Asia Index
| Ticker | ETF Name | Watchlist | Recent Price | Market Intelligence Score | Change % | Week % | Year-to-date % |
| AYT | GEMS Asia 8 | | 4.23 | 0 | 0.475059 | -79.1933 | 0% |
| ALD | Asia Local Debt | | 31.68 | 70 | -0.0946074 | 6.30872 | 0% |
| ADRA | Asia 50 ADR | | 3.29 | 50 | 9.66667 | 2.49221 | 0% |
| INP | India ETN | | 52.85 | 70 | 0.132626 | 7.6594 | 0% |
| 12Stocks.com: Charts, Trends, Fundamental Data and Performances of Asia Stocks | |
|
We now take in-depth look at all Asia stocks including charts, multi-period performances and overall trends (as measured by market intelligence score). One can sort Asia stocks (click link to choose) by Daily, Weekly and by Year-to-Date performances. Also, one can sort by size of the company or by market capitalization. |
| Select Your Default Chart Type: | |||||
| |||||
| Click on stock symbol or name for detailed view. Click on to add stock symbol to your watchlist and to view watchlist. Quick View: Move mouse or cursor over "Daily" to quickly view daily technical stock chart and over "Weekly" to view weekly technical stock chart. | |||||

 | MOMO Hello Group Inc ADR |
| Sector: Technology | |
| SubSector: Internet Content & Information | |
| MarketCap: 1026.57 Millions | |
| Recent Price: 7.48 Market Intelligence Score: 0 | |
| Day Percent Change: -0.664011% Day Change: 0.13 | |
| Week Change: -10.4192% Year-to-date Change: 7.0% | |
| MOMO Links: Profile News Message Board | |
| Charts:- Daily , Weekly | |
| Add MOMO to Watchlist: View: Get Complete MOMO Trend Analysis ➞ | |
 | TYHT Shineco, Inc. |
| Sector: Health Care | |
| SubSector: Drug Related Products | |
| MarketCap: 12.3 Millions | |
| Recent Price: 67.00 Market Intelligence Score: 10 | |
| Day Percent Change: 1.97869% Day Change: -9999 | |
| Week Change: -10.5474% Year-to-date Change: 0.0% | |
| TYHT Links: Profile News Message Board | |
| Charts:- Daily , Weekly | |
| Add TYHT to Watchlist: View: Get Complete TYHT Trend Analysis ➞ | |
 | UTSI UTStarcom Holdings Corp |
| Sector: Technology | |
| SubSector: Communication Equipment | |
| MarketCap: 23.01 Millions | |
| Recent Price: 2.31 Market Intelligence Score: 0 | |
| Day Percent Change: -7.64064% Day Change: -9996.6 | |
| Week Change: -11.4943% Year-to-date Change: -19.8% | |
| UTSI Links: Profile News Message Board | |
| Charts:- Daily , Weekly | |
| Add UTSI to Watchlist: View: Get Complete UTSI Trend Analysis ➞ | |
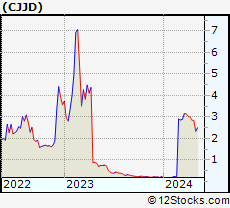 | CJJD China Jo-Jo Drugstores, Inc. |
| Sector: Services & Goods | |
| SubSector: Drug Stores | |
| MarketCap: 57.8351 Millions | |
| Recent Price: 1.44 Market Intelligence Score: 10 | |
| Day Percent Change: -5.26316% Day Change: -9999 | |
| Week Change: -12.1951% Year-to-date Change: -21.3% | |
| CJJD Links: Profile News Message Board | |
| Charts:- Daily , Weekly | |
| Add CJJD to Watchlist: View: Get Complete CJJD Trend Analysis ➞ | |
 | PN Skycorp Solar Group Ltd |
| Sector: Technology | |
| SubSector: Solar | |
| MarketCap: 25.66 Millions | |
| Recent Price: 0.90 Market Intelligence Score: 10 | |
| Day Percent Change: -10% Day Change: 0.09 | |
| Week Change: -12.6214% Year-to-date Change: -77.7% | |
| PN Links: Profile News Message Board | |
| Charts:- Daily , Weekly | |
| Add PN to Watchlist: View: Get Complete PN Trend Analysis ➞ | |
 | GSX GSX Techedu Inc. |
| Sector: Services & Goods | |
| SubSector: Education & Training Services | |
| MarketCap: 10687.6 Millions | |
| Recent Price: 12.97 Market Intelligence Score: 10 | |
| Day Percent Change: -4.35103% Day Change: -9999 | |
| Week Change: -13.2441% Year-to-date Change: 0.0% | |
| GSX Links: Profile News Message Board | |
| Charts:- Daily , Weekly | |
| Add GSX to Watchlist: View: Get Complete GSX Trend Analysis ➞ | |
 | ALN American Lorain Corporation |
| Sector: Consumer Staples | |
| SubSector: Processed & Packaged Goods | |
| MarketCap: 22.6 Millions | |
| Recent Price: 0.20 Market Intelligence Score: 0 | |
| Day Percent Change: -4.87805% Day Change: -9999 | |
| Week Change: -13.3333% Year-to-date Change: 0.0% | |
| ALN Links: Profile News Message Board | |
| Charts:- Daily , Weekly | |
| Add ALN to Watchlist: View: Get Complete ALN Trend Analysis ➞ | |
 | MB Masterbeef Group |
| Sector: Services & Goods | |
| SubSector: Restaurants | |
| MarketCap: 199.91 Millions | |
| Recent Price: 9.35 Market Intelligence Score: 40 | |
| Day Percent Change: -8.51272% Day Change: -0.19 | |
| Week Change: -13.9042% Year-to-date Change: 128.0% | |
| MB Links: Profile News Message Board | |
| Charts:- Daily , Weekly | |
| Add MB to Watchlist: View: Get Complete MB Trend Analysis ➞ | |
 | HX Hexindai Inc. |
| Sector: Financials | |
| SubSector: Credit Services | |
| MarketCap: 18.6208 Millions | |
| Recent Price: 1.47 Market Intelligence Score: 10 | |
| Day Percent Change: -10.3659% Day Change: -9999 | |
| Week Change: -14.0351% Year-to-date Change: 0.0% | |
| HX Links: Profile News Message Board | |
| Charts:- Daily , Weekly | |
| Add HX to Watchlist: View: Get Complete HX Trend Analysis ➞ | |
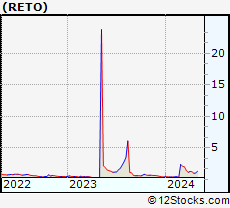 | RETO ReTo Eco-Solutions Inc |
| Sector: Materials | |
| SubSector: Building Materials | |
| MarketCap: 5.4 Millions | |
| Recent Price: 1.36 Market Intelligence Score: 0 | |
| Day Percent Change: -12.8205% Day Change: -0.06 | |
| Week Change: -15.2859% Year-to-date Change: -84.9% | |
| RETO Links: Profile News Message Board | |
| Charts:- Daily , Weekly | |
| Add RETO to Watchlist: View: Get Complete RETO Trend Analysis ➞ | |
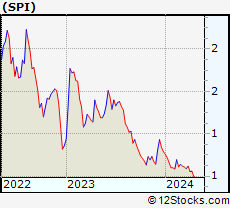 | SPI SPI Energy Co., Ltd. |
| Sector: Technology | |
| SubSector: Semiconductor - Specialized | |
| MarketCap: 12.066 Millions | |
| Recent Price: 0.36 Market Intelligence Score: 10 | |
| Day Percent Change: -53.0157% Day Change: -9999 | |
| Week Change: -16.3023% Year-to-date Change: -10.9% | |
| SPI Links: Profile News Message Board | |
| Charts:- Daily , Weekly | |
| Add SPI to Watchlist: View: Get Complete SPI Trend Analysis ➞ | |
 | JFIN Jiayin Group Inc ADR |
| Sector: Technology | |
| SubSector: Internet Content & Information | |
| MarketCap: 305.89 Millions | |
| Recent Price: 11.01 Market Intelligence Score: 0 | |
| Day Percent Change: 1.38122% Day Change: 1.03 | |
| Week Change: -16.4643% Year-to-date Change: 75.7% | |
| JFIN Links: Profile News Message Board | |
| Charts:- Daily , Weekly | |
| Add JFIN to Watchlist: View: Get Complete JFIN Trend Analysis ➞ | |
 | GMM Global Mofy AI Ltd |
| Sector: Technology | |
| SubSector: Information Technology Services | |
| MarketCap: 63.99 Millions | |
| Recent Price: 1.92 Market Intelligence Score: 10 | |
| Day Percent Change: -14.2857% Day Change: -0.01 | |
| Week Change: -17.5966% Year-to-date Change: -49.9% | |
| GMM Links: Profile News Message Board | |
| Charts:- Daily , Weekly | |
| Add GMM to Watchlist: View: Get Complete GMM Trend Analysis ➞ | |
 | SPIL Siliconware Precision Industries Co., Ltd. |
| Sector: Technology | |
| SubSector: Semiconductor Equipment & Materials | |
| MarketCap: 4964.5 Millions | |
| Recent Price: 47.27 Market Intelligence Score: 40 | |
| Day Percent Change: 0.810407% Day Change: -9999 | |
| Week Change: -18.2746% Year-to-date Change: 0.0% | |
| SPIL Links: Profile News Message Board | |
| Charts:- Daily , Weekly | |
| Add SPIL to Watchlist: View: Get Complete SPIL Trend Analysis ➞ | |
 | ICG Intchains Group Ltd ADR |
| Sector: Technology | |
| SubSector: Semiconductors | |
| MarketCap: 53.08 Millions | |
| Recent Price: 1.86 Market Intelligence Score: 46 | |
| Day Percent Change: -2% Day Change: -0.04 | |
| Week Change: -18.84% Year-to-date Change: -40.6% | |
| ICG Links: Profile News Message Board | |
| Charts:- Daily , Weekly | |
| Add ICG to Watchlist: View: Get Complete ICG Trend Analysis ➞ | |
 | GDHG Golden Heaven Group Holdings Ltd |
| Sector: Services & Goods | |
| SubSector: Leisure | |
| MarketCap: 19.02 Millions | |
| Recent Price: 7.56 Market Intelligence Score: 51 | |
| Day Percent Change: -5.67% Day Change: -0.02 | |
| Week Change: -19.69% Year-to-date Change: -99.4% | |
| GDHG Links: Profile News Message Board | |
| Charts:- Daily , Weekly | |
| Add GDHG to Watchlist: View: Get Complete GDHG Trend Analysis ➞ | |
 | CIFS China Internet Nationwide Financial Services Inc. |
| Sector: Financials | |
| SubSector: Credit Services | |
| MarketCap: 12.2208 Millions | |
| Recent Price: 6.07 Market Intelligence Score: 30 | |
| Day Percent Change: 2.36088% Day Change: -9999 | |
| Week Change: -22.5765% Year-to-date Change: 0.0% | |
| CIFS Links: Profile News Message Board | |
| Charts:- Daily , Weekly | |
| Add CIFS to Watchlist: View: Get Complete CIFS Trend Analysis ➞ | |
 | UCL Ucloudlink Group Inc ADR |
| Sector: Technology | |
| SubSector: Telecom Services | |
| MarketCap: 76.26 Millions | |
| Recent Price: 2.57 Market Intelligence Score: 30 | |
| Day Percent Change: 0.194932% Day Change: -0.03 | |
| Week Change: -22.8228% Year-to-date Change: 47.7% | |
| UCL Links: Profile News Message Board | |
| Charts:- Daily , Weekly | |
| Add UCL to Watchlist: View: Get Complete UCL Trend Analysis ➞ | |
 | WUBA 58.com Inc. |
| Sector: Technology | |
| SubSector: Internet Information Providers | |
| MarketCap: 7215.3 Millions | |
| Recent Price: 78.83 Market Intelligence Score: 0 | |
| Day Percent Change: -1.07918% Day Change: -9999 | |
| Week Change: -24.0851% Year-to-date Change: 0.0% | |
| WUBA Links: Profile News Message Board | |
| Charts:- Daily , Weekly | |
| Add WUBA to Watchlist: View: Get Complete WUBA Trend Analysis ➞ | |
 | HLG Hailiang Education Group Inc. |
| Sector: Services & Goods | |
| SubSector: Education & Training Services | |
| MarketCap: 1024.06 Millions | |
| Recent Price: 10.79 Market Intelligence Score: 20 | |
| Day Percent Change: -0.461255% Day Change: -9999 | |
| Week Change: -24.5455% Year-to-date Change: 0.0% | |
| HLG Links: Profile News Message Board | |
| Charts:- Daily , Weekly | |
| Add HLG to Watchlist: View: Get Complete HLG Trend Analysis ➞ | |
 | HGSH China HGS Real Estate Inc. |
| Sector: Financials | |
| SubSector: Real Estate Development | |
| MarketCap: 16.3119 Millions | |
| Recent Price: 1.49 Market Intelligence Score: 0 | |
| Day Percent Change: -3.25003% Day Change: -9999 | |
| Week Change: -25.8362% Year-to-date Change: 0.0% | |
| HGSH Links: Profile News Message Board | |
| Charts:- Daily , Weekly | |
| Add HGSH to Watchlist: View: Get Complete HGSH Trend Analysis ➞ | |
 | AUO AU Optronics Corp. |
| Sector: Technology | |
| SubSector: Semiconductor - Broad Line | |
| MarketCap: 3845.84 Millions | |
| Recent Price: 20.25 Market Intelligence Score: 10 | |
| Day Percent Change: 0.396629% Day Change: -9999 | |
| Week Change: -27.4973% Year-to-date Change: 0.0% | |
| AUO Links: Profile News Message Board | |
| Charts:- Daily , Weekly | |
| Add AUO to Watchlist: View: Get Complete AUO Trend Analysis ➞ | |
 | SORL SORL Auto Parts, Inc. |
| Sector: Consumer Staples | |
| SubSector: Auto Manufacturers - Major | |
| MarketCap: 65.6471 Millions | |
| Recent Price: 0.49 Market Intelligence Score: 10 | |
| Day Percent Change: -2% Day Change: -9999 | |
| Week Change: -28.9855% Year-to-date Change: 0.0% | |
| SORL Links: Profile News Message Board | |
| Charts:- Daily , Weekly | |
| Add SORL to Watchlist: View: Get Complete SORL Trend Analysis ➞ | |
 | ZPIN Zhaopin Limited |
| Sector: Services & Goods | |
| SubSector: Staffing & Outsourcing Services | |
| MarketCap: 957.9 Millions | |
| Recent Price: 58.69 Market Intelligence Score: 10 | |
| Day Percent Change: -0.457938% Day Change: -9999 | |
| Week Change: -29.2295% Year-to-date Change: 0.0% | |
| ZPIN Links: Profile News Message Board | |
| Charts:- Daily , Weekly | |
| Add ZPIN to Watchlist: View: Get Complete ZPIN Trend Analysis ➞ | |
 | SYT SYLA Technologies Co., Ltd. |
| Sector: Technology | |
| SubSector: Software - Application | |
| MarketCap: 187 Millions | |
| Recent Price: 1.50 Market Intelligence Score: 0 | |
| Day Percent Change: 0% Day Change: -9999 | |
| Week Change: -29.2453% Year-to-date Change: -25.0% | |
| SYT Links: Profile News Message Board | |
| Charts:- Daily , Weekly | |
| Add SYT to Watchlist: View: Get Complete SYT Trend Analysis ➞ | |
| To view more stocks, click on Next / Previous arrows or select different range: 0 - 25 , 25 - 50 , 50 - 75 , 75 - 100 , 100 - 125 , 125 - 150 , 150 - 175 , 175 - 200 , 200 - 225 , 225 - 250 , 250 - 275 , 275 - 300 , 300 - 325 , 325 - 350 | ||
| Click To Change The Sort Order: By Market Cap or Company Size Performance: Year-to-date, Week and Day | |
| Select Chart Type: | ||
|
Best Stocks Today 12Stocks.com |
© 2025 12Stocks.com Terms & Conditions Privacy Contact Us
All Information Provided Only For Education And Not To Be Used For Investing or Trading. See Terms & Conditions


One More Thing ... Get Best Stocks Delivered Daily!
Never Ever Miss A Move With Our Top Ten Stocks Lists
Find Best Stocks In Any Market - Bull or Bear Market
Take A Peek At Our Top Ten Stocks Lists: Daily, Weekly, Year-to-Date & Top Trends
Find Best Stocks In Any Market - Bull or Bear Market
Take A Peek At Our Top Ten Stocks Lists: Daily, Weekly, Year-to-Date & Top Trends
Asia Stocks With Best Up Trends [0-bearish to 100-bullish]: Sony [100], Baozun [100], VNET [100], Baidu [100], NetEase [100], China [100], Ctrip.com [100], SINA [100], Hollysys Automation[100], Vipshop [100], Taiwan Semiconductor[100]
Best Asia Stocks Year-to-Date:
Regencell Bioscience[11493.1%], So-Young [375.53%], Sify [281.373%], QuantaSing [269.91%], Xunlei [259.524%], Oneconnect Financial[196.708%], Yatsen Holding[165.104%], Niu [132.759%], Masterbeef [128.049%], Tencent Music[120.848%], HUYA [104.307%] Best Asia Stocks This Week:
CNOOC [137266%], Nam Tai[5033.33%], Fang [4150%], Sinopec Shanghai[1992.58%], PetroChina [1137.09%], China [1104.2%], Internet Initiative[913.355%], China Life[690.958%], Leju [539.091%], Aluminum [516.255%], Global Cord[335.132%] Best Asia Stocks Daily:
Sony [194.565%], China SXT[15.1163%], HUTCHMED (China)[9.52963%], Regencell Bioscience[9.29368%], Perfect Corp[8.33333%], Jianpu [7.78054%], Baozun [6.95067%], JinkoSolar Holding[6.31356%], VNET [5.0494%], Bilibili [4.08998%], QuantaSing [3.9%]