
 Login Sign Up


| |||||
 |  | ||||

| 12Stocks.com Market Intelligence |
Best Tech Stocks
| In a hurry? Tech Stocks Lists: Performance & Trends, Stock Charts, FANG Stocks
Sort Tech stocks: Daily, Weekly, Year-to-Date, Market Cap & Trends. Filter Tech stocks list by size:All Tech Large Mid-Range Small and MicroCap |
| 12Stocks.com Tech Stocks Performances & Trends Daily | |||||||||
|
|  The overall Smart Investing & Trading Score is 38 (0-bearish to 100-bullish) which puts Technology sector in short term bearish to neutral trend. The Smart Investing & Trading Score from previous trading session is 45 and hence a deterioration of trend.
| ||||||||
Here are the Smart Investing & Trading Scores of the most requested Technology stocks at 12Stocks.com (click stock name for detailed review):
|


| 12Stocks.com: Investing in Technology sector with Stocks | |
|
The following table helps investors and traders sort through current performance and trends (as measured by Smart Investing & Trading Score) of various
stocks in the Tech sector. Quick View: Move mouse or cursor over stock symbol (ticker) to view short-term technical chart and over stock name to view long term chart. Click on  to add stock symbol to your watchlist and to add stock symbol to your watchlist and  to view watchlist. Click on any ticker or stock name for detailed market intelligence report for that stock. to view watchlist. Click on any ticker or stock name for detailed market intelligence report for that stock. |
12Stocks.com Performance of Stocks in Tech Sector
| Ticker | Stock Name | Watchlist | Category | Recent Price | Smart Investing & Trading Score | Change % | Weekly Change% |
| ESE | ESCO |   | Instruments | 104.28 | 76 | 0.00% | 3.33% |
| TIXT | TELUS | | Software - Infrastructure | 8.07 | 42 | -1.94% | 3.33% |
| AVDX | AvidXchange | | Software - Infrastructure | 11.83 | 58 | -1.66% | 3.32% |
| FORTY | Formula Systems | | IT | 74.60 | 54 | 0.00% | 3.31% |
| GFS | GLOBALFOUNDRIES | | Semiconductors | 47.79 | 32 | 1.96% | 3.31% |
| ZS | Zscaler | | Security Software | 174.82 | 15 | -1.49% | 3.30% |
| EXTR | Extreme Networks | | Communication | 11.33 | 42 | 1.61% | 3.28% |
| SLAB | Silicon | | Semiconductor | 118.93 | 0 | 4.09% | 3.25% |
| VOD | Vodafone | | Wireless | 8.61 | 65 | -0.58% | 3.24% |
| CDW | CDW | | IT | 243.42 | 58 | 1.13% | 3.24% |
| PLUS | ePlus | | Software | 77.78 | 83 | -1.58% | 3.20% |
| AMBA | Ambarella | | Semiconductor | 42.30 | 32 | -0.61% | 3.20% |
| CRTO | Criteo S.A | | Internet | 36.55 | 90 | -1.11% | 3.19% |
| ATHM | Autohome | | Internet | 25.05 | 39 | -0.71% | 3.17% |
| NET | Cloudflare | | Software | 86.76 | 36 | -1.05% | 3.16% |
| CRSR | Corsair Gaming | | Computer Hardware | 11.13 | 25 | 1.74% | 3.15% |
| YY | JOYY | | Internet | 33.23 | 73 | -0.45% | 3.10% |
| RSKD | Riskified | | Software - | 5.02 | 63 | -0.69% | 3.08% |
| BASE | Couchbase | | Software - Infrastructure | 23.60 | 25 | -2.16% | 3.06% |
| NTAP | NetApp | | Data Storage | 100.94 | 63 | 0.88% | 3.05% |
| SEMR | Semrush | | Software - | 11.85 | 66 | -3.42% | 3.04% |
| DOCU | DocuSign | | Software | 57.32 | 22 | 0.05% | 2.98% |
| AAPL | Apple | | Electronic | 169.89 | 50 | 0.51% | 2.96% |
| HOOD | Robinhood Markets | | Software - Infrastructure | 17.12 | 36 | -1.52% | 2.95% |
| MSGE | Madison Square | | Entertainment | 38.90 | 68 | -1.42% | 2.91% |
| For chart view version of above stock list: Chart View ➞ 0 - 25 , 25 - 50 , 50 - 75 , 75 - 100 , 100 - 125 , 125 - 150 , 150 - 175 , 175 - 200 , 200 - 225 , 225 - 250 , 250 - 275 , 275 - 300 , 300 - 325 , 325 - 350 , 350 - 375 , 375 - 400 , 400 - 425 , 425 - 450 , 450 - 475 , 475 - 500 , 500 - 525 , 525 - 550 , 550 - 575 , 575 - 600 , 600 - 625 , 625 - 650 | ||
 | Click To Change The Sort Order: By Market Cap or Company Size Performance: Year-to-date, Week and Day |  |
|
Get the most comprehensive stock market coverage daily at 12Stocks.com ➞ Best Stocks Today ➞ Best Stocks Weekly ➞ Best Stocks Year-to-Date ➞ Best Stocks Trends ➞  Best Stocks Today 12Stocks.com Best Nasdaq Stocks ➞ Best S&P 500 Stocks ➞ Best Tech Stocks ➞ Best Biotech Stocks ➞ |
| Detailed Overview of Tech Stocks |
| Tech Technical Overview, Leaders & Laggards, Top Tech ETF Funds & Detailed Tech Stocks List, Charts, Trends & More |
| Tech Sector: Technical Analysis, Trends & YTD Performance | |
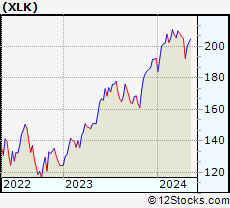
| Technology sector is composed of stocks
from semiconductors, software, web, social media
and services subsectors. Technology sector, as represented by XLK, an exchange-traded fund [ETF] that holds basket of tech stocks (e.g, Intel, Google) is up by 2.66% and is currently underperforming the overall market by -2.5% year-to-date. Below is a quick view of technical charts and trends: |
|
 XLK Weekly Chart |
|
| Long Term Trend: Not Good | |
| Medium Term Trend: Not Good | |
 XLK Daily Chart |
|
| Short Term Trend: Very Good | |
| Overall Trend Score: 38 | |
| YTD Performance: 2.66% | |
| **Trend Scores & Views Are Only For Educational Purposes And Not For Investing | |
| 12Stocks.com: Top Performing Technology Sector Stocks | ||||||||||||||||||||||||||||||||||||||||||||||||
 The top performing Technology sector stocks year to date are
Now, more recently, over last week, the top performing Technology sector stocks on the move are


|
||||||||||||||||||||||||||||||||||||||||||||||||
| 12Stocks.com: Investing in Tech Sector using Exchange Traded Funds | |
|
The following table shows list of key exchange traded funds (ETF) that
help investors track Tech Index. For detailed view, check out our ETF Funds section of our website. Quick View: Move mouse or cursor over ETF symbol (ticker) to view short-term technical chart and over ETF name to view long term chart. Click on ticker or stock name for detailed view. Click on to add stock symbol to your watchlist and to view watchlist. |
12Stocks.com List of ETFs that track Tech Index
| Ticker | ETF Name | Watchlist | Recent Price | Smart Investing & Trading Score | Change % | Week % | Year-to-date % |
| XLK | Technology | | 197.60 | 38 | -0.22 | 2.63 | 2.66% |
| QQQ | QQQ | | 424.45 | 51 | -0.48 | 2.36 | 3.65% |
| IYW | Technology | | 128.20 | 51 | -0.50 | 2.77 | 4.44% |
| VGT | Information Technology | | 495.44 | 38 | 0.04 | 3.24 | 2.36% |
| IXN | Global Tech | | 70.75 | 36 | -0.13 | 2.95 | 3.77% |
| IGV | Tech-Software | | 80.19 | 25 | -0.93 | 2.11 | -1.16% |
| XSD | Semiconductor | | 220.63 | 30 | 2.36 | 8.39 | -1.85% |
| TQQQ | QQQ | | 52.85 | 38 | -1.60 | 6.81 | 4.24% |
| SQQQ | Short QQQ | | 12.00 | 44 | 1.61 | -6.54 | -10.78% |
| SOXL | Semicondct Bull 3X | | 37.41 | 58 | 5.41 | 21.5 | 19.14% |
| SOXS | Semicondct Bear 3X | | 37.44 | 51 | -5.48 | -18.84 | 543.3% |
| SOXX | PHLX Semiconductor | | 212.41 | 51 | 1.86 | 7.07 | 10.61% |
| QTEC | First -100-Tech | | 181.18 | 51 | 0.02 | 4.16 | 3.25% |
| SMH | Semiconductor | | 212.20 | 63 | 2.00 | 6.52 | 21.35% |
| 12Stocks.com: Charts, Trends, Fundamental Data and Performances of Tech Stocks | |
|
We now take in-depth look at all Tech stocks including charts, multi-period performances and overall trends (as measured by Smart Investing & Trading Score). One can sort Tech stocks (click link to choose) by Daily, Weekly and by Year-to-Date performances. Also, one can sort by size of the company or by market capitalization. |
| Select Your Default Chart Type: | |||||
| |||||
| Click on stock symbol or name for detailed view. Click on to add stock symbol to your watchlist and to view watchlist. Quick View: Move mouse or cursor over "Daily" to quickly view daily technical stock chart and over "Weekly" to view weekly technical stock chart. | |||||


 | ESE ESCO Technologies Inc. |
| Sector: Technology | |
| SubSector: Scientific & Technical Instruments | |
| MarketCap: 1968.03 Millions | |
| Recent Price: 104.28 Smart Investing & Trading Score: 76 | |
| Day Percent Change: 0.00% Day Change: 0.00 | |
| Week Change: 3.33% Year-to-date Change: -10.9% | |
| ESE Links: Profile News Message Board | |
| Charts:- Daily , Weekly | |
| Add ESE to Watchlist: View: Get Complete ESE Trend Analysis ➞ | |
 | TIXT TELUS International (Cda) Inc. |
| Sector: Technology | |
| SubSector: Software - Infrastructure | |
| MarketCap: 1470 Millions | |
| Recent Price: 8.07 Smart Investing & Trading Score: 42 | |
| Day Percent Change: -1.94% Day Change: -0.16 | |
| Week Change: 3.33% Year-to-date Change: -5.6% | |
| TIXT Links: Profile News Message Board | |
| Charts:- Daily , Weekly | |
| Add TIXT to Watchlist: View: Get Complete TIXT Trend Analysis ➞ | |
 | AVDX AvidXchange Holdings, Inc. |
| Sector: Technology | |
| SubSector: Software - Infrastructure | |
| MarketCap: 2120 Millions | |
| Recent Price: 11.83 Smart Investing & Trading Score: 58 | |
| Day Percent Change: -1.66% Day Change: -0.20 | |
| Week Change: 3.32% Year-to-date Change: -4.7% | |
| AVDX Links: Profile News Message Board | |
| Charts:- Daily , Weekly | |
| Add AVDX to Watchlist: View: Get Complete AVDX Trend Analysis ➞ | |
 | FORTY Formula Systems (1985) Ltd. |
| Sector: Technology | |
| SubSector: Information Technology Services | |
| MarketCap: 735.768 Millions | |
| Recent Price: 74.60 Smart Investing & Trading Score: 54 | |
| Day Percent Change: 0.00% Day Change: 0.00 | |
| Week Change: 3.31% Year-to-date Change: 14.2% | |
| FORTY Links: Profile News Message Board | |
| Charts:- Daily , Weekly | |
| Add FORTY to Watchlist: View: Get Complete FORTY Trend Analysis ➞ | |
 | GFS GLOBALFOUNDRIES Inc. |
| Sector: Technology | |
| SubSector: Semiconductors | |
| MarketCap: 35570 Millions | |
| Recent Price: 47.79 Smart Investing & Trading Score: 32 | |
| Day Percent Change: 1.96% Day Change: 0.92 | |
| Week Change: 3.31% Year-to-date Change: -21.0% | |
| GFS Links: Profile News Message Board | |
| Charts:- Daily , Weekly | |
| Add GFS to Watchlist: View: Get Complete GFS Trend Analysis ➞ | |
 | ZS Zscaler, Inc. |
| Sector: Technology | |
| SubSector: Security Software & Services | |
| MarketCap: 7532.17 Millions | |
| Recent Price: 174.82 Smart Investing & Trading Score: 15 | |
| Day Percent Change: -1.49% Day Change: -2.65 | |
| Week Change: 3.3% Year-to-date Change: -21.1% | |
| ZS Links: Profile News Message Board | |
| Charts:- Daily , Weekly | |
| Add ZS to Watchlist: View: Get Complete ZS Trend Analysis ➞ | |
 | EXTR Extreme Networks, Inc. |
| Sector: Technology | |
| SubSector: Communication Equipment | |
| MarketCap: 339.939 Millions | |
| Recent Price: 11.33 Smart Investing & Trading Score: 42 | |
| Day Percent Change: 1.61% Day Change: 0.18 | |
| Week Change: 3.28% Year-to-date Change: -35.8% | |
| EXTR Links: Profile News Message Board | |
| Charts:- Daily , Weekly | |
| Add EXTR to Watchlist: View: Get Complete EXTR Trend Analysis ➞ | |
 | SLAB Silicon Laboratories Inc. |
| Sector: Technology | |
| SubSector: Semiconductor - Integrated Circuits | |
| MarketCap: 3710.2 Millions | |
| Recent Price: 118.93 Smart Investing & Trading Score: 0 | |
| Day Percent Change: 4.09% Day Change: 4.67 | |
| Week Change: 3.25% Year-to-date Change: -10.1% | |
| SLAB Links: Profile News Message Board | |
| Charts:- Daily , Weekly | |
| Add SLAB to Watchlist: View: Get Complete SLAB Trend Analysis ➞ | |
 | VOD Vodafone Group Plc |
| Sector: Technology | |
| SubSector: Wireless Communications | |
| MarketCap: 38154.7 Millions | |
| Recent Price: 8.61 Smart Investing & Trading Score: 65 | |
| Day Percent Change: -0.58% Day Change: -0.05 | |
| Week Change: 3.24% Year-to-date Change: -1.0% | |
| VOD Links: Profile News Message Board | |
| Charts:- Daily , Weekly | |
| Add VOD to Watchlist: View: Get Complete VOD Trend Analysis ➞ | |
 | CDW CDW Corporation |
| Sector: Technology | |
| SubSector: Information Technology Services | |
| MarketCap: 12775 Millions | |
| Recent Price: 243.42 Smart Investing & Trading Score: 58 | |
| Day Percent Change: 1.13% Day Change: 2.73 | |
| Week Change: 3.24% Year-to-date Change: 7.1% | |
| CDW Links: Profile News Message Board | |
| Charts:- Daily , Weekly | |
| Add CDW to Watchlist: View: Get Complete CDW Trend Analysis ➞ | |
 | PLUS ePlus inc. |
| Sector: Technology | |
| SubSector: Application Software | |
| MarketCap: 728.262 Millions | |
| Recent Price: 77.78 Smart Investing & Trading Score: 83 | |
| Day Percent Change: -1.58% Day Change: -1.25 | |
| Week Change: 3.2% Year-to-date Change: -2.6% | |
| PLUS Links: Profile News Message Board | |
| Charts:- Daily , Weekly | |
| Add PLUS to Watchlist: View: Get Complete PLUS Trend Analysis ➞ | |
 | AMBA Ambarella, Inc. |
| Sector: Technology | |
| SubSector: Semiconductor Equipment & Materials | |
| MarketCap: 1509.38 Millions | |
| Recent Price: 42.30 Smart Investing & Trading Score: 32 | |
| Day Percent Change: -0.61% Day Change: -0.26 | |
| Week Change: 3.2% Year-to-date Change: -31.0% | |
| AMBA Links: Profile News Message Board | |
| Charts:- Daily , Weekly | |
| Add AMBA to Watchlist: View: Get Complete AMBA Trend Analysis ➞ | |
 | CRTO Criteo S.A. |
| Sector: Technology | |
| SubSector: Internet Information Providers | |
| MarketCap: 515.78 Millions | |
| Recent Price: 36.55 Smart Investing & Trading Score: 90 | |
| Day Percent Change: -1.11% Day Change: -0.41 | |
| Week Change: 3.19% Year-to-date Change: 44.4% | |
| CRTO Links: Profile News Message Board | |
| Charts:- Daily , Weekly | |
| Add CRTO to Watchlist: View: Get Complete CRTO Trend Analysis ➞ | |
 | ATHM Autohome Inc. |
| Sector: Technology | |
| SubSector: Internet Information Providers | |
| MarketCap: 7984.2 Millions | |
| Recent Price: 25.05 Smart Investing & Trading Score: 39 | |
| Day Percent Change: -0.71% Day Change: -0.18 | |
| Week Change: 3.17% Year-to-date Change: -10.7% | |
| ATHM Links: Profile News Message Board | |
| Charts:- Daily , Weekly | |
| Add ATHM to Watchlist: View: Get Complete ATHM Trend Analysis ➞ | |
 | NET Cloudflare, Inc. |
| Sector: Technology | |
| SubSector: Application Software | |
| MarketCap: 7063.72 Millions | |
| Recent Price: 86.76 Smart Investing & Trading Score: 36 | |
| Day Percent Change: -1.05% Day Change: -0.92 | |
| Week Change: 3.16% Year-to-date Change: 4.2% | |
| NET Links: Profile News Message Board | |
| Charts:- Daily , Weekly | |
| Add NET to Watchlist: View: Get Complete NET Trend Analysis ➞ | |
 | CRSR Corsair Gaming, Inc. |
| Sector: Technology | |
| SubSector: Computer Hardware | |
| MarketCap: 32187 Millions | |
| Recent Price: 11.13 Smart Investing & Trading Score: 25 | |
| Day Percent Change: 1.74% Day Change: 0.19 | |
| Week Change: 3.15% Year-to-date Change: -21.1% | |
| CRSR Links: Profile News Message Board | |
| Charts:- Daily , Weekly | |
| Add CRSR to Watchlist: View: Get Complete CRSR Trend Analysis ➞ | |
 | YY JOYY Inc. |
| Sector: Technology | |
| SubSector: Internet Information Providers | |
| MarketCap: 3527.6 Millions | |
| Recent Price: 33.23 Smart Investing & Trading Score: 73 | |
| Day Percent Change: -0.45% Day Change: -0.15 | |
| Week Change: 3.1% Year-to-date Change: -16.3% | |
| YY Links: Profile News Message Board | |
| Charts:- Daily , Weekly | |
| Add YY to Watchlist: View: Get Complete YY Trend Analysis ➞ | |
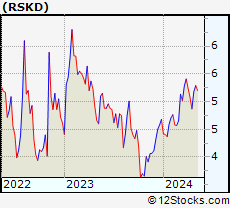 | RSKD Riskified Ltd. |
| Sector: Technology | |
| SubSector: Software - Application | |
| MarketCap: 819 Millions | |
| Recent Price: 5.02 Smart Investing & Trading Score: 63 | |
| Day Percent Change: -0.69% Day Change: -0.04 | |
| Week Change: 3.08% Year-to-date Change: 7.3% | |
| RSKD Links: Profile News Message Board | |
| Charts:- Daily , Weekly | |
| Add RSKD to Watchlist: View: Get Complete RSKD Trend Analysis ➞ | |
 | BASE Couchbase, Inc. |
| Sector: Technology | |
| SubSector: Software - Infrastructure | |
| MarketCap: 724 Millions | |
| Recent Price: 23.60 Smart Investing & Trading Score: 25 | |
| Day Percent Change: -2.16% Day Change: -0.52 | |
| Week Change: 3.06% Year-to-date Change: 3.6% | |
| BASE Links: Profile News Message Board | |
| Charts:- Daily , Weekly | |
| Add BASE to Watchlist: View: Get Complete BASE Trend Analysis ➞ | |
 | NTAP NetApp, Inc. |
| Sector: Technology | |
| SubSector: Data Storage Devices | |
| MarketCap: 9028.89 Millions | |
| Recent Price: 100.94 Smart Investing & Trading Score: 63 | |
| Day Percent Change: 0.88% Day Change: 0.88 | |
| Week Change: 3.05% Year-to-date Change: 14.5% | |
| NTAP Links: Profile News Message Board | |
| Charts:- Daily , Weekly | |
| Add NTAP to Watchlist: View: Get Complete NTAP Trend Analysis ➞ | |
 | SEMR Semrush Holdings, Inc. |
| Sector: Technology | |
| SubSector: Software - Application | |
| MarketCap: 1330 Millions | |
| Recent Price: 11.85 Smart Investing & Trading Score: 66 | |
| Day Percent Change: -3.42% Day Change: -0.42 | |
| Week Change: 3.04% Year-to-date Change: -14.7% | |
| SEMR Links: Profile News Message Board | |
| Charts:- Daily , Weekly | |
| Add SEMR to Watchlist: View: Get Complete SEMR Trend Analysis ➞ | |
 | DOCU DocuSign, Inc. |
| Sector: Technology | |
| SubSector: Business Software & Services | |
| MarketCap: 15618.8 Millions | |
| Recent Price: 57.32 Smart Investing & Trading Score: 22 | |
| Day Percent Change: 0.05% Day Change: 0.03 | |
| Week Change: 2.98% Year-to-date Change: -3.6% | |
| DOCU Links: Profile News Message Board | |
| Charts:- Daily , Weekly | |
| Add DOCU to Watchlist: View: Get Complete DOCU Trend Analysis ➞ | |
 | AAPL Apple Inc. |
| Sector: Technology | |
| SubSector: Electronic Equipment | |
| MarketCap: 1112940 Millions | |
| Recent Price: 169.89 Smart Investing & Trading Score: 50 | |
| Day Percent Change: 0.51% Day Change: 0.87 | |
| Week Change: 2.96% Year-to-date Change: -11.8% | |
| AAPL Links: Profile News Message Board | |
| Charts:- Daily , Weekly | |
| Add AAPL to Watchlist: View: Get Complete AAPL Trend Analysis ➞ | |
 | HOOD Robinhood Markets, Inc. |
| Sector: Technology | |
| SubSector: Software - Infrastructure | |
| MarketCap: 9200 Millions | |
| Recent Price: 17.12 Smart Investing & Trading Score: 36 | |
| Day Percent Change: -1.52% Day Change: -0.27 | |
| Week Change: 2.95% Year-to-date Change: 35.0% | |
| HOOD Links: Profile News Message Board | |
| Charts:- Daily , Weekly | |
| Add HOOD to Watchlist: View: Get Complete HOOD Trend Analysis ➞ | |
 | MSGE Madison Square Garden Entertainment Corp. |
| Sector: Technology | |
| SubSector: Entertainment | |
| MarketCap: 18837 Millions | |
| Recent Price: 38.90 Smart Investing & Trading Score: 68 | |
| Day Percent Change: -1.42% Day Change: -0.56 | |
| Week Change: 2.91% Year-to-date Change: 22.3% | |
| MSGE Links: Profile News Message Board | |
| Charts:- Daily , Weekly | |
| Add MSGE to Watchlist: View: Get Complete MSGE Trend Analysis ➞ | |
| For tabular summary view of above stock list: Summary View ➞ 0 - 25 , 25 - 50 , 50 - 75 , 75 - 100 , 100 - 125 , 125 - 150 , 150 - 175 , 175 - 200 , 200 - 225 , 225 - 250 , 250 - 275 , 275 - 300 , 300 - 325 , 325 - 350 , 350 - 375 , 375 - 400 , 400 - 425 , 425 - 450 , 450 - 475 , 475 - 500 , 500 - 525 , 525 - 550 , 550 - 575 , 575 - 600 , 600 - 625 , 625 - 650 | ||
| Click To Change The Sort Order: By Market Cap or Company Size Performance: Year-to-date, Week and Day | |
| Select Chart Type: | ||
|
Best Stocks Today 12Stocks.com |
© 2024 12Stocks.com Terms & Conditions Privacy Contact Us
All Information Provided Only For Education And Not To Be Used For Investing or Trading. See Terms & Conditions


One More Thing ... Get Best Stocks Delivered Daily!
Never Ever Miss A Move With Our Top Ten Stocks Lists
Find Best Stocks In Any Market - Bull or Bear Market
Take A Peek At Our Top Ten Stocks Lists: Daily, Weekly, Year-to-Date & Top Trends
Find Best Stocks In Any Market - Bull or Bear Market
Take A Peek At Our Top Ten Stocks Lists: Daily, Weekly, Year-to-Date & Top Trends
Technology Stocks With Best Up Trends [0-bearish to 100-bullish]: HashiCorp [100], Teradyne [100], Karooooo [100], Cricut [100], Grab [100], Microchip [100], Sanmina [100], JD.com [100], EchoStar [100], Analog Devices[100], Allegro MicroSystems[100]
Best Technology Stocks Year-to-Date:
MediaCo Holding[390.61%], Super Micro[177%], Uxin [172.47%], Smith Micro[168.77%], CXApp [166.41%], CuriosityStream [103.67%], GigaCloud [97.54%], MicroStrategy [96.39%], SoundHound AI[94.39%], Cheetah Mobile[88.16%], NextNav [85.73%] Best Technology Stocks This Week:
Matterport [168.97%], Amesite [58.44%], HashiCorp [36.92%], Impinj [33.73%], WiMi Hologram[33.51%], Ribbon [25.58%], Cheetah Mobile[21.19%], on [20.61%], iQIYI [17.99%], SoundHound AI[17.18%], IonQ [15.37%] Best Technology Stocks Daily:
Impinj [28.65%], HashiCorp [10.69%], Tyler [9.32%], SiTime [8.84%], Cheetah Mobile[8.33%], on [8.21%], Teradyne [8.15%], Karooooo [7.84%], Viomi [7.13%], Comtech Tele[6.86%], CACI [5.93%]