
 Login Sign Up


| |||||
 |  | ||||

| 12Stocks.com Market Intelligence |
Best Tech Stocks
| In a hurry? Tech Stocks Lists: Performance & Trends, Stock Charts, FANG Stocks
Sort Tech stocks: Daily, Weekly, Year-to-Date, Market Cap & Trends. Filter Tech stocks list by size:All Tech Large Mid-Range Small and MicroCap |
| 12Stocks.com Tech Stocks Performances & Trends Daily | |||||||||
|
|  The overall Smart Investing & Trading Score is 13 (0-bearish to 100-bullish) which puts Technology sector in short term bearish trend. The Smart Investing & Trading Score from previous trading session is 26 and hence a deterioration of trend.
| ||||||||
Here are the Smart Investing & Trading Scores of the most requested Technology stocks at 12Stocks.com (click stock name for detailed review):
|


| 12Stocks.com: Investing in Technology sector with Stocks | |
|
The following table helps investors and traders sort through current performance and trends (as measured by Smart Investing & Trading Score) of various
stocks in the Tech sector. Quick View: Move mouse or cursor over stock symbol (ticker) to view short-term technical chart and over stock name to view long term chart. Click on  to add stock symbol to your watchlist and to add stock symbol to your watchlist and  to view watchlist. Click on any ticker or stock name for detailed market intelligence report for that stock. to view watchlist. Click on any ticker or stock name for detailed market intelligence report for that stock. |
12Stocks.com Performance of Stocks in Tech Sector
| Ticker | Stock Name | Watchlist | Category | Recent Price | Smart Investing & Trading Score | Change % | Weekly Change% |
| GRVY | Gravity Co |   | Software | 66.50 | 26 | -0.33% | -2.39% |
| CCCS | CCC Intelligent | | Software - Infrastructure | 11.43 | 33 | -0.95% | -2.39% |
| PEGA | Pegasystems | | Software | 58.94 | 43 | 0.37% | -2.40% |
| ASX | ASE | | Semiconductor | 10.59 | 38 | -1.49% | -2.40% |
| NTES | NetEase | | Internet | 89.94 | 10 | -0.53% | -2.40% |
| MEI | Methode Electronics | | Electronics | 12.22 | 42 | -0.16% | -2.40% |
| KT | KT | | Telecom | 12.12 | 10 | -1.54% | -2.42% |
| DGII | Digi | | Communication | 30.16 | 43 | -0.53% | -2.43% |
| VSH | Vishay Inter | | Semiconductor | 21.09 | 0 | -1.13% | -2.45% |
| ACMR | ACM Research | | Semiconductor | 27.91 | 31 | -3.22% | -2.45% |
| TSM | Taiwan Semiconductor | | Semiconductor | 139.03 | 58 | -0.55% | -2.45% |
| LBTYA | Liberty Global | | CATV | 16.25 | 0 | -0.49% | -2.46% |
| CTSH | Cognizant | | IT | 67.54 | 0 | -0.57% | -2.48% |
| PDFS | | Software | 31.28 | 30 | -2.04% | -2.49% | |
| AVDX | AvidXchange | | Software - Infrastructure | 11.35 | 43 | 0.18% | -2.49% |
| VIV | Telefonica Brasil | | Wireless | 9.32 | 10 | 0.22% | -2.51% |
| DXC | DXC | | IT | 19.79 | 0 | -0.95% | -2.51% |
| CDW | CDW | | IT | 236.78 | 26 | -1.35% | -2.52% |
| WDAY | Workday | | Software | 257.02 | 7 | -0.26% | -2.53% |
| TYL | Tyler | | Software | 402.84 | 17 | 0.91% | -2.54% |
| BOX | Box | | Software | 26.25 | 53 | -0.19% | -2.56% |
| ANSS | ANSYS | | Software | 325.62 | 13 | -0.36% | -2.57% |
| RCM | R1 RCM | | Healthcare Information | 12.15 | 53 | -0.49% | -2.57% |
| CGNX | Cognex | | Instruments | 39.21 | 36 | -1.03% | -2.58% |
| OTEX | Open Text | | Software | 34.60 | 17 | 0.38% | -2.59% |
| For chart view version of above stock list: Chart View ➞ 0 - 25 , 25 - 50 , 50 - 75 , 75 - 100 , 100 - 125 , 125 - 150 , 150 - 175 , 175 - 200 , 200 - 225 , 225 - 250 , 250 - 275 , 275 - 300 , 300 - 325 , 325 - 350 , 350 - 375 , 375 - 400 , 400 - 425 , 425 - 450 , 450 - 475 , 475 - 500 , 500 - 525 , 525 - 550 , 550 - 575 , 575 - 600 , 600 - 625 , 625 - 650 | ||
 | Click To Change The Sort Order: By Market Cap or Company Size Performance: Year-to-date, Week and Day |  |
|
Get the most comprehensive stock market coverage daily at 12Stocks.com ➞ Best Stocks Today ➞ Best Stocks Weekly ➞ Best Stocks Year-to-Date ➞ Best Stocks Trends ➞  Best Stocks Today 12Stocks.com Best Nasdaq Stocks ➞ Best S&P 500 Stocks ➞ Best Tech Stocks ➞ Best Biotech Stocks ➞ |
| Detailed Overview of Tech Stocks |
| Tech Technical Overview, Leaders & Laggards, Top Tech ETF Funds & Detailed Tech Stocks List, Charts, Trends & More |
| Tech Sector: Technical Analysis, Trends & YTD Performance | |
| Technology sector is composed of stocks
from semiconductors, software, web, social media
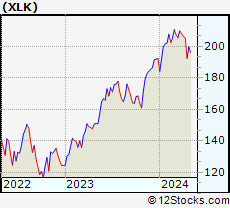
and services subsectors. Technology sector, as represented by XLK, an exchange-traded fund [ETF] that holds basket of tech stocks (e.g, Intel, Google) is up by 3.31% and is currently underperforming the overall market by -1.1% year-to-date. Below is a quick view of technical charts and trends: |
|
 XLK Weekly Chart |
|
| Long Term Trend: Good | |
| Medium Term Trend: Not Good | |
 XLK Daily Chart |
|
| Short Term Trend: Not Good | |
| Overall Trend Score: 13 | |
| YTD Performance: 3.31% | |
| **Trend Scores & Views Are Only For Educational Purposes And Not For Investing | |
| 12Stocks.com: Top Performing Technology Sector Stocks | ||||||||||||||||||||||||||||||||||||||||||||||||
 The top performing Technology sector stocks year to date are
Now, more recently, over last week, the top performing Technology sector stocks on the move are


|
||||||||||||||||||||||||||||||||||||||||||||||||
| 12Stocks.com: Investing in Tech Sector using Exchange Traded Funds | |
|
The following table shows list of key exchange traded funds (ETF) that
help investors track Tech Index. For detailed view, check out our ETF Funds section of our website. Quick View: Move mouse or cursor over ETF symbol (ticker) to view short-term technical chart and over ETF name to view long term chart. Click on ticker or stock name for detailed view. Click on to add stock symbol to your watchlist and to view watchlist. |
12Stocks.com List of ETFs that track Tech Index
| Ticker | ETF Name | Watchlist | Recent Price | Smart Investing & Trading Score | Change % | Week % | Year-to-date % |
| XLK | Technology | | 198.85 | 13 | -1.44 | -3.2 | 3.31% |
| QQQ | QQQ | | 425.84 | 26 | -1.31 | -2.84 | 3.99% |
| IYW | Technology | | 129.34 | 26 | -1.55 | -3.44 | 5.37% |
| VGT | Information Technology | | 497.69 | 13 | -1.48 | -3.3 | 2.83% |
| IXN | Global Tech | | 71.31 | 26 | -1.75 | -3.37 | 4.59% |
| IGV | Tech-Software | | 80.06 | 0 | -0.79 | -3.26 | -1.32% |
| XSD | Semiconductor | | 214.44 | 26 | -2.18 | -3.91 | -4.6% |
| TQQQ | QQQ | | 53.71 | 26 | -3.71 | -8.53 | 5.94% |
| SQQQ | Short QQQ | | 11.86 | 69 | 3.67 | 8.91 | -11.82% |
| SOXL | Semicondct Bull 3X | | 37.06 | 26 | -8.58 | -10.72 | 18.03% |
| SOXS | Semicondct Bear 3X | | 39.15 | 90 | 8.18 | 1012.22 | 572.68% |
| SOXX | PHLX Semiconductor | | 210.36 | 26 | -2.77 | -3.54 | 9.54% |
| QTEC | First -100-Tech | | 179.73 | 13 | -1.93 | -3.38 | 2.43% |
| SMH | Semiconductor | | 212.40 | 31 | -3.08 | -3.75 | 21.46% |
| 12Stocks.com: Charts, Trends, Fundamental Data and Performances of Tech Stocks | |
|
We now take in-depth look at all Tech stocks including charts, multi-period performances and overall trends (as measured by Smart Investing & Trading Score). One can sort Tech stocks (click link to choose) by Daily, Weekly and by Year-to-Date performances. Also, one can sort by size of the company or by market capitalization. |
| Select Your Default Chart Type: | |||||
| |||||
| Click on stock symbol or name for detailed view. Click on to add stock symbol to your watchlist and to view watchlist. Quick View: Move mouse or cursor over "Daily" to quickly view daily technical stock chart and over "Weekly" to view weekly technical stock chart. | |||||


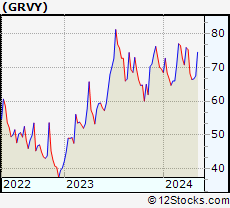 | GRVY Gravity Co., Ltd. |
| Sector: Technology | |
| SubSector: Multimedia & Graphics Software | |
| MarketCap: 167.586 Millions | |
| Recent Price: 66.50 Smart Investing & Trading Score: 26 | |
| Day Percent Change: -0.33% Day Change: -0.22 | |
| Week Change: -2.39% Year-to-date Change: -4.4% | |
| GRVY Links: Profile News Message Board | |
| Charts:- Daily , Weekly | |
| Add GRVY to Watchlist: View: Get Complete GRVY Trend Analysis ➞ | |
 | CCCS CCC Intelligent Solutions Holdings Inc. |
| Sector: Technology | |
| SubSector: Software - Infrastructure | |
| MarketCap: 6990 Millions | |
| Recent Price: 11.43 Smart Investing & Trading Score: 33 | |
| Day Percent Change: -0.95% Day Change: -0.11 | |
| Week Change: -2.39% Year-to-date Change: 0.8% | |
| CCCS Links: Profile News Message Board | |
| Charts:- Daily , Weekly | |
| Add CCCS to Watchlist: View: Get Complete CCCS Trend Analysis ➞ | |
 | PEGA Pegasystems Inc. |
| Sector: Technology | |
| SubSector: Business Software & Services | |
| MarketCap: 5924.88 Millions | |
| Recent Price: 58.94 Smart Investing & Trading Score: 43 | |
| Day Percent Change: 0.37% Day Change: 0.22 | |
| Week Change: -2.4% Year-to-date Change: 20.6% | |
| PEGA Links: Profile News Message Board | |
| Charts:- Daily , Weekly | |
| Add PEGA to Watchlist: View: Get Complete PEGA Trend Analysis ➞ | |
 | ASX ASE Technology Holding Co., Ltd. |
| Sector: Technology | |
| SubSector: Semiconductor Equipment & Materials | |
| MarketCap: 8513.18 Millions | |
| Recent Price: 10.59 Smart Investing & Trading Score: 38 | |
| Day Percent Change: -1.49% Day Change: -0.16 | |
| Week Change: -2.4% Year-to-date Change: 12.5% | |
| ASX Links: Profile News Message Board | |
| Charts:- Daily , Weekly | |
| Add ASX to Watchlist: View: Get Complete ASX Trend Analysis ➞ | |
 | NTES NetEase, Inc. |
| Sector: Technology | |
| SubSector: Internet Software & Services | |
| MarketCap: 40105.1 Millions | |
| Recent Price: 89.94 Smart Investing & Trading Score: 10 | |
| Day Percent Change: -0.53% Day Change: -0.48 | |
| Week Change: -2.4% Year-to-date Change: -3.5% | |
| NTES Links: Profile News Message Board | |
| Charts:- Daily , Weekly | |
| Add NTES to Watchlist: View: Get Complete NTES Trend Analysis ➞ | |
 | MEI Methode Electronics, Inc. |
| Sector: Technology | |
| SubSector: Diversified Electronics | |
| MarketCap: 941.896 Millions | |
| Recent Price: 12.22 Smart Investing & Trading Score: 42 | |
| Day Percent Change: -0.16% Day Change: -0.02 | |
| Week Change: -2.4% Year-to-date Change: -46.2% | |
| MEI Links: Profile News Message Board | |
| Charts:- Daily , Weekly | |
| Add MEI to Watchlist: View: Get Complete MEI Trend Analysis ➞ | |
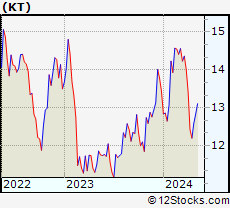 | KT KT Corporation |
| Sector: Technology | |
| SubSector: Telecom Services - Foreign | |
| MarketCap: 4216.89 Millions | |
| Recent Price: 12.12 Smart Investing & Trading Score: 10 | |
| Day Percent Change: -1.54% Day Change: -0.19 | |
| Week Change: -2.42% Year-to-date Change: -9.8% | |
| KT Links: Profile News Message Board | |
| Charts:- Daily , Weekly | |
| Add KT to Watchlist: View: Get Complete KT Trend Analysis ➞ | |
 | DGII Digi International Inc. |
| Sector: Technology | |
| SubSector: Communication Equipment | |
| MarketCap: 257.339 Millions | |
| Recent Price: 30.16 Smart Investing & Trading Score: 43 | |
| Day Percent Change: -0.53% Day Change: -0.16 | |
| Week Change: -2.43% Year-to-date Change: 16.0% | |
| DGII Links: Profile News Message Board | |
| Charts:- Daily , Weekly | |
| Add DGII to Watchlist: View: Get Complete DGII Trend Analysis ➞ | |
 | VSH Vishay Intertechnology, Inc. |
| Sector: Technology | |
| SubSector: Semiconductor - Broad Line | |
| MarketCap: 2132.52 Millions | |
| Recent Price: 21.09 Smart Investing & Trading Score: 0 | |
| Day Percent Change: -1.13% Day Change: -0.24 | |
| Week Change: -2.45% Year-to-date Change: -12.0% | |
| VSH Links: Profile News Message Board | |
| Charts:- Daily , Weekly | |
| Add VSH to Watchlist: View: Get Complete VSH Trend Analysis ➞ | |
 | ACMR ACM Research, Inc. |
| Sector: Technology | |
| SubSector: Semiconductor Equipment & Materials | |
| MarketCap: 438.718 Millions | |
| Recent Price: 27.91 Smart Investing & Trading Score: 31 | |
| Day Percent Change: -3.22% Day Change: -0.93 | |
| Week Change: -2.45% Year-to-date Change: 42.8% | |
| ACMR Links: Profile News Message Board | |
| Charts:- Daily , Weekly | |
| Add ACMR to Watchlist: View: Get Complete ACMR Trend Analysis ➞ | |
 | TSM Taiwan Semiconductor Manufacturing Company Limited |
| Sector: Technology | |
| SubSector: Semiconductor - Integrated Circuits | |
| MarketCap: 239384 Millions | |
| Recent Price: 139.03 Smart Investing & Trading Score: 58 | |
| Day Percent Change: -0.55% Day Change: -0.77 | |
| Week Change: -2.45% Year-to-date Change: 33.7% | |
| TSM Links: Profile News Message Board | |
| Charts:- Daily , Weekly | |
| Add TSM to Watchlist: View: Get Complete TSM Trend Analysis ➞ | |
 | LBTYA Liberty Global plc |
| Sector: Technology | |
| SubSector: CATV Systems | |
| MarketCap: 11723.7 Millions | |
| Recent Price: 16.25 Smart Investing & Trading Score: 0 | |
| Day Percent Change: -0.49% Day Change: -0.08 | |
| Week Change: -2.46% Year-to-date Change: -8.6% | |
| LBTYA Links: Profile News Message Board | |
| Charts:- Daily , Weekly | |
| Add LBTYA to Watchlist: View: Get Complete LBTYA Trend Analysis ➞ | |
 | CTSH Cognizant Technology Solutions Corporation |
| Sector: Technology | |
| SubSector: Information Technology Services | |
| MarketCap: 26249.7 Millions | |
| Recent Price: 67.54 Smart Investing & Trading Score: 0 | |
| Day Percent Change: -0.57% Day Change: -0.39 | |
| Week Change: -2.48% Year-to-date Change: -10.6% | |
| CTSH Links: Profile News Message Board | |
| Charts:- Daily , Weekly | |
| Add CTSH to Watchlist: View: Get Complete CTSH Trend Analysis ➞ | |
 | PDFS PDF Solutions, Inc. |
| Sector: Technology | |
| SubSector: Technical & System Software | |
| MarketCap: 345.1 Millions | |
| Recent Price: 31.28 Smart Investing & Trading Score: 30 | |
| Day Percent Change: -2.04% Day Change: -0.65 | |
| Week Change: -2.49% Year-to-date Change: -2.7% | |
| PDFS Links: Profile News Message Board | |
| Charts:- Daily , Weekly | |
| Add PDFS to Watchlist: View: Get Complete PDFS Trend Analysis ➞ | |
 | AVDX AvidXchange Holdings, Inc. |
| Sector: Technology | |
| SubSector: Software - Infrastructure | |
| MarketCap: 2120 Millions | |
| Recent Price: 11.35 Smart Investing & Trading Score: 43 | |
| Day Percent Change: 0.18% Day Change: 0.02 | |
| Week Change: -2.49% Year-to-date Change: -8.6% | |
| AVDX Links: Profile News Message Board | |
| Charts:- Daily , Weekly | |
| Add AVDX to Watchlist: View: Get Complete AVDX Trend Analysis ➞ | |
 | VIV Telefonica Brasil S.A. |
| Sector: Technology | |
| SubSector: Wireless Communications | |
| MarketCap: 19611.1 Millions | |
| Recent Price: 9.32 Smart Investing & Trading Score: 10 | |
| Day Percent Change: 0.22% Day Change: 0.02 | |
| Week Change: -2.51% Year-to-date Change: -14.8% | |
| VIV Links: Profile News Message Board | |
| Charts:- Daily , Weekly | |
| Add VIV to Watchlist: View: Get Complete VIV Trend Analysis ➞ | |
 | DXC DXC Technology Company |
| Sector: Technology | |
| SubSector: Information Technology Services | |
| MarketCap: 3622.28 Millions | |
| Recent Price: 19.79 Smart Investing & Trading Score: 0 | |
| Day Percent Change: -0.95% Day Change: -0.19 | |
| Week Change: -2.51% Year-to-date Change: -13.5% | |
| DXC Links: Profile News Message Board | |
| Charts:- Daily , Weekly | |
| Add DXC to Watchlist: View: Get Complete DXC Trend Analysis ➞ | |
 | CDW CDW Corporation |
| Sector: Technology | |
| SubSector: Information Technology Services | |
| MarketCap: 12775 Millions | |
| Recent Price: 236.78 Smart Investing & Trading Score: 26 | |
| Day Percent Change: -1.35% Day Change: -3.23 | |
| Week Change: -2.52% Year-to-date Change: 4.2% | |
| CDW Links: Profile News Message Board | |
| Charts:- Daily , Weekly | |
| Add CDW to Watchlist: View: Get Complete CDW Trend Analysis ➞ | |
 | WDAY Workday, Inc. |
| Sector: Technology | |
| SubSector: Application Software | |
| MarketCap: 31372.1 Millions | |
| Recent Price: 257.02 Smart Investing & Trading Score: 7 | |
| Day Percent Change: -0.26% Day Change: -0.67 | |
| Week Change: -2.53% Year-to-date Change: -6.9% | |
| WDAY Links: Profile News Message Board | |
| Charts:- Daily , Weekly | |
| Add WDAY to Watchlist: View: Get Complete WDAY Trend Analysis ➞ | |
 | TYL Tyler Technologies, Inc. |
| Sector: Technology | |
| SubSector: Technical & System Software | |
| MarketCap: 10785 Millions | |
| Recent Price: 402.84 Smart Investing & Trading Score: 17 | |
| Day Percent Change: 0.91% Day Change: 3.62 | |
| Week Change: -2.54% Year-to-date Change: -3.7% | |
| TYL Links: Profile News Message Board | |
| Charts:- Daily , Weekly | |
| Add TYL to Watchlist: View: Get Complete TYL Trend Analysis ➞ | |
 | BOX Box, Inc. |
| Sector: Technology | |
| SubSector: Application Software | |
| MarketCap: 2154.42 Millions | |
| Recent Price: 26.25 Smart Investing & Trading Score: 53 | |
| Day Percent Change: -0.19% Day Change: -0.05 | |
| Week Change: -2.56% Year-to-date Change: 2.5% | |
| BOX Links: Profile News Message Board | |
| Charts:- Daily , Weekly | |
| Add BOX to Watchlist: View: Get Complete BOX Trend Analysis ➞ | |
 | ANSS ANSYS, Inc. |
| Sector: Technology | |
| SubSector: Application Software | |
| MarketCap: 19497.4 Millions | |
| Recent Price: 325.62 Smart Investing & Trading Score: 13 | |
| Day Percent Change: -0.36% Day Change: -1.19 | |
| Week Change: -2.57% Year-to-date Change: -10.3% | |
| ANSS Links: Profile News Message Board | |
| Charts:- Daily , Weekly | |
| Add ANSS to Watchlist: View: Get Complete ANSS Trend Analysis ➞ | |
 | RCM R1 RCM Inc. |
| Sector: Technology | |
| SubSector: Healthcare Information Services | |
| MarketCap: 1082.15 Millions | |
| Recent Price: 12.15 Smart Investing & Trading Score: 53 | |
| Day Percent Change: -0.49% Day Change: -0.06 | |
| Week Change: -2.57% Year-to-date Change: 15.0% | |
| RCM Links: Profile News Message Board | |
| Charts:- Daily , Weekly | |
| Add RCM to Watchlist: View: Get Complete RCM Trend Analysis ➞ | |
 | CGNX Cognex Corporation |
| Sector: Technology | |
| SubSector: Scientific & Technical Instruments | |
| MarketCap: 7373.13 Millions | |
| Recent Price: 39.21 Smart Investing & Trading Score: 36 | |
| Day Percent Change: -1.03% Day Change: -0.41 | |
| Week Change: -2.58% Year-to-date Change: -6.1% | |
| CGNX Links: Profile News Message Board | |
| Charts:- Daily , Weekly | |
| Add CGNX to Watchlist: View: Get Complete CGNX Trend Analysis ➞ | |
 | OTEX Open Text Corporation |
| Sector: Technology | |
| SubSector: Application Software | |
| MarketCap: 9291.92 Millions | |
| Recent Price: 34.60 Smart Investing & Trading Score: 17 | |
| Day Percent Change: 0.38% Day Change: 0.13 | |
| Week Change: -2.59% Year-to-date Change: -17.7% | |
| OTEX Links: Profile News Message Board | |
| Charts:- Daily , Weekly | |
| Add OTEX to Watchlist: View: Get Complete OTEX Trend Analysis ➞ | |
| For tabular summary view of above stock list: Summary View ➞ 0 - 25 , 25 - 50 , 50 - 75 , 75 - 100 , 100 - 125 , 125 - 150 , 150 - 175 , 175 - 200 , 200 - 225 , 225 - 250 , 250 - 275 , 275 - 300 , 300 - 325 , 325 - 350 , 350 - 375 , 375 - 400 , 400 - 425 , 425 - 450 , 450 - 475 , 475 - 500 , 500 - 525 , 525 - 550 , 550 - 575 , 575 - 600 , 600 - 625 , 625 - 650 | ||
| Click To Change The Sort Order: By Market Cap or Company Size Performance: Year-to-date, Week and Day | |
| Select Chart Type: | ||
|
Best Stocks Today 12Stocks.com |
© 2024 12Stocks.com Terms & Conditions Privacy Contact Us
All Information Provided Only For Education And Not To Be Used For Investing or Trading. See Terms & Conditions


One More Thing ... Get Best Stocks Delivered Daily!
Never Ever Miss A Move With Our Top Ten Stocks Lists
Find Best Stocks In Any Market - Bull or Bear Market
Take A Peek At Our Top Ten Stocks Lists: Daily, Weekly, Year-to-Date & Top Trends
Find Best Stocks In Any Market - Bull or Bear Market
Take A Peek At Our Top Ten Stocks Lists: Daily, Weekly, Year-to-Date & Top Trends
Technology Stocks With Best Up Trends [0-bearish to 100-bullish]: Zuora [100], GigaCloud [100], Inspire Medical[93], Allegro MicroSystems[93], Snap One[93], Encore Wire[93], NextNav [90], SYNNEX [88], Turkcell Iletisim[83], Model N[83], Benchmark Electronics[83]
Best Technology Stocks Year-to-Date:
MicroCloud Hologram[541.73%], MediaCo Holding[538.5%], Super Micro[237.75%], CXApp [223.55%], Smith Micro[136.08%], Uxin [133.95%], CuriosityStream [92.56%], GigaCloud [90.77%], D-Wave Quantum[90.34%], MicroStrategy [88.1%], SoundHound AI[85.28%] Best Technology Stocks This Week:
Snap One[29.85%], Mynaric AG[11.76%], Encore Wire[10.06%], Zuora [10%], Super Micro[6.85%], Applied Optoelectronics[6.68%], Luna Innovations[6.15%], NextNav [5.13%], Inspire Medical[5.08%], Sea [4.41%], Momo [4.15%] Best Technology Stocks Daily:
Zuora [11.69%], Inspire Medical[9.87%], MediaCo Holding[8.80%], Maxeon Solar[7.67%], CXApp [7.16%], FiscalNote [7.02%], Sunrun [4.99%], Snap [4.71%], Luna Innovations[4.55%], Cango [4.41%], Digital Turbine[4.20%]