
 Login Sign Up


| |||||
 |  | ||||

| 12Stocks.com Market Intelligence |
Best Tech Stocks
| In a hurry? Tech Stocks Lists: Performance & Trends, Stock Charts, FANG Stocks
Sort Tech stocks: Daily, Weekly, Year-to-Date, Market Cap & Trends. Filter Tech stocks list by size:All Tech Large Mid-Range Small and MicroCap |
| 12Stocks.com Tech Stocks Performances & Trends Daily | |||||||||
|
|  The overall Smart Investing & Trading Score is 10 (0-bearish to 100-bullish) which puts Technology sector in short term bearish trend. The Smart Investing & Trading Score from previous trading session is 0 and hence an improvement of trend.
| ||||||||
Here are the Smart Investing & Trading Scores of the most requested Technology stocks at 12Stocks.com (click stock name for detailed review):
|


| 12Stocks.com: Investing in Technology sector with Stocks | |
|
The following table helps investors and traders sort through current performance and trends (as measured by Smart Investing & Trading Score) of various
stocks in the Tech sector. Quick View: Move mouse or cursor over stock symbol (ticker) to view short-term technical chart and over stock name to view long term chart. Click on  to add stock symbol to your watchlist and to add stock symbol to your watchlist and  to view watchlist. Click on any ticker or stock name for detailed market intelligence report for that stock. to view watchlist. Click on any ticker or stock name for detailed market intelligence report for that stock. |
12Stocks.com Performance of Stocks in Tech Sector
| Ticker | Stock Name | Watchlist | Category | Recent Price | Smart Investing & Trading Score | Change % | Weekly Change% |
| INTU | Intuit |   | Software | 609.77 | 25 | 0.76% | 0.76% |
| PATH | UiPath | | Software - Infrastructure | 18.89 | 10 | 0.75% | 0.75% |
| GRPN | on | | Internet | 9.58 | 10 | 0.74% | 0.74% |
| WEAV | Weave | | Software - | 10.89 | 18 | 0.74% | 0.74% |
| SWI | SolarWinds | | Software | 10.98 | 32 | 0.73% | 0.73% |
| PRFT | Perficient | | IT | 45.12 | 42 | 0.71% | 0.71% |
| CVLT | Commvault Systems | | Software | 95.54 | 63 | 0.71% | 0.71% |
| FSLR | First Solar | | Semiconductor | 176.28 | 56 | 0.71% | 0.71% |
| TTD | Trade Desk | | Software | 77.84 | 36 | 0.70% | 0.70% |
| NET | Cloudflare | | Software | 84.69 | 36 | 0.70% | 0.70% |
| TDY | Teledyne | | Instruments | 404.08 | 49 | 0.68% | 0.68% |
| DV | DoubleVerify | | Software - | 29.63 | 10 | 0.68% | 0.68% |
| ITRN | Ituran Location | | Communication | 25.22 | 51 | 0.68% | 0.68% |
| VSH | Vishay Inter | | Semiconductor | 21.04 | 25 | 0.67% | 0.67% |
| CSGS | CSG Systems | | Software | 49.23 | 74 | 0.67% | 0.67% |
| SSNC | SS&C | | Software | 61.23 | 45 | 0.67% | 0.67% |
| BASE | Couchbase | | Software - Infrastructure | 23.05 | 10 | 0.66% | 0.66% |
| ALIT | Alight | | Software - | 9.18 | 68 | 0.66% | 0.66% |
| HUBB | Hubbell | | Electronics | 390.56 | 49 | 0.65% | 0.65% |
| VIV | Telefonica Brasil | | Wireless | 9.41 | 42 | 0.64% | 0.64% |
| OLO | Olo | | Software - | 4.70 | 31 | 0.64% | 0.64% |
| WKME | WalkMe | | Software - | 7.91 | 42 | 0.64% | 0.64% |
| TCX | Tucows | | Internet | 17.62 | 47 | 0.63% | 0.63% |
| TGAN | Transphorm | | Semiconductor | 4.82 | 35 | 0.63% | 0.63% |
| INTC | Intel | | Semiconductor | 34.41 | 10 | 0.61% | 0.61% |
| For chart view version of above stock list: Chart View ➞ 0 - 25 , 25 - 50 , 50 - 75 , 75 - 100 , 100 - 125 , 125 - 150 , 150 - 175 , 175 - 200 , 200 - 225 , 225 - 250 , 250 - 275 , 275 - 300 , 300 - 325 , 325 - 350 , 350 - 375 , 375 - 400 , 400 - 425 , 425 - 450 , 450 - 475 , 475 - 500 , 500 - 525 , 525 - 550 , 550 - 575 , 575 - 600 , 600 - 625 , 625 - 650 | ||
 | Click To Change The Sort Order: By Market Cap or Company Size Performance: Year-to-date, Week and Day |  |
|
Get the most comprehensive stock market coverage daily at 12Stocks.com ➞ Best Stocks Today ➞ Best Stocks Weekly ➞ Best Stocks Year-to-Date ➞ Best Stocks Trends ➞  Best Stocks Today 12Stocks.com Best Nasdaq Stocks ➞ Best S&P 500 Stocks ➞ Best Tech Stocks ➞ Best Biotech Stocks ➞ |
| Detailed Overview of Tech Stocks |
| Tech Technical Overview, Leaders & Laggards, Top Tech ETF Funds & Detailed Tech Stocks List, Charts, Trends & More |
| Tech Sector: Technical Analysis, Trends & YTD Performance | |
| Technology sector is composed of stocks
from semiconductors, software, web, social media
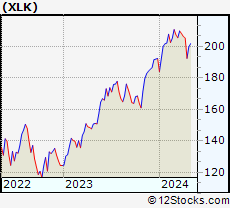
and services subsectors. Technology sector, as represented by XLK, an exchange-traded fund [ETF] that holds basket of tech stocks (e.g, Intel, Google) is up by 0.92% and is currently underperforming the overall market by -3.47% year-to-date. Below is a quick view of technical charts and trends: |
|
 XLK Weekly Chart |
|
| Long Term Trend: Not Good | |
| Medium Term Trend: Not Good | |
 XLK Daily Chart |
|
| Short Term Trend: Not Good | |
| Overall Trend Score: 10 | |
| YTD Performance: 0.92% | |
| **Trend Scores & Views Are Only For Educational Purposes And Not For Investing | |
| 12Stocks.com: Top Performing Technology Sector Stocks | ||||||||||||||||||||||||||||||||||||||||||||||||
 The top performing Technology sector stocks year to date are
Now, more recently, over last week, the top performing Technology sector stocks on the move are


|
||||||||||||||||||||||||||||||||||||||||||||||||
| 12Stocks.com: Investing in Tech Sector using Exchange Traded Funds | |
|
The following table shows list of key exchange traded funds (ETF) that
help investors track Tech Index. For detailed view, check out our ETF Funds section of our website. Quick View: Move mouse or cursor over ETF symbol (ticker) to view short-term technical chart and over ETF name to view long term chart. Click on ticker or stock name for detailed view. Click on to add stock symbol to your watchlist and to view watchlist. |
12Stocks.com List of ETFs that track Tech Index
| Ticker | ETF Name | Watchlist | Recent Price | Smart Investing & Trading Score | Change % | Week % | Year-to-date % |
| XLK | Technology | | 194.25 | 10 | 0.89 | 0.89 | 0.92% |
| QQQ | QQQ | | 414.32 | 13 | -0.08 | -0.08 | 1.17% |
| IYW | Technology | | 126.24 | 23 | 1.19 | 1.19 | 2.84% |
| VGT | Information Technology | | 486.46 | 10 | 1.37 | 1.37 | 0.51% |
| IXN | Global Tech | | 69.38 | 23 | 0.96 | 0.96 | 1.76% |
| IGV | Tech-Software | | 79.48 | 25 | 1.21 | 1.21 | -2.03% |
| XSD | Semiconductor | | 206.62 | 10 | 1.50 | 1.5 | -8.08% |
| TQQQ | QQQ | | 50.92 | 10 | 2.91 | 2.91 | 0.43% |
| SQQQ | Short QQQ | | 12.47 | 64 | -2.88 | -2.88 | -7.29% |
| SOXL | Semicondct Bull 3X | | 32.07 | 23 | 4.16 | 4.16 | 2.13% |
| SOXS | Semicondct Bear 3X | | 43.97 | 80 | -4.68 | -4.68 | 655.5% |
| SOXX | PHLX Semiconductor | | 201.66 | 36 | 1.65 | 1.65 | 5.01% |
| QTEC | First -100-Tech | | 176.36 | 10 | 1.39 | 1.39 | 0.51% |
| SMH | Semiconductor | | 203.02 | 36 | 1.91 | 1.91 | 16.1% |
| 12Stocks.com: Charts, Trends, Fundamental Data and Performances of Tech Stocks | |
|
We now take in-depth look at all Tech stocks including charts, multi-period performances and overall trends (as measured by Smart Investing & Trading Score). One can sort Tech stocks (click link to choose) by Daily, Weekly and by Year-to-Date performances. Also, one can sort by size of the company or by market capitalization. |
| Select Your Default Chart Type: | |||||
| |||||
| Click on stock symbol or name for detailed view. Click on to add stock symbol to your watchlist and to view watchlist. Quick View: Move mouse or cursor over "Daily" to quickly view daily technical stock chart and over "Weekly" to view weekly technical stock chart. | |||||


 | INTU Intuit Inc. |
| Sector: Technology | |
| SubSector: Application Software | |
| MarketCap: 577035 Millions | |
| Recent Price: 609.77 Smart Investing & Trading Score: 25 | |
| Day Percent Change: 0.76% Day Change: 4.60 | |
| Week Change: 0.76% Year-to-date Change: -2.4% | |
| INTU Links: Profile News Message Board | |
| Charts:- Daily , Weekly | |
| Add INTU to Watchlist: View: Get Complete INTU Trend Analysis ➞ | |
 | PATH UiPath Inc. |
| Sector: Technology | |
| SubSector: Software - Infrastructure | |
| MarketCap: 9580 Millions | |
| Recent Price: 18.89 Smart Investing & Trading Score: 10 | |
| Day Percent Change: 0.75% Day Change: 0.14 | |
| Week Change: 0.75% Year-to-date Change: -24.0% | |
| PATH Links: Profile News Message Board | |
| Charts:- Daily , Weekly | |
| Add PATH to Watchlist: View: Get Complete PATH Trend Analysis ➞ | |
 | GRPN Groupon, Inc. |
| Sector: Technology | |
| SubSector: Internet Information Providers | |
| MarketCap: 363.18 Millions | |
| Recent Price: 9.58 Smart Investing & Trading Score: 10 | |
| Day Percent Change: 0.74% Day Change: 0.07 | |
| Week Change: 0.74% Year-to-date Change: -25.4% | |
| GRPN Links: Profile News Message Board | |
| Charts:- Daily , Weekly | |
| Add GRPN to Watchlist: View: Get Complete GRPN Trend Analysis ➞ | |
 | WEAV Weave Communications, Inc. |
| Sector: Technology | |
| SubSector: Software - Application | |
| MarketCap: 740 Millions | |
| Recent Price: 10.89 Smart Investing & Trading Score: 18 | |
| Day Percent Change: 0.74% Day Change: 0.08 | |
| Week Change: 0.74% Year-to-date Change: -6.3% | |
| WEAV Links: Profile News Message Board | |
| Charts:- Daily , Weekly | |
| Add WEAV to Watchlist: View: Get Complete WEAV Trend Analysis ➞ | |
 | SWI SolarWinds Corporation |
| Sector: Technology | |
| SubSector: Application Software | |
| MarketCap: 4524.62 Millions | |
| Recent Price: 10.98 Smart Investing & Trading Score: 32 | |
| Day Percent Change: 0.73% Day Change: 0.08 | |
| Week Change: 0.73% Year-to-date Change: -12.1% | |
| SWI Links: Profile News Message Board | |
| Charts:- Daily , Weekly | |
| Add SWI to Watchlist: View: Get Complete SWI Trend Analysis ➞ | |
 | PRFT Perficient, Inc. |
| Sector: Technology | |
| SubSector: Information Technology Services | |
| MarketCap: 1005.68 Millions | |
| Recent Price: 45.12 Smart Investing & Trading Score: 42 | |
| Day Percent Change: 0.71% Day Change: 0.32 | |
| Week Change: 0.71% Year-to-date Change: -31.5% | |
| PRFT Links: Profile News Message Board | |
| Charts:- Daily , Weekly | |
| Add PRFT to Watchlist: View: Get Complete PRFT Trend Analysis ➞ | |
 | CVLT Commvault Systems, Inc. |
| Sector: Technology | |
| SubSector: Application Software | |
| MarketCap: 1607.22 Millions | |
| Recent Price: 95.54 Smart Investing & Trading Score: 63 | |
| Day Percent Change: 0.71% Day Change: 0.67 | |
| Week Change: 0.71% Year-to-date Change: 19.7% | |
| CVLT Links: Profile News Message Board | |
| Charts:- Daily , Weekly | |
| Add CVLT to Watchlist: View: Get Complete CVLT Trend Analysis ➞ | |
 | FSLR First Solar, Inc. |
| Sector: Technology | |
| SubSector: Semiconductor - Specialized | |
| MarketCap: 3617.9 Millions | |
| Recent Price: 176.28 Smart Investing & Trading Score: 56 | |
| Day Percent Change: 0.71% Day Change: 1.24 | |
| Week Change: 0.71% Year-to-date Change: 2.3% | |
| FSLR Links: Profile News Message Board | |
| Charts:- Daily , Weekly | |
| Add FSLR to Watchlist: View: Get Complete FSLR Trend Analysis ➞ | |
 | TTD The Trade Desk, Inc. |
| Sector: Technology | |
| SubSector: Application Software | |
| MarketCap: 9006.92 Millions | |
| Recent Price: 77.84 Smart Investing & Trading Score: 36 | |
| Day Percent Change: 0.70% Day Change: 0.54 | |
| Week Change: 0.7% Year-to-date Change: 8.2% | |
| TTD Links: Profile News Message Board | |
| Charts:- Daily , Weekly | |
| Add TTD to Watchlist: View: Get Complete TTD Trend Analysis ➞ | |
 | NET Cloudflare, Inc. |
| Sector: Technology | |
| SubSector: Application Software | |
| MarketCap: 7063.72 Millions | |
| Recent Price: 84.69 Smart Investing & Trading Score: 36 | |
| Day Percent Change: 0.70% Day Change: 0.59 | |
| Week Change: 0.7% Year-to-date Change: 1.7% | |
| NET Links: Profile News Message Board | |
| Charts:- Daily , Weekly | |
| Add NET to Watchlist: View: Get Complete NET Trend Analysis ➞ | |
 | TDY Teledyne Technologies Incorporated |
| Sector: Technology | |
| SubSector: Scientific & Technical Instruments | |
| MarketCap: 9360.43 Millions | |
| Recent Price: 404.08 Smart Investing & Trading Score: 49 | |
| Day Percent Change: 0.68% Day Change: 2.72 | |
| Week Change: 0.68% Year-to-date Change: -9.5% | |
| TDY Links: Profile News Message Board | |
| Charts:- Daily , Weekly | |
| Add TDY to Watchlist: View: Get Complete TDY Trend Analysis ➞ | |
 | DV DoubleVerify Holdings, Inc. |
| Sector: Technology | |
| SubSector: Software - Application | |
| MarketCap: 6500 Millions | |
| Recent Price: 29.63 Smart Investing & Trading Score: 10 | |
| Day Percent Change: 0.68% Day Change: 0.20 | |
| Week Change: 0.68% Year-to-date Change: -19.4% | |
| DV Links: Profile News Message Board | |
| Charts:- Daily , Weekly | |
| Add DV to Watchlist: View: Get Complete DV Trend Analysis ➞ | |
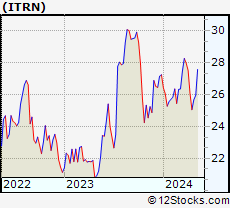 | ITRN Ituran Location and Control Ltd. |
| Sector: Technology | |
| SubSector: Communication Equipment | |
| MarketCap: 366.139 Millions | |
| Recent Price: 25.22 Smart Investing & Trading Score: 51 | |
| Day Percent Change: 0.68% Day Change: 0.17 | |
| Week Change: 0.68% Year-to-date Change: -7.4% | |
| ITRN Links: Profile News Message Board | |
| Charts:- Daily , Weekly | |
| Add ITRN to Watchlist: View: Get Complete ITRN Trend Analysis ➞ | |
 | VSH Vishay Intertechnology, Inc. |
| Sector: Technology | |
| SubSector: Semiconductor - Broad Line | |
| MarketCap: 2132.52 Millions | |
| Recent Price: 21.04 Smart Investing & Trading Score: 25 | |
| Day Percent Change: 0.67% Day Change: 0.14 | |
| Week Change: 0.67% Year-to-date Change: -12.2% | |
| VSH Links: Profile News Message Board | |
| Charts:- Daily , Weekly | |
| Add VSH to Watchlist: View: Get Complete VSH Trend Analysis ➞ | |
 | CSGS CSG Systems International, Inc. |
| Sector: Technology | |
| SubSector: Business Software & Services | |
| MarketCap: 1336.78 Millions | |
| Recent Price: 49.23 Smart Investing & Trading Score: 74 | |
| Day Percent Change: 0.67% Day Change: 0.33 | |
| Week Change: 0.67% Year-to-date Change: -7.5% | |
| CSGS Links: Profile News Message Board | |
| Charts:- Daily , Weekly | |
| Add CSGS to Watchlist: View: Get Complete CSGS Trend Analysis ➞ | |
 | SSNC SS&C Technologies Holdings, Inc. |
| Sector: Technology | |
| SubSector: Business Software & Services | |
| MarketCap: 9884.08 Millions | |
| Recent Price: 61.23 Smart Investing & Trading Score: 45 | |
| Day Percent Change: 0.67% Day Change: 0.41 | |
| Week Change: 0.67% Year-to-date Change: 0.2% | |
| SSNC Links: Profile News Message Board | |
| Charts:- Daily , Weekly | |
| Add SSNC to Watchlist: View: Get Complete SSNC Trend Analysis ➞ | |
 | BASE Couchbase, Inc. |
| Sector: Technology | |
| SubSector: Software - Infrastructure | |
| MarketCap: 724 Millions | |
| Recent Price: 23.05 Smart Investing & Trading Score: 10 | |
| Day Percent Change: 0.66% Day Change: 0.15 | |
| Week Change: 0.66% Year-to-date Change: 1.1% | |
| BASE Links: Profile News Message Board | |
| Charts:- Daily , Weekly | |
| Add BASE to Watchlist: View: Get Complete BASE Trend Analysis ➞ | |
 | ALIT Alight, Inc. |
| Sector: Technology | |
| SubSector: Software - Application | |
| MarketCap: 5130 Millions | |
| Recent Price: 9.18 Smart Investing & Trading Score: 68 | |
| Day Percent Change: 0.66% Day Change: 0.06 | |
| Week Change: 0.66% Year-to-date Change: 7.9% | |
| ALIT Links: Profile News Message Board | |
| Charts:- Daily , Weekly | |
| Add ALIT to Watchlist: View: Get Complete ALIT Trend Analysis ➞ | |
 | HUBB Hubbell Incorporated |
| Sector: Technology | |
| SubSector: Diversified Electronics | |
| MarketCap: 6002.46 Millions | |
| Recent Price: 390.56 Smart Investing & Trading Score: 49 | |
| Day Percent Change: 0.65% Day Change: 2.53 | |
| Week Change: 0.65% Year-to-date Change: 18.7% | |
| HUBB Links: Profile News Message Board | |
| Charts:- Daily , Weekly | |
| Add HUBB to Watchlist: View: Get Complete HUBB Trend Analysis ➞ | |
 | VIV Telefonica Brasil S.A. |
| Sector: Technology | |
| SubSector: Wireless Communications | |
| MarketCap: 19611.1 Millions | |
| Recent Price: 9.41 Smart Investing & Trading Score: 42 | |
| Day Percent Change: 0.64% Day Change: 0.06 | |
| Week Change: 0.64% Year-to-date Change: -14.0% | |
| VIV Links: Profile News Message Board | |
| Charts:- Daily , Weekly | |
| Add VIV to Watchlist: View: Get Complete VIV Trend Analysis ➞ | |
 | OLO Olo Inc. |
| Sector: Technology | |
| SubSector: Software - Application | |
| MarketCap: 1030 Millions | |
| Recent Price: 4.70 Smart Investing & Trading Score: 31 | |
| Day Percent Change: 0.64% Day Change: 0.03 | |
| Week Change: 0.64% Year-to-date Change: -17.8% | |
| OLO Links: Profile News Message Board | |
| Charts:- Daily , Weekly | |
| Add OLO to Watchlist: View: Get Complete OLO Trend Analysis ➞ | |
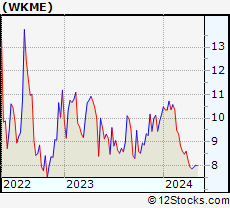 | WKME WalkMe Ltd. |
| Sector: Technology | |
| SubSector: Software - Application | |
| MarketCap: 833 Millions | |
| Recent Price: 7.91 Smart Investing & Trading Score: 42 | |
| Day Percent Change: 0.64% Day Change: 0.05 | |
| Week Change: 0.64% Year-to-date Change: -22.0% | |
| WKME Links: Profile News Message Board | |
| Charts:- Daily , Weekly | |
| Add WKME to Watchlist: View: Get Complete WKME Trend Analysis ➞ | |
 | TCX Tucows Inc. |
| Sector: Technology | |
| SubSector: Internet Information Providers | |
| MarketCap: 557.78 Millions | |
| Recent Price: 17.62 Smart Investing & Trading Score: 47 | |
| Day Percent Change: 0.63% Day Change: 0.11 | |
| Week Change: 0.63% Year-to-date Change: -34.7% | |
| TCX Links: Profile News Message Board | |
| Charts:- Daily , Weekly | |
| Add TCX to Watchlist: View: Get Complete TCX Trend Analysis ➞ | |
 | TGAN Transphorm, Inc. |
| Sector: Technology | |
| SubSector: Semiconductor Equipment & Materials | |
| MarketCap: 194 Millions | |
| Recent Price: 4.82 Smart Investing & Trading Score: 35 | |
| Day Percent Change: 0.63% Day Change: 0.03 | |
| Week Change: 0.63% Year-to-date Change: 31.5% | |
| TGAN Links: Profile News Message Board | |
| Charts:- Daily , Weekly | |
| Add TGAN to Watchlist: View: Get Complete TGAN Trend Analysis ➞ | |
 | INTC Intel Corporation |
| Sector: Technology | |
| SubSector: Semiconductor - Broad Line | |
| MarketCap: 222357 Millions | |
| Recent Price: 34.41 Smart Investing & Trading Score: 10 | |
| Day Percent Change: 0.61% Day Change: 0.21 | |
| Week Change: 0.61% Year-to-date Change: -31.5% | |
| INTC Links: Profile News Message Board | |
| Charts:- Daily , Weekly | |
| Add INTC to Watchlist: View: Get Complete INTC Trend Analysis ➞ | |
| For tabular summary view of above stock list: Summary View ➞ 0 - 25 , 25 - 50 , 50 - 75 , 75 - 100 , 100 - 125 , 125 - 150 , 150 - 175 , 175 - 200 , 200 - 225 , 225 - 250 , 250 - 275 , 275 - 300 , 300 - 325 , 325 - 350 , 350 - 375 , 375 - 400 , 400 - 425 , 425 - 450 , 450 - 475 , 475 - 500 , 500 - 525 , 525 - 550 , 550 - 575 , 575 - 600 , 600 - 625 , 625 - 650 | ||
| Click To Change The Sort Order: By Market Cap or Company Size Performance: Year-to-date, Week and Day | |
| Select Chart Type: | ||
|
Best Stocks Today 12Stocks.com |
© 2024 12Stocks.com Terms & Conditions Privacy Contact Us
All Information Provided Only For Education And Not To Be Used For Investing or Trading. See Terms & Conditions


One More Thing ... Get Best Stocks Delivered Daily!
Never Ever Miss A Move With Our Top Ten Stocks Lists
Find Best Stocks In Any Market - Bull or Bear Market
Take A Peek At Our Top Ten Stocks Lists: Daily, Weekly, Year-to-Date & Top Trends
Find Best Stocks In Any Market - Bull or Bear Market
Take A Peek At Our Top Ten Stocks Lists: Daily, Weekly, Year-to-Date & Top Trends
Technology Stocks With Best Up Trends [0-bearish to 100-bullish]: Matterport [100], Bilibili [100], JD.com [100], Nokia [100], Zuora [100], EchoStar [100], Jamf Holding[100], NextNav [100], Badger Meter[100], Bentley Systems[100], Telefonica S.A[100]
Best Technology Stocks Year-to-Date:
Pagaya [557.66%], MediaCo Holding[327.23%], CXApp [179.54%], Smith Micro[160.29%], Super Micro[152.24%], Uxin [116.83%], MicroStrategy [109.62%], GigaCloud [102.57%], NextNav [88.76%], CuriosityStream [87%], Matterport [77.78%] Best Technology Stocks This Week:
Matterport [175.86%], MicroStrategy [12.77%], So-Young [12.45%], CommScope Holding[10.52%], Bitdeer [10.47%], Akoustis [9.78%], Aerohive Networks[8.49%], Sea [7.94%], Bilibili [7.61%], BigBear.ai [7.59%], Tigo Energy[7.53%] Best Technology Stocks Daily:
Matterport [175.86%], MicroStrategy [12.77%], So-Young [12.45%], CommScope Holding[10.52%], Bitdeer [10.47%], Akoustis [9.78%], Aerohive Networks[8.49%], Sea [7.94%], Bilibili [7.61%], BigBear.ai [7.59%], Tigo Energy[7.53%]