
 Login Sign Up


| |||||
 |  | ||||

| 12Stocks.com Market Intelligence |
Best Tech Stocks
| In a hurry? Tech Stocks Lists: Performance & Trends, Stock Charts, FANG Stocks
Sort Tech stocks: Daily, Weekly, Year-to-Date, Market Cap & Trends. Filter Tech stocks list by size:All Tech Large Mid-Range Small and MicroCap |
| 12Stocks.com Tech Stocks Performances & Trends Daily | |||||||||
|
|  The overall Smart Investing & Trading Score is 0 (0-bearish to 100-bullish) which puts Technology sector in short term bearish trend. The Smart Investing & Trading Score from previous trading session is 13 and hence a deterioration of trend.
| ||||||||
Here are the Smart Investing & Trading Scores of the most requested Technology stocks at 12Stocks.com (click stock name for detailed review):
|


| 12Stocks.com: Investing in Technology sector with Stocks | |
|
The following table helps investors and traders sort through current performance and trends (as measured by Smart Investing & Trading Score) of various
stocks in the Tech sector. Quick View: Move mouse or cursor over stock symbol (ticker) to view short-term technical chart and over stock name to view long term chart. Click on  to add stock symbol to your watchlist and to add stock symbol to your watchlist and  to view watchlist. Click on any ticker or stock name for detailed market intelligence report for that stock. to view watchlist. Click on any ticker or stock name for detailed market intelligence report for that stock. |
12Stocks.com Performance of Stocks in Tech Sector
| Ticker | Stock Name | Watchlist | Category | Recent Price | Smart Investing & Trading Score | Change % | Weekly Change% |
| BOX | Box |   | Software | 26.67 | 68 | 0.76% | -1.00% |
| XNET | Xunlei | | Software | 1.48 | 10 | 0.34% | -1.00% |
| ATEX | Anterix | | Telecom | 31.80 | 36 | 1.56% | -1.03% |
| APPS | Digital Turbine | | Software | 1.85 | 45 | -3.14% | -1.07% |
| ESTC | Elastic N.V | | Software | 96.19 | 42 | 0.92% | -1.08% |
| EBON | Ebang | | Computer Hardware | 8.24 | 32 | 0.00% | -1.08% |
| ALIT | Alight | | Software - | 9.12 | 63 | 0.11% | -1.08% |
| INSP | Inspire Medical | | Internet | 229.22 | 71 | -4.95% | -1.09% |
| PRGS | Progress Software | | Software | 50.41 | 18 | 0.44% | -1.12% |
| HURC | Hurco | | Instruments | 19.04 | 10 | -1.40% | -1.14% |
| CNXN | PC Connection | | Computers Wholesale | 62.82 | 25 | 1.14% | -1.16% |
| JKHY | Jack Henry | | IT | 165.60 | 55 | 0.50% | -1.18% |
| IRM | Iron Mountain | | Software | 75.10 | 51 | 0.91% | -1.21% |
| MSI | Motorola | | Communication | 339.65 | 49 | 0.06% | -1.21% |
| ATEN | A10 Networks | | Communication | 12.94 | 28 | 0.70% | -1.22% |
| API | Agora | | Software | 2.41 | 25 | -1.23% | -1.23% |
| NTCT | NetScout Systems | | Software | 19.43 | 42 | 1.89% | -1.27% |
| KC | Kingsoft Cloud | | Software | 2.67 | 58 | 0.19% | -1.30% |
| OTEX | Open Text | | Software | 35.05 | 32 | 0.86% | -1.32% |
| ALGM | Allegro MicroSystems | | Semiconductors | 26.48 | 43 | 0.23% | -1.34% |
| EVCM | EverCommerce | | Software - Infrastructure | 8.83 | 42 | 0.11% | -1.34% |
| TGAN | Transphorm | | Semiconductor | 4.79 | 31 | -0.42% | -1.44% |
| INFN | Infinera | | Communication | 4.72 | 35 | 1.29% | -1.46% |
| UI | Ubiquiti | | Communication | 106.67 | 35 | 1.62% | -1.49% |
| MTCH | Match | | Internet | 32.18 | 37 | -0.12% | -1.53% |
| For chart view version of above stock list: Chart View ➞ 0 - 25 , 25 - 50 , 50 - 75 , 75 - 100 , 100 - 125 , 125 - 150 , 150 - 175 , 175 - 200 , 200 - 225 , 225 - 250 , 250 - 275 , 275 - 300 , 300 - 325 , 325 - 350 , 350 - 375 , 375 - 400 , 400 - 425 , 425 - 450 , 450 - 475 , 475 - 500 , 500 - 525 , 525 - 550 , 550 - 575 , 575 - 600 , 600 - 625 , 625 - 650 | ||
 | Click To Change The Sort Order: By Market Cap or Company Size Performance: Year-to-date, Week and Day |  |
|
Get the most comprehensive stock market coverage daily at 12Stocks.com ➞ Best Stocks Today ➞ Best Stocks Weekly ➞ Best Stocks Year-to-Date ➞ Best Stocks Trends ➞  Best Stocks Today 12Stocks.com Best Nasdaq Stocks ➞ Best S&P 500 Stocks ➞ Best Tech Stocks ➞ Best Biotech Stocks ➞ |
| Detailed Overview of Tech Stocks |
| Tech Technical Overview, Leaders & Laggards, Top Tech ETF Funds & Detailed Tech Stocks List, Charts, Trends & More |
| Tech Sector: Technical Analysis, Trends & YTD Performance | |
| Technology sector is composed of stocks
from semiconductors, software, web, social media
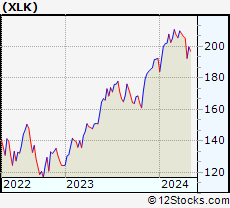
and services subsectors. Technology sector, as represented by XLK, an exchange-traded fund [ETF] that holds basket of tech stocks (e.g, Intel, Google) is up by 0.03% and is currently underperforming the overall market by -3.35% year-to-date. Below is a quick view of technical charts and trends: |
|
 XLK Weekly Chart |
|
| Long Term Trend: Not Good | |
| Medium Term Trend: Not Good | |
 XLK Daily Chart |
|
| Short Term Trend: Not Good | |
| Overall Trend Score: 0 | |
| YTD Performance: 0.03% | |
| **Trend Scores & Views Are Only For Educational Purposes And Not For Investing | |
| 12Stocks.com: Top Performing Technology Sector Stocks | ||||||||||||||||||||||||||||||||||||||||||||||||
 The top performing Technology sector stocks year to date are
Now, more recently, over last week, the top performing Technology sector stocks on the move are


|
||||||||||||||||||||||||||||||||||||||||||||||||
| 12Stocks.com: Investing in Tech Sector using Exchange Traded Funds | |
|
The following table shows list of key exchange traded funds (ETF) that
help investors track Tech Index. For detailed view, check out our ETF Funds section of our website. Quick View: Move mouse or cursor over ETF symbol (ticker) to view short-term technical chart and over ETF name to view long term chart. Click on ticker or stock name for detailed view. Click on to add stock symbol to your watchlist and to view watchlist. |
12Stocks.com List of ETFs that track Tech Index
| Ticker | ETF Name | Watchlist | Recent Price | Smart Investing & Trading Score | Change % | Week % | Year-to-date % |
| XLK | Technology | | 192.53 | 0 | -2.06 | -6.27 | 0.03% |
| QQQ | QQQ | | 414.65 | 13 | -2.07 | -5.39 | 1.25% |
| IYW | Technology | | 124.75 | 36 | -2.85 | -6.87 | 1.63% |
| VGT | Information Technology | | 479.90 | 23 | -2.65 | -6.76 | -0.85% |
| IXN | Global Tech | | 68.72 | 36 | -2.65 | -6.88 | 0.79% |
| IGV | Tech-Software | | 78.53 | 10 | -1.22 | -5.11 | -3.2% |
| XSD | Semiconductor | | 203.56 | 23 | -3.15 | -8.78 | -9.44% |
| TQQQ | QQQ | | 49.48 | 0 | -6.20 | -15.74 | -2.41% |
| SQQQ | Short QQQ | | 12.84 | 82 | 6.38 | 17.91 | -4.54% |
| SOXL | Semicondct Bull 3X | | 30.79 | 0 | -11.80 | -25.83 | -1.94% |
| SOXS | Semicondct Bear 3X | | 46.13 | 90 | 11.78 | 1210.51 | 692.61% |
| SOXX | PHLX Semiconductor | | 198.39 | 36 | -3.99 | -9.02 | 3.31% |
| QTEC | First -100-Tech | | 173.94 | 10 | -2.21 | -6.49 | -0.87% |
| SMH | Semiconductor | | 199.21 | 26 | -4.52 | -9.73 | 13.92% |
| 12Stocks.com: Charts, Trends, Fundamental Data and Performances of Tech Stocks | |
|
We now take in-depth look at all Tech stocks including charts, multi-period performances and overall trends (as measured by Smart Investing & Trading Score). One can sort Tech stocks (click link to choose) by Daily, Weekly and by Year-to-Date performances. Also, one can sort by size of the company or by market capitalization. |
| Select Your Default Chart Type: | |||||
| |||||
| Click on stock symbol or name for detailed view. Click on to add stock symbol to your watchlist and to view watchlist. Quick View: Move mouse or cursor over "Daily" to quickly view daily technical stock chart and over "Weekly" to view weekly technical stock chart. | |||||


 | BOX Box, Inc. |
| Sector: Technology | |
| SubSector: Application Software | |
| MarketCap: 2154.42 Millions | |
| Recent Price: 26.67 Smart Investing & Trading Score: 68 | |
| Day Percent Change: 0.76% Day Change: 0.20 | |
| Week Change: -1% Year-to-date Change: 4.1% | |
| BOX Links: Profile News Message Board | |
| Charts:- Daily , Weekly | |
| Add BOX to Watchlist: View: Get Complete BOX Trend Analysis ➞ | |
 | XNET Xunlei Limited |
| Sector: Technology | |
| SubSector: Application Software | |
| MarketCap: 203.662 Millions | |
| Recent Price: 1.48 Smart Investing & Trading Score: 10 | |
| Day Percent Change: 0.34% Day Change: 0.00 | |
| Week Change: -1% Year-to-date Change: -8.6% | |
| XNET Links: Profile News Message Board | |
| Charts:- Daily , Weekly | |
| Add XNET to Watchlist: View: Get Complete XNET Trend Analysis ➞ | |
 | ATEX Anterix Inc. |
| Sector: Technology | |
| SubSector: Telecom Services - Domestic | |
| MarketCap: 694.077 Millions | |
| Recent Price: 31.80 Smart Investing & Trading Score: 36 | |
| Day Percent Change: 1.56% Day Change: 0.49 | |
| Week Change: -1.03% Year-to-date Change: -4.6% | |
| ATEX Links: Profile News Message Board | |
| Charts:- Daily , Weekly | |
| Add ATEX to Watchlist: View: Get Complete ATEX Trend Analysis ➞ | |
 | APPS Digital Turbine, Inc. |
| Sector: Technology | |
| SubSector: Application Software | |
| MarketCap: 437.262 Millions | |
| Recent Price: 1.85 Smart Investing & Trading Score: 45 | |
| Day Percent Change: -3.14% Day Change: -0.06 | |
| Week Change: -1.07% Year-to-date Change: -73.0% | |
| APPS Links: Profile News Message Board | |
| Charts:- Daily , Weekly | |
| Add APPS to Watchlist: View: Get Complete APPS Trend Analysis ➞ | |
 | ESTC Elastic N.V. |
| Sector: Technology | |
| SubSector: Application Software | |
| MarketCap: 4420.92 Millions | |
| Recent Price: 96.19 Smart Investing & Trading Score: 42 | |
| Day Percent Change: 0.92% Day Change: 0.88 | |
| Week Change: -1.08% Year-to-date Change: -14.7% | |
| ESTC Links: Profile News Message Board | |
| Charts:- Daily , Weekly | |
| Add ESTC to Watchlist: View: Get Complete ESTC Trend Analysis ➞ | |
 | EBON Ebang International Holdings Inc. |
| Sector: Technology | |
| SubSector: Computer Hardware | |
| MarketCap: 33787 Millions | |
| Recent Price: 8.24 Smart Investing & Trading Score: 32 | |
| Day Percent Change: 0.00% Day Change: 0.00 | |
| Week Change: -1.08% Year-to-date Change: -46.1% | |
| EBON Links: Profile News Message Board | |
| Charts:- Daily , Weekly | |
| Add EBON to Watchlist: View: Get Complete EBON Trend Analysis ➞ | |
 | ALIT Alight, Inc. |
| Sector: Technology | |
| SubSector: Software - Application | |
| MarketCap: 5130 Millions | |
| Recent Price: 9.12 Smart Investing & Trading Score: 63 | |
| Day Percent Change: 0.11% Day Change: 0.01 | |
| Week Change: -1.08% Year-to-date Change: 7.2% | |
| ALIT Links: Profile News Message Board | |
| Charts:- Daily , Weekly | |
| Add ALIT to Watchlist: View: Get Complete ALIT Trend Analysis ➞ | |
 | INSP Inspire Medical Systems, Inc. |
| Sector: Technology | |
| SubSector: Internet Information Providers | |
| MarketCap: 1239.8 Millions | |
| Recent Price: 229.22 Smart Investing & Trading Score: 71 | |
| Day Percent Change: -4.95% Day Change: -11.93 | |
| Week Change: -1.09% Year-to-date Change: 12.7% | |
| INSP Links: Profile News Message Board | |
| Charts:- Daily , Weekly | |
| Add INSP to Watchlist: View: Get Complete INSP Trend Analysis ➞ | |
 | PRGS Progress Software Corporation |
| Sector: Technology | |
| SubSector: Application Software | |
| MarketCap: 1407.22 Millions | |
| Recent Price: 50.41 Smart Investing & Trading Score: 18 | |
| Day Percent Change: 0.44% Day Change: 0.22 | |
| Week Change: -1.12% Year-to-date Change: -7.2% | |
| PRGS Links: Profile News Message Board | |
| Charts:- Daily , Weekly | |
| Add PRGS to Watchlist: View: Get Complete PRGS Trend Analysis ➞ | |
 | HURC Hurco Companies, Inc. |
| Sector: Technology | |
| SubSector: Scientific & Technical Instruments | |
| MarketCap: 169.253 Millions | |
| Recent Price: 19.04 Smart Investing & Trading Score: 10 | |
| Day Percent Change: -1.40% Day Change: -0.27 | |
| Week Change: -1.14% Year-to-date Change: -11.6% | |
| HURC Links: Profile News Message Board | |
| Charts:- Daily , Weekly | |
| Add HURC to Watchlist: View: Get Complete HURC Trend Analysis ➞ | |
 | CNXN PC Connection, Inc. |
| Sector: Technology | |
| SubSector: Computers Wholesale | |
| MarketCap: 1020.19 Millions | |
| Recent Price: 62.82 Smart Investing & Trading Score: 25 | |
| Day Percent Change: 1.14% Day Change: 0.71 | |
| Week Change: -1.16% Year-to-date Change: -6.5% | |
| CNXN Links: Profile News Message Board | |
| Charts:- Daily , Weekly | |
| Add CNXN to Watchlist: View: Get Complete CNXN Trend Analysis ➞ | |
 | JKHY Jack Henry & Associates, Inc. |
| Sector: Technology | |
| SubSector: Information Technology Services | |
| MarketCap: 10695.4 Millions | |
| Recent Price: 165.60 Smart Investing & Trading Score: 55 | |
| Day Percent Change: 0.50% Day Change: 0.83 | |
| Week Change: -1.18% Year-to-date Change: 1.3% | |
| JKHY Links: Profile News Message Board | |
| Charts:- Daily , Weekly | |
| Add JKHY to Watchlist: View: Get Complete JKHY Trend Analysis ➞ | |
 | IRM Iron Mountain Incorporated |
| Sector: Technology | |
| SubSector: Business Software & Services | |
| MarketCap: 7339.18 Millions | |
| Recent Price: 75.10 Smart Investing & Trading Score: 51 | |
| Day Percent Change: 0.91% Day Change: 0.68 | |
| Week Change: -1.21% Year-to-date Change: 7.3% | |
| IRM Links: Profile News Message Board | |
| Charts:- Daily , Weekly | |
| Add IRM to Watchlist: View: Get Complete IRM Trend Analysis ➞ | |
 | MSI Motorola Solutions, Inc. |
| Sector: Technology | |
| SubSector: Communication Equipment | |
| MarketCap: 26573.3 Millions | |
| Recent Price: 339.65 Smart Investing & Trading Score: 49 | |
| Day Percent Change: 0.06% Day Change: 0.19 | |
| Week Change: -1.21% Year-to-date Change: 8.5% | |
| MSI Links: Profile News Message Board | |
| Charts:- Daily , Weekly | |
| Add MSI to Watchlist: View: Get Complete MSI Trend Analysis ➞ | |
 | ATEN A10 Networks, Inc. |
| Sector: Technology | |
| SubSector: Communication Equipment | |
| MarketCap: 363.739 Millions | |
| Recent Price: 12.94 Smart Investing & Trading Score: 28 | |
| Day Percent Change: 0.70% Day Change: 0.09 | |
| Week Change: -1.22% Year-to-date Change: -1.8% | |
| ATEN Links: Profile News Message Board | |
| Charts:- Daily , Weekly | |
| Add ATEN to Watchlist: View: Get Complete ATEN Trend Analysis ➞ | |
 | API Agora, Inc. |
| Sector: Technology | |
| SubSector: Software Application | |
| MarketCap: 42787 Millions | |
| Recent Price: 2.41 Smart Investing & Trading Score: 25 | |
| Day Percent Change: -1.23% Day Change: -0.03 | |
| Week Change: -1.23% Year-to-date Change: -8.7% | |
| API Links: Profile News Message Board | |
| Charts:- Daily , Weekly | |
| Add API to Watchlist: View: Get Complete API Trend Analysis ➞ | |
 | NTCT NetScout Systems, Inc. |
| Sector: Technology | |
| SubSector: Business Software & Services | |
| MarketCap: 1657.28 Millions | |
| Recent Price: 19.43 Smart Investing & Trading Score: 42 | |
| Day Percent Change: 1.89% Day Change: 0.36 | |
| Week Change: -1.27% Year-to-date Change: -11.5% | |
| NTCT Links: Profile News Message Board | |
| Charts:- Daily , Weekly | |
| Add NTCT to Watchlist: View: Get Complete NTCT Trend Analysis ➞ | |
 | KC Kingsoft Cloud Holdings Limited |
| Sector: Technology | |
| SubSector: Software Application | |
| MarketCap: 98487 Millions | |
| Recent Price: 2.67 Smart Investing & Trading Score: 58 | |
| Day Percent Change: 0.19% Day Change: 0.00 | |
| Week Change: -1.3% Year-to-date Change: -29.6% | |
| KC Links: Profile News Message Board | |
| Charts:- Daily , Weekly | |
| Add KC to Watchlist: View: Get Complete KC Trend Analysis ➞ | |
 | OTEX Open Text Corporation |
| Sector: Technology | |
| SubSector: Application Software | |
| MarketCap: 9291.92 Millions | |
| Recent Price: 35.05 Smart Investing & Trading Score: 32 | |
| Day Percent Change: 0.86% Day Change: 0.30 | |
| Week Change: -1.32% Year-to-date Change: -16.6% | |
| OTEX Links: Profile News Message Board | |
| Charts:- Daily , Weekly | |
| Add OTEX to Watchlist: View: Get Complete OTEX Trend Analysis ➞ | |
 | ALGM Allegro MicroSystems, Inc. |
| Sector: Technology | |
| SubSector: Semiconductors | |
| MarketCap: 50287 Millions | |
| Recent Price: 26.48 Smart Investing & Trading Score: 43 | |
| Day Percent Change: 0.23% Day Change: 0.06 | |
| Week Change: -1.34% Year-to-date Change: -12.6% | |
| ALGM Links: Profile News Message Board | |
| Charts:- Daily , Weekly | |
| Add ALGM to Watchlist: View: Get Complete ALGM Trend Analysis ➞ | |
 | EVCM EverCommerce Inc. |
| Sector: Technology | |
| SubSector: Software - Infrastructure | |
| MarketCap: 2210 Millions | |
| Recent Price: 8.83 Smart Investing & Trading Score: 42 | |
| Day Percent Change: 0.11% Day Change: 0.01 | |
| Week Change: -1.34% Year-to-date Change: -20.6% | |
| EVCM Links: Profile News Message Board | |
| Charts:- Daily , Weekly | |
| Add EVCM to Watchlist: View: Get Complete EVCM Trend Analysis ➞ | |
 | TGAN Transphorm, Inc. |
| Sector: Technology | |
| SubSector: Semiconductor Equipment & Materials | |
| MarketCap: 194 Millions | |
| Recent Price: 4.79 Smart Investing & Trading Score: 31 | |
| Day Percent Change: -0.42% Day Change: -0.02 | |
| Week Change: -1.44% Year-to-date Change: 30.7% | |
| TGAN Links: Profile News Message Board | |
| Charts:- Daily , Weekly | |
| Add TGAN to Watchlist: View: Get Complete TGAN Trend Analysis ➞ | |
 | INFN Infinera Corporation |
| Sector: Technology | |
| SubSector: Communication Equipment | |
| MarketCap: 943 Millions | |
| Recent Price: 4.72 Smart Investing & Trading Score: 35 | |
| Day Percent Change: 1.29% Day Change: 0.06 | |
| Week Change: -1.46% Year-to-date Change: -0.6% | |
| INFN Links: Profile News Message Board | |
| Charts:- Daily , Weekly | |
| Add INFN to Watchlist: View: Get Complete INFN Trend Analysis ➞ | |
 | UI Ubiquiti Inc. |
| Sector: Technology | |
| SubSector: Communication Equipment | |
| MarketCap: 9526.89 Millions | |
| Recent Price: 106.67 Smart Investing & Trading Score: 35 | |
| Day Percent Change: 1.62% Day Change: 1.70 | |
| Week Change: -1.49% Year-to-date Change: -23.6% | |
| UI Links: Profile News Message Board | |
| Charts:- Daily , Weekly | |
| Add UI to Watchlist: View: Get Complete UI Trend Analysis ➞ | |
 | MTCH Match Group, Inc. |
| Sector: Technology | |
| SubSector: Internet Information Providers | |
| MarketCap: 14655.8 Millions | |
| Recent Price: 32.18 Smart Investing & Trading Score: 37 | |
| Day Percent Change: -0.12% Day Change: -0.04 | |
| Week Change: -1.53% Year-to-date Change: -11.8% | |
| MTCH Links: Profile News Message Board | |
| Charts:- Daily , Weekly | |
| Add MTCH to Watchlist: View: Get Complete MTCH Trend Analysis ➞ | |
| For tabular summary view of above stock list: Summary View ➞ 0 - 25 , 25 - 50 , 50 - 75 , 75 - 100 , 100 - 125 , 125 - 150 , 150 - 175 , 175 - 200 , 200 - 225 , 225 - 250 , 250 - 275 , 275 - 300 , 300 - 325 , 325 - 350 , 350 - 375 , 375 - 400 , 400 - 425 , 425 - 450 , 450 - 475 , 475 - 500 , 500 - 525 , 525 - 550 , 550 - 575 , 575 - 600 , 600 - 625 , 625 - 650 | ||
| Click To Change The Sort Order: By Market Cap or Company Size Performance: Year-to-date, Week and Day | |
| Select Chart Type: | ||
|
Best Stocks Today 12Stocks.com |
© 2024 12Stocks.com Terms & Conditions Privacy Contact Us
All Information Provided Only For Education And Not To Be Used For Investing or Trading. See Terms & Conditions


One More Thing ... Get Best Stocks Delivered Daily!
Never Ever Miss A Move With Our Top Ten Stocks Lists
Find Best Stocks In Any Market - Bull or Bear Market
Take A Peek At Our Top Ten Stocks Lists: Daily, Weekly, Year-to-Date & Top Trends
Find Best Stocks In Any Market - Bull or Bear Market
Take A Peek At Our Top Ten Stocks Lists: Daily, Weekly, Year-to-Date & Top Trends
Technology Stocks With Best Up Trends [0-bearish to 100-bullish]: Karooooo [100], EchoStar [100], Badger Meter[100], Full Truck[93], Turkcell Iletisim[93], Grab [93], Zuora [93], GDS [88], GigaCloud [88], Criteo S.A[83], So-Young [83]
Best Technology Stocks Year-to-Date:
Pagaya [589.78%], MediaCo Holding[544.37%], CXApp [168.73%], Smith Micro[151.82%], Super Micro[151.06%], Uxin [141.08%], CuriosityStream [107.37%], GigaCloud [89.46%], MicroStrategy [85.89%], NextNav [83.37%], D-Wave Quantum[81.22%] Best Technology Stocks This Week:
Snap One[29.73%], Badger Meter[15.61%], Mynaric AG[13.08%], Expensify [11.56%], Iridium [11.07%], NextNav [10.12%], Encore Wire[8.97%], Quhuo [8.87%], Bentley Systems[7.96%], Applied Optoelectronics[7.93%], Zuora [7.56%] Best Technology Stocks Daily:
Markforged Holding[16.32%], CuriosityStream [10.89%], CXApp [9.78%], Iridium [5.14%], Cheetah Mobile[5.04%], Aerohive Networks[4.23%], Materialise NV[3.98%], Applied Optoelectronics[3.95%], QuinStreet [3.70%], ATN [3.58%], MediaCo Holding[3.58%]