
 Login Sign Up


| |||||
 |  | ||||

| 12Stocks.com Market Intelligence |
Best Tech Stocks
| In a hurry? Tech Stocks Lists: Performance & Trends, Stock Charts, FANG Stocks
Sort Tech stocks: Daily, Weekly, Year-to-Date, Market Cap & Trends. Filter Tech stocks list by size:All Tech Large Mid-Range Small and MicroCap |
| 12Stocks.com Tech Stocks Performances & Trends Daily | |||||||||
|
|  The overall Smart Investing & Trading Score is 18 (0-bearish to 100-bullish) which puts Technology sector in short term bearish trend. The Smart Investing & Trading Score from previous trading session is 45 and hence a deterioration of trend.
| ||||||||
Here are the Smart Investing & Trading Scores of the most requested Technology stocks at 12Stocks.com (click stock name for detailed review):
|


| 12Stocks.com: Investing in Technology sector with Stocks | |
|
The following table helps investors and traders sort through current performance and trends (as measured by Smart Investing & Trading Score) of various
stocks in the Tech sector. Quick View: Move mouse or cursor over stock symbol (ticker) to view short-term technical chart and over stock name to view long term chart. Click on  to add stock symbol to your watchlist and to add stock symbol to your watchlist and  to view watchlist. Click on any ticker or stock name for detailed market intelligence report for that stock. to view watchlist. Click on any ticker or stock name for detailed market intelligence report for that stock. |
12Stocks.com Performance of Stocks in Tech Sector
| Ticker | Stock Name | Watchlist | Category | Recent Price | Smart Investing & Trading Score | Change % | YTD Change% |
| PI | Impinj |   | Communication | 139.13 | 90 | 15.06 | 54.53% |
| KARO | Karooooo | | Software - | 31.25 | 100 | 14.20 | 26.26% |
| HCP | HashiCorp | | Software - Infrastructure | 32.93 | 100 | 11.06 | 36.53% |
| TYL | Tyler | | Software | 460.86 | 64 | 9.99 | 10.22% |
| AIXI | Xiao-I | | Software - | 1.34 | 17 | 6.35 | -40.44% |
| MDIA | MediaCo Holding | | Broadcasting | 2.09 | 36 | 5.56 | 390.61% |
| RBBN | Ribbon | | Telecom | 3.43 | 100 | 5.54 | 18.28% |
| TER | Teradyne | | Semiconductor | 106.18 | 58 | 5.44 | -2.16% |
| CACI | CACI | | IT | 398.31 | 95 | 4.99 | 22.99% |
| VIOT | Viomi | | Electronic | 0.59 | 50 | 4.99 | -41.10% |
| UXIN | Uxin | | Internet | 1.98 | 39 | 4.76 | 182.45% |
| CMCM | Cheetah Mobile | | Software | 4.14 | 88 | 4.55 | 81.58% |
| HCOM | Hawaiian Telcom | | Communication | 15.30 | 36 | 4.51 | 6.14% |
| SLAB | Silicon | | Semiconductor | 118.00 | 0 | 3.27 | -10.79% |
| FENG | Phoenix New | | Internet | 1.81 | 53 | 2.84 | 33.09% |
| ARBE | Arbe Robotics | | Software - Infrastructure | 1.85 | 27 | 2.78 | -14.75% |
| AVGO | Broadcom | | Semiconductor | 1289.45 | 58 | 2.60 | 15.52% |
| MRVL | Marvell | | Semiconductor | 66.44 | 32 | 2.45 | 10.16% |
| FORM | FormFactor | | Semiconductor | 42.67 | 58 | 2.28 | 2.30% |
| GRAB | Grab | | Software - | 3.48 | 100 | 1.90 | 2.80% |
| CLS | Celestica | | Circuit Boards | 44.92 | 56 | 1.86 | 53.42% |
| LRCX | Lam Research | | Semiconductor | 901.33 | 58 | 1.86 | 15.07% |
| ANET | Arista Networks | | Computer | 258.70 | 32 | 1.54 | 9.85% |
| TDY | Teledyne | | Instruments | 367.94 | 0 | 1.50 | -17.56% |
| NVDA | NVIDIA | | Semiconductor | 807.49 | 56 | 1.35 | 63.06% |
| For chart view version of above stock list: Chart View ➞ 0 - 25 , 25 - 50 , 50 - 75 , 75 - 100 , 100 - 125 , 125 - 150 , 150 - 175 , 175 - 200 , 200 - 225 , 225 - 250 , 250 - 275 , 275 - 300 , 300 - 325 , 325 - 350 , 350 - 375 , 375 - 400 , 400 - 425 , 425 - 450 , 450 - 475 , 475 - 500 , 500 - 525 , 525 - 550 , 550 - 575 , 575 - 600 , 600 - 625 | ||
 | Click To Change The Sort Order: By Market Cap or Company Size Performance: Year-to-date, Week and Day |  |
|
Get the most comprehensive stock market coverage daily at 12Stocks.com ➞ Best Stocks Today ➞ Best Stocks Weekly ➞ Best Stocks Year-to-Date ➞ Best Stocks Trends ➞  Best Stocks Today 12Stocks.com Best Nasdaq Stocks ➞ Best S&P 500 Stocks ➞ Best Tech Stocks ➞ Best Biotech Stocks ➞ |
| Detailed Overview of Tech Stocks |
| Tech Technical Overview, Leaders & Laggards, Top Tech ETF Funds & Detailed Tech Stocks List, Charts, Trends & More |
| Tech Sector: Technical Analysis, Trends & YTD Performance | |
| Technology sector is composed of stocks
from semiconductors, software, web, social media
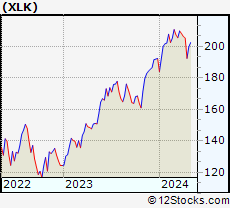
and services subsectors. Technology sector, as represented by XLK, an exchange-traded fund [ETF] that holds basket of tech stocks (e.g, Intel, Google) is up by 1.34% and is currently underperforming the overall market by -2.58% year-to-date. Below is a quick view of technical charts and trends: |
|
 XLK Weekly Chart |
|
| Long Term Trend: Not Good | |
| Medium Term Trend: Not Good | |
 XLK Daily Chart |
|
| Short Term Trend: Very Good | |
| Overall Trend Score: 18 | |
| YTD Performance: 1.34% | |
| **Trend Scores & Views Are Only For Educational Purposes And Not For Investing | |
| 12Stocks.com: Top Performing Technology Sector Stocks | ||||||||||||||||||||||||||||||||||||||||||||||||
 The top performing Technology sector stocks year to date are
Now, more recently, over last week, the top performing Technology sector stocks on the move are


|
||||||||||||||||||||||||||||||||||||||||||||||||
| 12Stocks.com: Investing in Tech Sector using Exchange Traded Funds | |
|
The following table shows list of key exchange traded funds (ETF) that
help investors track Tech Index. For detailed view, check out our ETF Funds section of our website. Quick View: Move mouse or cursor over ETF symbol (ticker) to view short-term technical chart and over ETF name to view long term chart. Click on ticker or stock name for detailed view. Click on to add stock symbol to your watchlist and to view watchlist. |
12Stocks.com List of ETFs that track Tech Index
| Ticker | ETF Name | Watchlist | Recent Price | Smart Investing & Trading Score | Change % | Week % | Year-to-date % |
| XLK | Technology | | 195.06 | 18 | -1.50 | 1.31 | 1.34% |
| TQQQ | QQQ | | 50.75 | 18 | -5.51 | 2.57 | 0.1% |
| SQQQ | Short QQQ | | 12.47 | 57 | 5.55 | -2.92 | -7.32% |
| SOXL | Semicondct Bull 3X | | 36.05 | 58 | 1.58 | 17.08 | 14.81% |
| SMH | Semiconductor | | 208.91 | 58 | 0.42 | 4.87 | 19.47% |
| 12Stocks.com: Charts, Trends, Fundamental Data and Performances of Tech Stocks | |
|
We now take in-depth look at all Tech stocks including charts, multi-period performances and overall trends (as measured by Smart Investing & Trading Score). One can sort Tech stocks (click link to choose) by Daily, Weekly and by Year-to-Date performances. Also, one can sort by size of the company or by market capitalization. |
| Select Your Default Chart Type: | |||||
| |||||
| Click on stock symbol or name for detailed view. Click on to add stock symbol to your watchlist and to view watchlist. Quick View: Move mouse or cursor over "Daily" to quickly view daily technical stock chart and over "Weekly" to view weekly technical stock chart. | |||||


 | PI Impinj, Inc. |
| Sector: Technology | |
| SubSector: Communication Equipment | |
| MarketCap: 364.739 Millions | |
| Recent Price: 139.13 Smart Investing & Trading Score: 90 | |
| Day Percent Change: 15.06% Day Change: 18.22 | |
| Week Change: 19.61% Year-to-date Change: 54.5% | |
| PI Links: Profile News Message Board | |
| Charts:- Daily , Weekly | |
| Add PI to Watchlist: View: Get Complete PI Trend Analysis ➞ | |
 | KARO Karooooo Ltd. |
| Sector: Technology | |
| SubSector: Software - Application | |
| MarketCap: 728 Millions | |
| Recent Price: 31.25 Smart Investing & Trading Score: 100 | |
| Day Percent Change: 14.20% Day Change: 3.89 | |
| Week Change: 15.36% Year-to-date Change: 26.3% | |
| KARO Links: Profile News Message Board | |
| Charts:- Daily , Weekly | |
| Add KARO to Watchlist: View: Get Complete KARO Trend Analysis ➞ | |
 | HCP HashiCorp, Inc. |
| Sector: Technology | |
| SubSector: Software - Infrastructure | |
| MarketCap: 5070 Millions | |
| Recent Price: 32.93 Smart Investing & Trading Score: 100 | |
| Day Percent Change: 11.06% Day Change: 3.28 | |
| Week Change: 37.38% Year-to-date Change: 36.5% | |
| HCP Links: Profile News Message Board | |
| Charts:- Daily , Weekly | |
| Add HCP to Watchlist: View: Get Complete HCP Trend Analysis ➞ | |
 | TYL Tyler Technologies, Inc. |
| Sector: Technology | |
| SubSector: Technical & System Software | |
| MarketCap: 10785 Millions | |
| Recent Price: 460.86 Smart Investing & Trading Score: 64 | |
| Day Percent Change: 9.99% Day Change: 41.86 | |
| Week Change: 14.26% Year-to-date Change: 10.2% | |
| TYL Links: Profile News Message Board | |
| Charts:- Daily , Weekly | |
| Add TYL to Watchlist: View: Get Complete TYL Trend Analysis ➞ | |
 | AIXI Xiao-I Corporation |
| Sector: Technology | |
| SubSector: Software - Application | |
| MarketCap: 431 Millions | |
| Recent Price: 1.34 Smart Investing & Trading Score: 17 | |
| Day Percent Change: 6.35% Day Change: 0.08 | |
| Week Change: -5.63% Year-to-date Change: -40.4% | |
| AIXI Links: Profile News Message Board | |
| Charts:- Daily , Weekly | |
| Add AIXI to Watchlist: View: Get Complete AIXI Trend Analysis ➞ | |
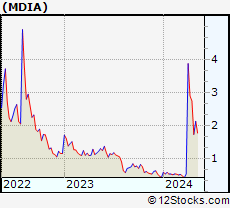 | MDIA MediaCo Holding Inc. |
| Sector: Technology | |
| SubSector: Broadcasting | |
| MarketCap: 16837 Millions | |
| Recent Price: 2.09 Smart Investing & Trading Score: 36 | |
| Day Percent Change: 5.56% Day Change: 0.11 | |
| Week Change: -23.86% Year-to-date Change: 390.6% | |
| MDIA Links: Profile News Message Board | |
| Charts:- Daily , Weekly | |
| Add MDIA to Watchlist: View: Get Complete MDIA Trend Analysis ➞ | |
 | RBBN Ribbon Communications Inc. |
| Sector: Technology | |
| SubSector: Telecom Services - Domestic | |
| MarketCap: 284.577 Millions | |
| Recent Price: 3.43 Smart Investing & Trading Score: 100 | |
| Day Percent Change: 5.54% Day Change: 0.18 | |
| Week Change: 32.95% Year-to-date Change: 18.3% | |
| RBBN Links: Profile News Message Board | |
| Charts:- Daily , Weekly | |
| Add RBBN to Watchlist: View: Get Complete RBBN Trend Analysis ➞ | |
 | TER Teradyne, Inc. |
| Sector: Technology | |
| SubSector: Semiconductor Equipment & Materials | |
| MarketCap: 8135.68 Millions | |
| Recent Price: 106.18 Smart Investing & Trading Score: 58 | |
| Day Percent Change: 5.44% Day Change: 5.47 | |
| Week Change: 10.63% Year-to-date Change: -2.2% | |
| TER Links: Profile News Message Board | |
| Charts:- Daily , Weekly | |
| Add TER to Watchlist: View: Get Complete TER Trend Analysis ➞ | |
 | CACI CACI International Inc |
| Sector: Technology | |
| SubSector: Information Technology Services | |
| MarketCap: 5211.58 Millions | |
| Recent Price: 398.31 Smart Investing & Trading Score: 95 | |
| Day Percent Change: 4.99% Day Change: 18.93 | |
| Week Change: 7.83% Year-to-date Change: 23.0% | |
| CACI Links: Profile News Message Board | |
| Charts:- Daily , Weekly | |
| Add CACI to Watchlist: View: Get Complete CACI Trend Analysis ➞ | |
 | VIOT Viomi Technology Co., Ltd |
| Sector: Technology | |
| SubSector: Electronic Equipment | |
| MarketCap: 357.2 Millions | |
| Recent Price: 0.59 Smart Investing & Trading Score: 50 | |
| Day Percent Change: 4.99% Day Change: 0.03 | |
| Week Change: 7.97% Year-to-date Change: -41.1% | |
| VIOT Links: Profile News Message Board | |
| Charts:- Daily , Weekly | |
| Add VIOT to Watchlist: View: Get Complete VIOT Trend Analysis ➞ | |
 | UXIN Uxin Limited |
| Sector: Technology | |
| SubSector: Internet Information Providers | |
| MarketCap: 414.58 Millions | |
| Recent Price: 1.98 Smart Investing & Trading Score: 39 | |
| Day Percent Change: 4.76% Day Change: 0.09 | |
| Week Change: 17.16% Year-to-date Change: 182.5% | |
| UXIN Links: Profile News Message Board | |
| Charts:- Daily , Weekly | |
| Add UXIN to Watchlist: View: Get Complete UXIN Trend Analysis ➞ | |
 | CMCM Cheetah Mobile Inc. |
| Sector: Technology | |
| SubSector: Application Software | |
| MarketCap: 343.362 Millions | |
| Recent Price: 4.14 Smart Investing & Trading Score: 88 | |
| Day Percent Change: 4.55% Day Change: 0.18 | |
| Week Change: 16.95% Year-to-date Change: 81.6% | |
| CMCM Links: Profile News Message Board | |
| Charts:- Daily , Weekly | |
| Add CMCM to Watchlist: View: Get Complete CMCM Trend Analysis ➞ | |
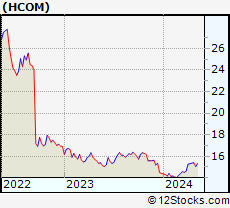 | HCOM Hawaiian Telcom Holdco, Inc. |
| Sector: Technology | |
| SubSector: Diversified Communication Services | |
| MarketCap: 272.82 Millions | |
| Recent Price: 15.30 Smart Investing & Trading Score: 36 | |
| Day Percent Change: 4.51% Day Change: 0.66 | |
| Week Change: -0.49% Year-to-date Change: 6.1% | |
| HCOM Links: Profile News Message Board | |
| Charts:- Daily , Weekly | |
| Add HCOM to Watchlist: View: Get Complete HCOM Trend Analysis ➞ | |
 | SLAB Silicon Laboratories Inc. |
| Sector: Technology | |
| SubSector: Semiconductor - Integrated Circuits | |
| MarketCap: 3710.2 Millions | |
| Recent Price: 118.00 Smart Investing & Trading Score: 0 | |
| Day Percent Change: 3.27% Day Change: 3.74 | |
| Week Change: 2.44% Year-to-date Change: -10.8% | |
| SLAB Links: Profile News Message Board | |
| Charts:- Daily , Weekly | |
| Add SLAB to Watchlist: View: Get Complete SLAB Trend Analysis ➞ | |
 | FENG Phoenix New Media Limited |
| Sector: Technology | |
| SubSector: Internet Information Providers | |
| MarketCap: 107.08 Millions | |
| Recent Price: 1.81 Smart Investing & Trading Score: 53 | |
| Day Percent Change: 2.84% Day Change: 0.05 | |
| Week Change: -0.55% Year-to-date Change: 33.1% | |
| FENG Links: Profile News Message Board | |
| Charts:- Daily , Weekly | |
| Add FENG to Watchlist: View: Get Complete FENG Trend Analysis ➞ | |
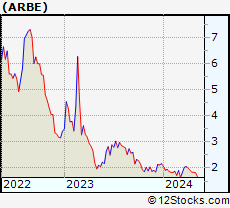 | ARBE Arbe Robotics Ltd. |
| Sector: Technology | |
| SubSector: Software - Infrastructure | |
| MarketCap: 200 Millions | |
| Recent Price: 1.85 Smart Investing & Trading Score: 27 | |
| Day Percent Change: 2.78% Day Change: 0.05 | |
| Week Change: 0.54% Year-to-date Change: -14.8% | |
| ARBE Links: Profile News Message Board | |
| Charts:- Daily , Weekly | |
| Add ARBE to Watchlist: View: Get Complete ARBE Trend Analysis ➞ | |
 | AVGO Broadcom Inc. |
| Sector: Technology | |
| SubSector: Semiconductor - Broad Line | |
| MarketCap: 86329.1 Millions | |
| Recent Price: 1289.45 Smart Investing & Trading Score: 58 | |
| Day Percent Change: 2.60% Day Change: 32.63 | |
| Week Change: 7.03% Year-to-date Change: 15.5% | |
| AVGO Links: Profile News Message Board | |
| Charts:- Daily , Weekly | |
| Add AVGO to Watchlist: View: Get Complete AVGO Trend Analysis ➞ | |
 | MRVL Marvell Technology Group Ltd. |
| Sector: Technology | |
| SubSector: Semiconductor - Integrated Circuits | |
| MarketCap: 14090.4 Millions | |
| Recent Price: 66.44 Smart Investing & Trading Score: 32 | |
| Day Percent Change: 2.45% Day Change: 1.59 | |
| Week Change: 6.94% Year-to-date Change: 10.2% | |
| MRVL Links: Profile News Message Board | |
| Charts:- Daily , Weekly | |
| Add MRVL to Watchlist: View: Get Complete MRVL Trend Analysis ➞ | |
 | FORM FormFactor, Inc. |
| Sector: Technology | |
| SubSector: Semiconductor - Broad Line | |
| MarketCap: 1426.42 Millions | |
| Recent Price: 42.67 Smart Investing & Trading Score: 58 | |
| Day Percent Change: 2.28% Day Change: 0.95 | |
| Week Change: 4.69% Year-to-date Change: 2.3% | |
| FORM Links: Profile News Message Board | |
| Charts:- Daily , Weekly | |
| Add FORM to Watchlist: View: Get Complete FORM Trend Analysis ➞ | |
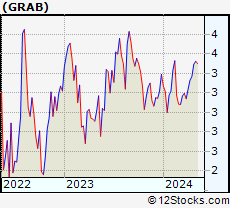 | GRAB Grab Holdings Limited |
| Sector: Technology | |
| SubSector: Software - Application | |
| MarketCap: 12780 Millions | |
| Recent Price: 3.48 Smart Investing & Trading Score: 100 | |
| Day Percent Change: 1.90% Day Change: 0.06 | |
| Week Change: 3.41% Year-to-date Change: 2.8% | |
| GRAB Links: Profile News Message Board | |
| Charts:- Daily , Weekly | |
| Add GRAB to Watchlist: View: Get Complete GRAB Trend Analysis ➞ | |
 | CLS Celestica Inc. |
| Sector: Technology | |
| SubSector: Printed Circuit Boards | |
| MarketCap: 474.235 Millions | |
| Recent Price: 44.92 Smart Investing & Trading Score: 56 | |
| Day Percent Change: 1.86% Day Change: 0.82 | |
| Week Change: 10.29% Year-to-date Change: 53.4% | |
| CLS Links: Profile News Message Board | |
| Charts:- Daily , Weekly | |
| Add CLS to Watchlist: View: Get Complete CLS Trend Analysis ➞ | |
 | LRCX Lam Research Corporation |
| Sector: Technology | |
| SubSector: Semiconductor Equipment & Materials | |
| MarketCap: 31806 Millions | |
| Recent Price: 901.33 Smart Investing & Trading Score: 58 | |
| Day Percent Change: 1.86% Day Change: 16.44 | |
| Week Change: 3.57% Year-to-date Change: 15.1% | |
| LRCX Links: Profile News Message Board | |
| Charts:- Daily , Weekly | |
| Add LRCX to Watchlist: View: Get Complete LRCX Trend Analysis ➞ | |
 | ANET Arista Networks, Inc. |
| Sector: Technology | |
| SubSector: Diversified Computer Systems | |
| MarketCap: 14071.2 Millions | |
| Recent Price: 258.70 Smart Investing & Trading Score: 32 | |
| Day Percent Change: 1.54% Day Change: 3.93 | |
| Week Change: 5.12% Year-to-date Change: 9.9% | |
| ANET Links: Profile News Message Board | |
| Charts:- Daily , Weekly | |
| Add ANET to Watchlist: View: Get Complete ANET Trend Analysis ➞ | |
 | TDY Teledyne Technologies Incorporated |
| Sector: Technology | |
| SubSector: Scientific & Technical Instruments | |
| MarketCap: 9360.43 Millions | |
| Recent Price: 367.94 Smart Investing & Trading Score: 0 | |
| Day Percent Change: 1.50% Day Change: 5.44 | |
| Week Change: -8.33% Year-to-date Change: -17.6% | |
| TDY Links: Profile News Message Board | |
| Charts:- Daily , Weekly | |
| Add TDY to Watchlist: View: Get Complete TDY Trend Analysis ➞ | |
 | NVDA NVIDIA Corporation |
| Sector: Technology | |
| SubSector: Semiconductor - Specialized | |
| MarketCap: 143476 Millions | |
| Recent Price: 807.49 Smart Investing & Trading Score: 56 | |
| Day Percent Change: 1.35% Day Change: 10.72 | |
| Week Change: 5.97% Year-to-date Change: 63.1% | |
| NVDA Links: Profile News Message Board | |
| Charts:- Daily , Weekly | |
| Add NVDA to Watchlist: View: Get Complete NVDA Trend Analysis ➞ | |
| For tabular summary view of above stock list: Summary View ➞ 0 - 25 , 25 - 50 , 50 - 75 , 75 - 100 , 100 - 125 , 125 - 150 , 150 - 175 , 175 - 200 , 200 - 225 , 225 - 250 , 250 - 275 , 275 - 300 , 300 - 325 , 325 - 350 , 350 - 375 , 375 - 400 , 400 - 425 , 425 - 450 , 450 - 475 , 475 - 500 , 500 - 525 , 525 - 550 , 550 - 575 , 575 - 600 , 600 - 625 | ||
| Click To Change The Sort Order: By Market Cap or Company Size Performance: Year-to-date, Week and Day | |
| Select Chart Type: | ||
|
Best Stocks Today 12Stocks.com |
© 2024 12Stocks.com Terms & Conditions Privacy Contact Us
All Information Provided Only For Education And Not To Be Used For Investing or Trading. See Terms & Conditions


One More Thing ... Get Best Stocks Delivered Daily!
Never Ever Miss A Move With Our Top Ten Stocks Lists
Find Best Stocks In Any Market - Bull or Bear Market
Take A Peek At Our Top Ten Stocks Lists: Daily, Weekly, Year-to-Date & Top Trends
Find Best Stocks In Any Market - Bull or Bear Market
Take A Peek At Our Top Ten Stocks Lists: Daily, Weekly, Year-to-Date & Top Trends
Technology Stocks With Best Up Trends [0-bearish to 100-bullish]: Karooooo [100], HashiCorp [100], Ribbon [100], Grab [100], Diodes [100], NextNav [100], Analog Devices[100], Turkcell Iletisim[100], Microchip [100], Allegro MicroSystems[100], Texas [100]
Best Technology Stocks Year-to-Date:
Pagaya [555.47%], MediaCo Holding[390.61%], Uxin [182.45%], Super Micro[163.77%], CXApp [159.07%], NextNav [96.85%], MicroStrategy [95.55%], CuriosityStream [94.41%], GigaCloud [89.9%], SoundHound AI[84.35%], Cheetah Mobile[81.58%] Best Technology Stocks This Week:
Matterport [166.09%], Amesite [66.64%], HashiCorp [37.38%], WiMi Hologram[34.65%], Ribbon [32.95%], Impinj [19.61%], Uxin [17.16%], Cheetah Mobile[16.95%], Karooooo [15.36%], iQIYI [14.69%], Tyler [14.26%] Best Technology Stocks Daily:
Impinj [15.06%], Karooooo [14.20%], HashiCorp [11.06%], Tyler [9.99%], Xiao-I [6.35%], MediaCo Holding[5.56%], Ribbon [5.54%], Teradyne [5.44%], CACI [4.99%], Viomi [4.99%], Uxin [4.76%]