
 Login Sign Up


| |||||
 |  | ||||

| 12Stocks.com Market Intelligence |
Best Tech Stocks
| In a hurry? Tech Stocks Lists: Performance & Trends, Stock Charts, FANG Stocks
Sort Tech stocks: Daily, Weekly, Year-to-Date, Market Cap & Trends. Filter Tech stocks list by size:All Tech Large Mid-Range Small and MicroCap |
| 12Stocks.com Tech Stocks Performances & Trends Daily | |||||||||
|
|  The overall Smart Investing & Trading Score is 45 (0-bearish to 100-bullish) which puts Technology sector in short term neutral trend. The Smart Investing & Trading Score from previous trading session is 38 and hence an improvement of trend.
| ||||||||
Here are the Smart Investing & Trading Scores of the most requested Technology stocks at 12Stocks.com (click stock name for detailed review):
|


| 12Stocks.com: Investing in Technology sector with Stocks | |
|
The following table helps investors and traders sort through current performance and trends (as measured by Smart Investing & Trading Score) of various
stocks in the Tech sector. Quick View: Move mouse or cursor over stock symbol (ticker) to view short-term technical chart and over stock name to view long term chart. Click on  to add stock symbol to your watchlist and to add stock symbol to your watchlist and  to view watchlist. Click on any ticker or stock name for detailed market intelligence report for that stock. to view watchlist. Click on any ticker or stock name for detailed market intelligence report for that stock. |
12Stocks.com Performance of Stocks in Tech Sector
| Ticker | Stock Name | Watchlist | Category | Recent Price | Smart Investing & Trading Score | Change % | Weekly Change% |
| EVCM | EverCommerce |   | Software - Infrastructure | 9.46 | 69 | 1.45% | 7.08% |
| PLAB | Photronics | | Semiconductor | 27.10 | 42 | 0.52% | 7.03% |
| ALGM | Allegro MicroSystems | | Semiconductors | 28.34 | 100 | 6.66% | 7.02% |
| SMTC | Semtech | | Semiconductor | 33.23 | 95 | 1.79% | 7.00% |
| GCT | GigaCloud | | Software - Infrastructure | 37.11 | 81 | 0.32% | 6.98% |
| SAP | SAP SE | | Software | 188.03 | 75 | 0.01% | 6.97% |
| NN | NextNav | | Software - Infrastructure | 8.72 | 100 | 0.75% | 6.86% |
| SABR | Sabre | | IT | 2.65 | 39 | -3.99% | 6.85% |
| YMM | Full Truck | | Software - | 8.30 | 100 | 1.72% | 6.82% |
| SEMR | Semrush | | Software - | 12.27 | 73 | 0.16% | 6.70% |
| PUBM | PubMatic | | Software | 23.04 | 75 | 1.01% | 6.62% |
| SYNA | Synaptics | | Software | 86.40 | 42 | 3.52% | 6.61% |
| SKYT | SkyWater | | Semiconductors | 8.94 | 51 | -1.32% | 6.56% |
| ATEN | A10 Networks | | Communication | 13.79 | 100 | 2.34% | 6.53% |
| S | SentinelOne | | Software - Infrastructure | 21.34 | 42 | 0.76% | 6.43% |
| ARQQ | Arqit Quantum | | Software - Infrastructure | 0.50 | 46 | -0.38% | 6.38% |
| FROG | JFrog | | Software | 39.80 | 65 | 1.61% | 6.36% |
| SMCI | Super Micro | | Networking | 757.77 | 58 | -0.54% | 6.18% |
| CFLT | Confluent | | Software - Infrastructure | 28.54 | 58 | 0.11% | 6.14% |
| HBB | Hamilton Beach | | Electronic | 22.42 | 68 | -1.58% | 6.11% |
| CRDO | Credo | | Communication | 17.95 | 32 | 2.22% | 6.09% |
| QRVO | Qorvo | | Semiconductor | 111.24 | 70 | 3.02% | 6.06% |
| ICG | Intchains | | Semiconductors | 8.80 | 52 | 7.71% | 6.02% |
| KC | Kingsoft Cloud | | Software | 2.83 | 80 | -0.18% | 6.00% |
| TOST | Toast | | Software - Infrastructure | 22.91 | 68 | -1.19% | 5.99% |
| For chart view version of above stock list: Chart View ➞ 0 - 25 , 25 - 50 , 50 - 75 , 75 - 100 , 100 - 125 , 125 - 150 , 150 - 175 , 175 - 200 , 200 - 225 , 225 - 250 , 250 - 275 , 275 - 300 , 300 - 325 , 325 - 350 , 350 - 375 , 375 - 400 , 400 - 425 , 425 - 450 , 450 - 475 , 475 - 500 , 500 - 525 , 525 - 550 , 550 - 575 | ||
 | Click To Change The Sort Order: By Market Cap or Company Size Performance: Year-to-date, Week and Day |  |
|
Get the most comprehensive stock market coverage daily at 12Stocks.com ➞ Best Stocks Today ➞ Best Stocks Weekly ➞ Best Stocks Year-to-Date ➞ Best Stocks Trends ➞  Best Stocks Today 12Stocks.com Best Nasdaq Stocks ➞ Best S&P 500 Stocks ➞ Best Tech Stocks ➞ Best Biotech Stocks ➞ |
| Detailed Overview of Tech Stocks |
| Tech Technical Overview, Leaders & Laggards, Top Tech ETF Funds & Detailed Tech Stocks List, Charts, Trends & More |
| Tech Sector: Technical Analysis, Trends & YTD Performance | |
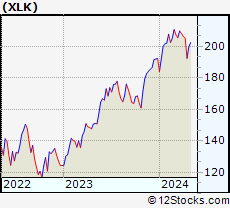
| Technology sector is composed of stocks
from semiconductors, software, web, social media
and services subsectors. Technology sector, as represented by XLK, an exchange-traded fund [ETF] that holds basket of tech stocks (e.g, Intel, Google) is up by 2.82% and is currently underperforming the overall market by -2.52% year-to-date. Below is a quick view of technical charts and trends: |
|
 XLK Weekly Chart |
|
| Long Term Trend: Good | |
| Medium Term Trend: Not Good | |
 XLK Daily Chart |
|
| Short Term Trend: Very Good | |
| Overall Trend Score: 45 | |
| YTD Performance: 2.82% | |
| **Trend Scores & Views Are Only For Educational Purposes And Not For Investing | |
| 12Stocks.com: Top Performing Technology Sector Stocks | ||||||||||||||||||||||||||||||||||||||||||||||||
 The top performing Technology sector stocks year to date are
Now, more recently, over last week, the top performing Technology sector stocks on the move are


|
||||||||||||||||||||||||||||||||||||||||||||||||
| 12Stocks.com: Investing in Tech Sector using Exchange Traded Funds | |
|
The following table shows list of key exchange traded funds (ETF) that
help investors track Tech Index. For detailed view, check out our ETF Funds section of our website. Quick View: Move mouse or cursor over ETF symbol (ticker) to view short-term technical chart and over ETF name to view long term chart. Click on ticker or stock name for detailed view. Click on to add stock symbol to your watchlist and to view watchlist. |
12Stocks.com List of ETFs that track Tech Index
| Ticker | ETF Name | Watchlist | Recent Price | Smart Investing & Trading Score | Change % | Week % | Year-to-date % |
| XLK | Technology | | 197.91 | 45 | 0.39 | 2.79 | 2.82% |
| QQQ | QQQ | | 428.36 | 58 | 0.77 | 3.31 | 4.6% |
| TQQQ | QQQ | | 53.69 | 58 | 0.94 | 8.51 | 5.9% |
| SQQQ | Short QQQ | | 11.82 | 37 | -0.76 | -7.94 | -12.12% |
| SOXL | Semicondct Bull 3X | | 35.63 | 58 | 4.44 | 15.7 | 13.46% |
| SOXS | Semicondct Bear 3X | | 38.25 | 58 | -7.12 | -17.08 | 557.22% |
| SMH | Semiconductor | | 209.37 | 58 | 0.75 | 5.1 | 19.73% |
| 12Stocks.com: Charts, Trends, Fundamental Data and Performances of Tech Stocks | |
|
We now take in-depth look at all Tech stocks including charts, multi-period performances and overall trends (as measured by Smart Investing & Trading Score). One can sort Tech stocks (click link to choose) by Daily, Weekly and by Year-to-Date performances. Also, one can sort by size of the company or by market capitalization. |
| Select Your Default Chart Type: | |||||
| |||||
| Click on stock symbol or name for detailed view. Click on to add stock symbol to your watchlist and to view watchlist. Quick View: Move mouse or cursor over "Daily" to quickly view daily technical stock chart and over "Weekly" to view weekly technical stock chart. | |||||


 | EVCM EverCommerce Inc. |
| Sector: Technology | |
| SubSector: Software - Infrastructure | |
| MarketCap: 2210 Millions | |
| Recent Price: 9.46 Smart Investing & Trading Score: 69 | |
| Day Percent Change: 1.45% Day Change: 0.13 | |
| Week Change: 7.08% Year-to-date Change: -15.0% | |
| EVCM Links: Profile News Message Board | |
| Charts:- Daily , Weekly | |
| Add EVCM to Watchlist: View: Get Complete EVCM Trend Analysis ➞ | |
 | PLAB Photronics, Inc. |
| Sector: Technology | |
| SubSector: Semiconductor Equipment & Materials | |
| MarketCap: 709.018 Millions | |
| Recent Price: 27.10 Smart Investing & Trading Score: 42 | |
| Day Percent Change: 0.52% Day Change: 0.14 | |
| Week Change: 7.03% Year-to-date Change: -13.6% | |
| PLAB Links: Profile News Message Board | |
| Charts:- Daily , Weekly | |
| Add PLAB to Watchlist: View: Get Complete PLAB Trend Analysis ➞ | |
 | ALGM Allegro MicroSystems, Inc. |
| Sector: Technology | |
| SubSector: Semiconductors | |
| MarketCap: 50287 Millions | |
| Recent Price: 28.34 Smart Investing & Trading Score: 100 | |
| Day Percent Change: 6.66% Day Change: 1.77 | |
| Week Change: 7.02% Year-to-date Change: -6.4% | |
| ALGM Links: Profile News Message Board | |
| Charts:- Daily , Weekly | |
| Add ALGM to Watchlist: View: Get Complete ALGM Trend Analysis ➞ | |
 | SMTC Semtech Corporation |
| Sector: Technology | |
| SubSector: Semiconductor - Integrated Circuits | |
| MarketCap: 2285 Millions | |
| Recent Price: 33.23 Smart Investing & Trading Score: 95 | |
| Day Percent Change: 1.79% Day Change: 0.59 | |
| Week Change: 7% Year-to-date Change: 51.6% | |
| SMTC Links: Profile News Message Board | |
| Charts:- Daily , Weekly | |
| Add SMTC to Watchlist: View: Get Complete SMTC Trend Analysis ➞ | |
 | GCT GigaCloud Technology Inc. |
| Sector: Technology | |
| SubSector: Software - Infrastructure | |
| MarketCap: 240 Millions | |
| Recent Price: 37.11 Smart Investing & Trading Score: 81 | |
| Day Percent Change: 0.32% Day Change: 0.12 | |
| Week Change: 6.98% Year-to-date Change: 102.7% | |
| GCT Links: Profile News Message Board | |
| Charts:- Daily , Weekly | |
| Add GCT to Watchlist: View: Get Complete GCT Trend Analysis ➞ | |
 | SAP SAP SE |
| Sector: Technology | |
| SubSector: Application Software | |
| MarketCap: 129635 Millions | |
| Recent Price: 188.03 Smart Investing & Trading Score: 75 | |
| Day Percent Change: 0.01% Day Change: 0.02 | |
| Week Change: 6.97% Year-to-date Change: 21.6% | |
| SAP Links: Profile News Message Board | |
| Charts:- Daily , Weekly | |
| Add SAP to Watchlist: View: Get Complete SAP Trend Analysis ➞ | |
 | NN NextNav Inc. |
| Sector: Technology | |
| SubSector: Software - Infrastructure | |
| MarketCap: 314 Millions | |
| Recent Price: 8.72 Smart Investing & Trading Score: 100 | |
| Day Percent Change: 0.75% Day Change: 0.07 | |
| Week Change: 6.86% Year-to-date Change: 96.0% | |
| NN Links: Profile News Message Board | |
| Charts:- Daily , Weekly | |
| Add NN to Watchlist: View: Get Complete NN Trend Analysis ➞ | |
 | SABR Sabre Corporation |
| Sector: Technology | |
| SubSector: Information Technology Services | |
| MarketCap: 152.468 Millions | |
| Recent Price: 2.65 Smart Investing & Trading Score: 39 | |
| Day Percent Change: -3.99% Day Change: -0.11 | |
| Week Change: 6.85% Year-to-date Change: -39.8% | |
| SABR Links: Profile News Message Board | |
| Charts:- Daily , Weekly | |
| Add SABR to Watchlist: View: Get Complete SABR Trend Analysis ➞ | |
 | YMM Full Truck Alliance Co. Ltd. |
| Sector: Technology | |
| SubSector: Software - Application | |
| MarketCap: 6960 Millions | |
| Recent Price: 8.30 Smart Investing & Trading Score: 100 | |
| Day Percent Change: 1.72% Day Change: 0.14 | |
| Week Change: 6.82% Year-to-date Change: 18.7% | |
| YMM Links: Profile News Message Board | |
| Charts:- Daily , Weekly | |
| Add YMM to Watchlist: View: Get Complete YMM Trend Analysis ➞ | |
 | SEMR Semrush Holdings, Inc. |
| Sector: Technology | |
| SubSector: Software - Application | |
| MarketCap: 1330 Millions | |
| Recent Price: 12.27 Smart Investing & Trading Score: 73 | |
| Day Percent Change: 0.16% Day Change: 0.02 | |
| Week Change: 6.7% Year-to-date Change: -11.7% | |
| SEMR Links: Profile News Message Board | |
| Charts:- Daily , Weekly | |
| Add SEMR to Watchlist: View: Get Complete SEMR Trend Analysis ➞ | |
 | PUBM PubMatic, Inc. |
| Sector: Technology | |
| SubSector: Software Application | |
| MarketCap: 56787 Millions | |
| Recent Price: 23.04 Smart Investing & Trading Score: 75 | |
| Day Percent Change: 1.01% Day Change: 0.23 | |
| Week Change: 6.62% Year-to-date Change: 41.4% | |
| PUBM Links: Profile News Message Board | |
| Charts:- Daily , Weekly | |
| Add PUBM to Watchlist: View: Get Complete PUBM Trend Analysis ➞ | |
 | SYNA Synaptics Incorporated |
| Sector: Technology | |
| SubSector: Application Software | |
| MarketCap: 1822.82 Millions | |
| Recent Price: 86.40 Smart Investing & Trading Score: 42 | |
| Day Percent Change: 3.52% Day Change: 2.94 | |
| Week Change: 6.61% Year-to-date Change: -24.3% | |
| SYNA Links: Profile News Message Board | |
| Charts:- Daily , Weekly | |
| Add SYNA to Watchlist: View: Get Complete SYNA Trend Analysis ➞ | |
 | SKYT SkyWater Technology, Inc. |
| Sector: Technology | |
| SubSector: Semiconductors | |
| MarketCap: 394 Millions | |
| Recent Price: 8.94 Smart Investing & Trading Score: 51 | |
| Day Percent Change: -1.32% Day Change: -0.12 | |
| Week Change: 6.56% Year-to-date Change: -7.3% | |
| SKYT Links: Profile News Message Board | |
| Charts:- Daily , Weekly | |
| Add SKYT to Watchlist: View: Get Complete SKYT Trend Analysis ➞ | |
 | ATEN A10 Networks, Inc. |
| Sector: Technology | |
| SubSector: Communication Equipment | |
| MarketCap: 363.739 Millions | |
| Recent Price: 13.79 Smart Investing & Trading Score: 100 | |
| Day Percent Change: 2.34% Day Change: 0.31 | |
| Week Change: 6.53% Year-to-date Change: 4.7% | |
| ATEN Links: Profile News Message Board | |
| Charts:- Daily , Weekly | |
| Add ATEN to Watchlist: View: Get Complete ATEN Trend Analysis ➞ | |
 | S SentinelOne, Inc. |
| Sector: Technology | |
| SubSector: Software - Infrastructure | |
| MarketCap: 4420 Millions | |
| Recent Price: 21.34 Smart Investing & Trading Score: 42 | |
| Day Percent Change: 0.76% Day Change: 0.16 | |
| Week Change: 6.43% Year-to-date Change: -22.2% | |
| S Links: Profile News Message Board | |
| Charts:- Daily , Weekly | |
| Add S to Watchlist: View: Get Complete S Trend Analysis ➞ | |
 | ARQQ Arqit Quantum Inc. |
| Sector: Technology | |
| SubSector: Software - Infrastructure | |
| MarketCap: 165 Millions | |
| Recent Price: 0.50 Smart Investing & Trading Score: 46 | |
| Day Percent Change: -0.38% Day Change: 0.00 | |
| Week Change: 6.38% Year-to-date Change: 9.8% | |
| ARQQ Links: Profile News Message Board | |
| Charts:- Daily , Weekly | |
| Add ARQQ to Watchlist: View: Get Complete ARQQ Trend Analysis ➞ | |
 | FROG JFrog Ltd. |
| Sector: Technology | |
| SubSector: Software Application | |
| MarketCap: 62287 Millions | |
| Recent Price: 39.80 Smart Investing & Trading Score: 65 | |
| Day Percent Change: 1.61% Day Change: 0.63 | |
| Week Change: 6.36% Year-to-date Change: 15.0% | |
| FROG Links: Profile News Message Board | |
| Charts:- Daily , Weekly | |
| Add FROG to Watchlist: View: Get Complete FROG Trend Analysis ➞ | |
 | SMCI Super Micro Computer, Inc. |
| Sector: Technology | |
| SubSector: Networking & Communication Devices | |
| MarketCap: 1200.02 Millions | |
| Recent Price: 757.77 Smart Investing & Trading Score: 58 | |
| Day Percent Change: -0.54% Day Change: -4.09 | |
| Week Change: 6.18% Year-to-date Change: 166.6% | |
| SMCI Links: Profile News Message Board | |
| Charts:- Daily , Weekly | |
| Add SMCI to Watchlist: View: Get Complete SMCI Trend Analysis ➞ | |
 | CFLT Confluent, Inc. |
| Sector: Technology | |
| SubSector: Software - Infrastructure | |
| MarketCap: 10820 Millions | |
| Recent Price: 28.54 Smart Investing & Trading Score: 58 | |
| Day Percent Change: 0.11% Day Change: 0.03 | |
| Week Change: 6.14% Year-to-date Change: 20.2% | |
| CFLT Links: Profile News Message Board | |
| Charts:- Daily , Weekly | |
| Add CFLT to Watchlist: View: Get Complete CFLT Trend Analysis ➞ | |
 | HBB Hamilton Beach Brands Holding Company |
| Sector: Technology | |
| SubSector: Electronic Equipment | |
| MarketCap: 105.7 Millions | |
| Recent Price: 22.42 Smart Investing & Trading Score: 68 | |
| Day Percent Change: -1.58% Day Change: -0.36 | |
| Week Change: 6.11% Year-to-date Change: 28.2% | |
| HBB Links: Profile News Message Board | |
| Charts:- Daily , Weekly | |
| Add HBB to Watchlist: View: Get Complete HBB Trend Analysis ➞ | |
 | CRDO Credo Technology Group Holding Ltd |
| Sector: Technology | |
| SubSector: Communication Equipment | |
| MarketCap: 2590 Millions | |
| Recent Price: 17.95 Smart Investing & Trading Score: 32 | |
| Day Percent Change: 2.22% Day Change: 0.39 | |
| Week Change: 6.09% Year-to-date Change: -8.2% | |
| CRDO Links: Profile News Message Board | |
| Charts:- Daily , Weekly | |
| Add CRDO to Watchlist: View: Get Complete CRDO Trend Analysis ➞ | |
 | QRVO Qorvo, Inc. |
| Sector: Technology | |
| SubSector: Semiconductor - Broad Line | |
| MarketCap: 9524.32 Millions | |
| Recent Price: 111.24 Smart Investing & Trading Score: 70 | |
| Day Percent Change: 3.02% Day Change: 3.26 | |
| Week Change: 6.06% Year-to-date Change: -1.2% | |
| QRVO Links: Profile News Message Board | |
| Charts:- Daily , Weekly | |
| Add QRVO to Watchlist: View: Get Complete QRVO Trend Analysis ➞ | |
 | ICG Intchains Group Limited |
| Sector: Technology | |
| SubSector: Semiconductors | |
| MarketCap: 450 Millions | |
| Recent Price: 8.80 Smart Investing & Trading Score: 52 | |
| Day Percent Change: 7.71% Day Change: 0.63 | |
| Week Change: 6.02% Year-to-date Change: -28.5% | |
| ICG Links: Profile News Message Board | |
| Charts:- Daily , Weekly | |
| Add ICG to Watchlist: View: Get Complete ICG Trend Analysis ➞ | |
 | KC Kingsoft Cloud Holdings Limited |
| Sector: Technology | |
| SubSector: Software Application | |
| MarketCap: 98487 Millions | |
| Recent Price: 2.83 Smart Investing & Trading Score: 80 | |
| Day Percent Change: -0.18% Day Change: 0.00 | |
| Week Change: 6% Year-to-date Change: -25.4% | |
| KC Links: Profile News Message Board | |
| Charts:- Daily , Weekly | |
| Add KC to Watchlist: View: Get Complete KC Trend Analysis ➞ | |
 | TOST Toast, Inc. |
| Sector: Technology | |
| SubSector: Software - Infrastructure | |
| MarketCap: 11680 Millions | |
| Recent Price: 22.91 Smart Investing & Trading Score: 68 | |
| Day Percent Change: -1.19% Day Change: -0.28 | |
| Week Change: 5.99% Year-to-date Change: 25.2% | |
| TOST Links: Profile News Message Board | |
| Charts:- Daily , Weekly | |
| Add TOST to Watchlist: View: Get Complete TOST Trend Analysis ➞ | |
| For tabular summary view of above stock list: Summary View ➞ 0 - 25 , 25 - 50 , 50 - 75 , 75 - 100 , 100 - 125 , 125 - 150 , 150 - 175 , 175 - 200 , 200 - 225 , 225 - 250 , 250 - 275 , 275 - 300 , 300 - 325 , 325 - 350 , 350 - 375 , 375 - 400 , 400 - 425 , 425 - 450 , 450 - 475 , 475 - 500 , 500 - 525 , 525 - 550 , 550 - 575 | ||
| Click To Change The Sort Order: By Market Cap or Company Size Performance: Year-to-date, Week and Day | |
| Select Chart Type: | ||
|
Best Stocks Today 12Stocks.com |
© 2024 12Stocks.com Terms & Conditions Privacy Contact Us
All Information Provided Only For Education And Not To Be Used For Investing or Trading. See Terms & Conditions


One More Thing ... Get Best Stocks Delivered Daily!
Never Ever Miss A Move With Our Top Ten Stocks Lists
Find Best Stocks In Any Market - Bull or Bear Market
Take A Peek At Our Top Ten Stocks Lists: Daily, Weekly, Year-to-Date & Top Trends
Find Best Stocks In Any Market - Bull or Bear Market
Take A Peek At Our Top Ten Stocks Lists: Daily, Weekly, Year-to-Date & Top Trends
Technology Stocks With Best Up Trends [0-bearish to 100-bullish]: Ribbon [100], Allegro MicroSystems[100], Texas [100], Analog Devices[100], Microchip [100], JD.com [100], A10 Networks[100], Full Truck[100], Jamf Holding[100], HashiCorp [100], NextNav [100]
Best Technology Stocks Year-to-Date:
Pagaya [581.02%], MediaCo Holding[402.35%], Super Micro[166.58%], Smith Micro[166.34%], CXApp [163.32%], Uxin [146.79%], MicroStrategy [104.08%], SoundHound AI[103.27%], GigaCloud [102.68%], CuriosityStream [99.96%], NextNav [95.96%] Best Technology Stocks This Week:
Matterport [166.09%], Amesite [55.87%], Ribbon [29.84%], WiMi Hologram[29.01%], HashiCorp [23.7%], SoundHound AI[22.54%], BigBear.ai [17.24%], IonQ [16.36%], Akoustis [15.88%], on [15.77%], Navitas Semiconductor[13.46%] Best Technology Stocks Daily:
Amesite [52.00%], Ribbon [30.35%], WiMi Hologram[24.07%], Navitas Semiconductor[8.83%], AMTD Digital[8.33%], Intchains [7.71%], MediaCo Holding[7.54%], Allegro MicroSystems[6.66%], Texas [6.40%], Quantum [5.66%], ON Semiconductor[5.52%]