
 Login Sign Up


| |||||
 |  | ||||

| 12Stocks.com Market Intelligence |
Best Tech Stocks
| In a hurry? Tech Stocks Lists: Performance & Trends, Stock Charts, FANG Stocks
Sort Tech stocks: Daily, Weekly, Year-to-Date, Market Cap & Trends. Filter Tech stocks list by size:All Tech Large Mid-Range Small and MicroCap |
| 12Stocks.com Tech Stocks Performances & Trends Daily | |||||||||
|
|  The overall Smart Investing & Trading Score is 13 (0-bearish to 100-bullish) which puts Technology sector in short term bearish trend. The Smart Investing & Trading Score from previous trading session is 26 and hence a deterioration of trend.
| ||||||||
Here are the Smart Investing & Trading Scores of the most requested Technology stocks at 12Stocks.com (click stock name for detailed review):
|


| 12Stocks.com: Investing in Technology sector with Stocks | |
|
The following table helps investors and traders sort through current performance and trends (as measured by Smart Investing & Trading Score) of various
stocks in the Tech sector. Quick View: Move mouse or cursor over stock symbol (ticker) to view short-term technical chart and over stock name to view long term chart. Click on  to add stock symbol to your watchlist and to add stock symbol to your watchlist and  to view watchlist. Click on any ticker or stock name for detailed market intelligence report for that stock. to view watchlist. Click on any ticker or stock name for detailed market intelligence report for that stock. |
12Stocks.com Performance of Stocks in Tech Sector
| Ticker | Stock Name | Watchlist | Category | Recent Price | Smart Investing & Trading Score | Change % | Weekly Change% |
| HBB | Hamilton Beach |   | Electronic | 22.16 | 36 | -6.10% | -4.11% |
| CRNT | Ceragon Networks | | Communication | 2.79 | 43 | 1.09% | -4.12% |
| OOMA | Ooma | | Communication | 7.09 | 10 | 0.50% | -4.12% |
| ZM | Zoom Video | | Software | 59.08 | 0 | -0.34% | -4.14% |
| FN | Fabrinet | | Electronic | 166.12 | 0 | -3.89% | -4.16% |
| OPRA | Opera | | Internet | 14.52 | 43 | -3.39% | -4.16% |
| ESE | ESCO | | Instruments | 97.26 | 0 | -1.64% | -4.18% |
| ZG | Zillow | | Internet | 41.88 | 7 | -1.92% | -4.19% |
| NOW | ServiceNow | | IT | 736.45 | 0 | -1.12% | -4.20% |
| Z | Zillow | | Internet | 42.54 | 7 | -1.82% | -4.23% |
| AEIS | Advanced Energy | | Electronics | 92.43 | 0 | -2.65% | -4.24% |
| PGNY | Progyny | | Healthcare Information | 32.75 | 0 | -1.92% | -4.24% |
| ENPH | Enphase Energy | | Semiconductor | 112.05 | 43 | 1.45% | -4.25% |
| HCP | HashiCorp | | Software - Infrastructure | 23.50 | 48 | -0.68% | -4.28% |
| EGHT | 8x8 | | Communication | 2.23 | 0 | -2.62% | -4.29% |
| VECO | Veeco | | Semiconductor | 34.46 | 26 | -5.38% | -4.30% |
| MNDY | monday.com | | Software - | 184.76 | 10 | -1.68% | -4.32% |
| INFY | Infosys | | IT | 16.95 | 0 | -0.59% | -4.35% |
| LUMN | Lumen | | Telecom | 1.32 | 36 | -0.75% | -4.35% |
| TDS | Telephone and | | Wireless | 14.96 | 17 | -0.66% | -4.41% |
| ANET | Arista Networks | | Computer | 259.27 | 13 | -1.33% | -4.41% |
| UCTT | Ultra Clean | | Semiconductor | 41.85 | 36 | -3.62% | -4.43% |
| UBER | Uber | | Software | 71.94 | 26 | -2.95% | -4.44% |
| VSAT | Viasat | | Communication | 15.56 | 17 | 1.37% | -4.48% |
| TOST | Toast | | Software - Infrastructure | 22.75 | 41 | 1.38% | -4.49% |
| For chart view version of above stock list: Chart View ➞ 0 - 25 , 25 - 50 , 50 - 75 , 75 - 100 , 100 - 125 , 125 - 150 , 150 - 175 , 175 - 200 , 200 - 225 , 225 - 250 , 250 - 275 , 275 - 300 , 300 - 325 , 325 - 350 , 350 - 375 , 375 - 400 , 400 - 425 , 425 - 450 , 450 - 475 , 475 - 500 , 500 - 525 , 525 - 550 , 550 - 575 , 575 - 600 , 600 - 625 , 625 - 650 | ||
 | Click To Change The Sort Order: By Market Cap or Company Size Performance: Year-to-date, Week and Day |  |
|
Get the most comprehensive stock market coverage daily at 12Stocks.com ➞ Best Stocks Today ➞ Best Stocks Weekly ➞ Best Stocks Year-to-Date ➞ Best Stocks Trends ➞  Best Stocks Today 12Stocks.com Best Nasdaq Stocks ➞ Best S&P 500 Stocks ➞ Best Tech Stocks ➞ Best Biotech Stocks ➞ |
| Detailed Overview of Tech Stocks |
| Tech Technical Overview, Leaders & Laggards, Top Tech ETF Funds & Detailed Tech Stocks List, Charts, Trends & More |
| Tech Sector: Technical Analysis, Trends & YTD Performance | |
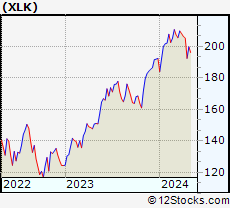
| Technology sector is composed of stocks
from semiconductors, software, web, social media
and services subsectors. Technology sector, as represented by XLK, an exchange-traded fund [ETF] that holds basket of tech stocks (e.g, Intel, Google) is up by 3.31% and is currently underperforming the overall market by -1.1% year-to-date. Below is a quick view of technical charts and trends: |
|
 XLK Weekly Chart |
|
| Long Term Trend: Good | |
| Medium Term Trend: Not Good | |
 XLK Daily Chart |
|
| Short Term Trend: Not Good | |
| Overall Trend Score: 13 | |
| YTD Performance: 3.31% | |
| **Trend Scores & Views Are Only For Educational Purposes And Not For Investing | |
| 12Stocks.com: Top Performing Technology Sector Stocks | ||||||||||||||||||||||||||||||||||||||||||||||||
 The top performing Technology sector stocks year to date are
Now, more recently, over last week, the top performing Technology sector stocks on the move are


|
||||||||||||||||||||||||||||||||||||||||||||||||
| 12Stocks.com: Investing in Tech Sector using Exchange Traded Funds | |
|
The following table shows list of key exchange traded funds (ETF) that
help investors track Tech Index. For detailed view, check out our ETF Funds section of our website. Quick View: Move mouse or cursor over ETF symbol (ticker) to view short-term technical chart and over ETF name to view long term chart. Click on ticker or stock name for detailed view. Click on to add stock symbol to your watchlist and to view watchlist. |
12Stocks.com List of ETFs that track Tech Index
| Ticker | ETF Name | Watchlist | Recent Price | Smart Investing & Trading Score | Change % | Week % | Year-to-date % |
| XLK | Technology | | 198.85 | 13 | -1.44 | -3.2 | 3.31% |
| QQQ | QQQ | | 425.84 | 26 | -1.31 | -2.84 | 3.99% |
| IYW | Technology | | 129.34 | 26 | -1.55 | -3.44 | 5.37% |
| VGT | Information Technology | | 497.69 | 13 | -1.48 | -3.3 | 2.83% |
| IXN | Global Tech | | 71.31 | 26 | -1.75 | -3.37 | 4.59% |
| IGV | Tech-Software | | 80.06 | 0 | -0.79 | -3.26 | -1.32% |
| XSD | Semiconductor | | 214.44 | 26 | -2.18 | -3.91 | -4.6% |
| TQQQ | QQQ | | 53.71 | 26 | -3.71 | -8.53 | 5.94% |
| SQQQ | Short QQQ | | 11.86 | 69 | 3.67 | 8.91 | -11.82% |
| SOXL | Semicondct Bull 3X | | 37.06 | 26 | -8.58 | -10.72 | 18.03% |
| SOXS | Semicondct Bear 3X | | 39.15 | 90 | 8.18 | 1012.22 | 572.68% |
| SOXX | PHLX Semiconductor | | 210.36 | 26 | -2.77 | -3.54 | 9.54% |
| QTEC | First -100-Tech | | 179.73 | 13 | -1.93 | -3.38 | 2.43% |
| SMH | Semiconductor | | 212.40 | 31 | -3.08 | -3.75 | 21.46% |
| 12Stocks.com: Charts, Trends, Fundamental Data and Performances of Tech Stocks | |
|
We now take in-depth look at all Tech stocks including charts, multi-period performances and overall trends (as measured by Smart Investing & Trading Score). One can sort Tech stocks (click link to choose) by Daily, Weekly and by Year-to-Date performances. Also, one can sort by size of the company or by market capitalization. |
| Select Your Default Chart Type: | |||||
| |||||
| Click on stock symbol or name for detailed view. Click on to add stock symbol to your watchlist and to view watchlist. Quick View: Move mouse or cursor over "Daily" to quickly view daily technical stock chart and over "Weekly" to view weekly technical stock chart. | |||||


 | HBB Hamilton Beach Brands Holding Company |
| Sector: Technology | |
| SubSector: Electronic Equipment | |
| MarketCap: 105.7 Millions | |
| Recent Price: 22.16 Smart Investing & Trading Score: 36 | |
| Day Percent Change: -6.10% Day Change: -1.44 | |
| Week Change: -4.11% Year-to-date Change: 26.7% | |
| HBB Links: Profile News Message Board | |
| Charts:- Daily , Weekly | |
| Add HBB to Watchlist: View: Get Complete HBB Trend Analysis ➞ | |
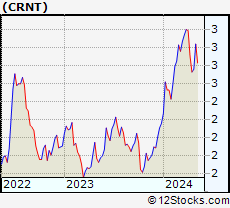 | CRNT Ceragon Networks Ltd. |
| Sector: Technology | |
| SubSector: Communication Equipment | |
| MarketCap: 126.539 Millions | |
| Recent Price: 2.79 Smart Investing & Trading Score: 43 | |
| Day Percent Change: 1.09% Day Change: 0.03 | |
| Week Change: -4.12% Year-to-date Change: 29.2% | |
| CRNT Links: Profile News Message Board | |
| Charts:- Daily , Weekly | |
| Add CRNT to Watchlist: View: Get Complete CRNT Trend Analysis ➞ | |
 | OOMA Ooma, Inc. |
| Sector: Technology | |
| SubSector: Diversified Communication Services | |
| MarketCap: 222.064 Millions | |
| Recent Price: 7.09 Smart Investing & Trading Score: 10 | |
| Day Percent Change: 0.50% Day Change: 0.04 | |
| Week Change: -4.12% Year-to-date Change: -33.9% | |
| OOMA Links: Profile News Message Board | |
| Charts:- Daily , Weekly | |
| Add OOMA to Watchlist: View: Get Complete OOMA Trend Analysis ➞ | |
 | ZM Zoom Video Communications, Inc. |
| Sector: Technology | |
| SubSector: Application Software | |
| MarketCap: 36358.1 Millions | |
| Recent Price: 59.08 Smart Investing & Trading Score: 0 | |
| Day Percent Change: -0.34% Day Change: -0.20 | |
| Week Change: -4.14% Year-to-date Change: -17.8% | |
| ZM Links: Profile News Message Board | |
| Charts:- Daily , Weekly | |
| Add ZM to Watchlist: View: Get Complete ZM Trend Analysis ➞ | |
 | FN Fabrinet |
| Sector: Technology | |
| SubSector: Electronic Equipment | |
| MarketCap: 1876 Millions | |
| Recent Price: 166.12 Smart Investing & Trading Score: 0 | |
| Day Percent Change: -3.89% Day Change: -6.73 | |
| Week Change: -4.16% Year-to-date Change: -12.7% | |
| FN Links: Profile News Message Board | |
| Charts:- Daily , Weekly | |
| Add FN to Watchlist: View: Get Complete FN Trend Analysis ➞ | |
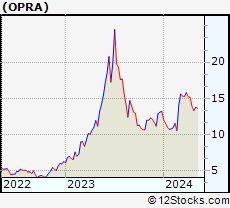 | OPRA Opera Limited |
| Sector: Technology | |
| SubSector: Internet Information Providers | |
| MarketCap: 721.68 Millions | |
| Recent Price: 14.52 Smart Investing & Trading Score: 43 | |
| Day Percent Change: -3.39% Day Change: -0.51 | |
| Week Change: -4.16% Year-to-date Change: 9.8% | |
| OPRA Links: Profile News Message Board | |
| Charts:- Daily , Weekly | |
| Add OPRA to Watchlist: View: Get Complete OPRA Trend Analysis ➞ | |
 | ESE ESCO Technologies Inc. |
| Sector: Technology | |
| SubSector: Scientific & Technical Instruments | |
| MarketCap: 1968.03 Millions | |
| Recent Price: 97.26 Smart Investing & Trading Score: 0 | |
| Day Percent Change: -1.64% Day Change: -1.62 | |
| Week Change: -4.18% Year-to-date Change: -16.9% | |
| ESE Links: Profile News Message Board | |
| Charts:- Daily , Weekly | |
| Add ESE to Watchlist: View: Get Complete ESE Trend Analysis ➞ | |
 | ZG Zillow Group, Inc. |
| Sector: Technology | |
| SubSector: Internet Information Providers | |
| MarketCap: 6536.7 Millions | |
| Recent Price: 41.88 Smart Investing & Trading Score: 7 | |
| Day Percent Change: -1.92% Day Change: -0.82 | |
| Week Change: -4.19% Year-to-date Change: -26.2% | |
| ZG Links: Profile News Message Board | |
| Charts:- Daily , Weekly | |
| Add ZG to Watchlist: View: Get Complete ZG Trend Analysis ➞ | |
 | NOW ServiceNow, Inc. |
| Sector: Technology | |
| SubSector: Information Technology Services | |
| MarketCap: 53599.1 Millions | |
| Recent Price: 736.45 Smart Investing & Trading Score: 0 | |
| Day Percent Change: -1.12% Day Change: -8.33 | |
| Week Change: -4.2% Year-to-date Change: 4.2% | |
| NOW Links: Profile News Message Board | |
| Charts:- Daily , Weekly | |
| Add NOW to Watchlist: View: Get Complete NOW Trend Analysis ➞ | |
 | Z Zillow Group, Inc. |
| Sector: Technology | |
| SubSector: Internet Information Providers | |
| MarketCap: 3880.4 Millions | |
| Recent Price: 42.54 Smart Investing & Trading Score: 7 | |
| Day Percent Change: -1.82% Day Change: -0.79 | |
| Week Change: -4.23% Year-to-date Change: -26.5% | |
| Z Links: Profile News Message Board | |
| Charts:- Daily , Weekly | |
| Add Z to Watchlist: View: Get Complete Z Trend Analysis ➞ | |
 | AEIS Advanced Energy Industries, Inc. |
| Sector: Technology | |
| SubSector: Diversified Electronics | |
| MarketCap: 1641.86 Millions | |
| Recent Price: 92.43 Smart Investing & Trading Score: 0 | |
| Day Percent Change: -2.65% Day Change: -2.52 | |
| Week Change: -4.24% Year-to-date Change: -15.1% | |
| AEIS Links: Profile News Message Board | |
| Charts:- Daily , Weekly | |
| Add AEIS to Watchlist: View: Get Complete AEIS Trend Analysis ➞ | |
 | PGNY Progyny, Inc. |
| Sector: Technology | |
| SubSector: Healthcare Information Services | |
| MarketCap: 1839.05 Millions | |
| Recent Price: 32.75 Smart Investing & Trading Score: 0 | |
| Day Percent Change: -1.92% Day Change: -0.64 | |
| Week Change: -4.24% Year-to-date Change: -11.9% | |
| PGNY Links: Profile News Message Board | |
| Charts:- Daily , Weekly | |
| Add PGNY to Watchlist: View: Get Complete PGNY Trend Analysis ➞ | |
 | ENPH Enphase Energy, Inc. |
| Sector: Technology | |
| SubSector: Semiconductor Equipment & Materials | |
| MarketCap: 4047.48 Millions | |
| Recent Price: 112.05 Smart Investing & Trading Score: 43 | |
| Day Percent Change: 1.45% Day Change: 1.60 | |
| Week Change: -4.25% Year-to-date Change: -15.2% | |
| ENPH Links: Profile News Message Board | |
| Charts:- Daily , Weekly | |
| Add ENPH to Watchlist: View: Get Complete ENPH Trend Analysis ➞ | |
 | HCP HashiCorp, Inc. |
| Sector: Technology | |
| SubSector: Software - Infrastructure | |
| MarketCap: 5070 Millions | |
| Recent Price: 23.50 Smart Investing & Trading Score: 48 | |
| Day Percent Change: -0.68% Day Change: -0.16 | |
| Week Change: -4.28% Year-to-date Change: -2.6% | |
| HCP Links: Profile News Message Board | |
| Charts:- Daily , Weekly | |
| Add HCP to Watchlist: View: Get Complete HCP Trend Analysis ➞ | |
 | EGHT 8x8, Inc. |
| Sector: Technology | |
| SubSector: Diversified Communication Services | |
| MarketCap: 1861.64 Millions | |
| Recent Price: 2.23 Smart Investing & Trading Score: 0 | |
| Day Percent Change: -2.62% Day Change: -0.06 | |
| Week Change: -4.29% Year-to-date Change: -41.0% | |
| EGHT Links: Profile News Message Board | |
| Charts:- Daily , Weekly | |
| Add EGHT to Watchlist: View: Get Complete EGHT Trend Analysis ➞ | |
 | VECO Veeco Instruments Inc. |
| Sector: Technology | |
| SubSector: Semiconductor Equipment & Materials | |
| MarketCap: 450.718 Millions | |
| Recent Price: 34.46 Smart Investing & Trading Score: 26 | |
| Day Percent Change: -5.38% Day Change: -1.96 | |
| Week Change: -4.3% Year-to-date Change: 11.1% | |
| VECO Links: Profile News Message Board | |
| Charts:- Daily , Weekly | |
| Add VECO to Watchlist: View: Get Complete VECO Trend Analysis ➞ | |
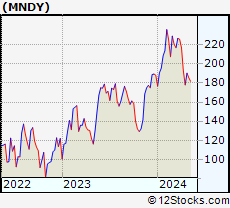 | MNDY monday.com Ltd. |
| Sector: Technology | |
| SubSector: Software - Application | |
| MarketCap: 8440 Millions | |
| Recent Price: 184.76 Smart Investing & Trading Score: 10 | |
| Day Percent Change: -1.68% Day Change: -3.16 | |
| Week Change: -4.32% Year-to-date Change: -1.9% | |
| MNDY Links: Profile News Message Board | |
| Charts:- Daily , Weekly | |
| Add MNDY to Watchlist: View: Get Complete MNDY Trend Analysis ➞ | |
 | INFY Infosys Limited |
| Sector: Technology | |
| SubSector: Information Technology Services | |
| MarketCap: 33819.1 Millions | |
| Recent Price: 16.95 Smart Investing & Trading Score: 0 | |
| Day Percent Change: -0.59% Day Change: -0.10 | |
| Week Change: -4.35% Year-to-date Change: -7.8% | |
| INFY Links: Profile News Message Board | |
| Charts:- Daily , Weekly | |
| Add INFY to Watchlist: View: Get Complete INFY Trend Analysis ➞ | |
 | LUMN Lumen Technologies, Inc. |
| Sector: Technology | |
| SubSector: Telecom Services - Domestic | |
| MarketCap: 1242 Millions | |
| Recent Price: 1.32 Smart Investing & Trading Score: 36 | |
| Day Percent Change: -0.75% Day Change: -0.01 | |
| Week Change: -4.35% Year-to-date Change: -27.7% | |
| LUMN Links: Profile News Message Board | |
| Charts:- Daily , Weekly | |
| Add LUMN to Watchlist: View: Get Complete LUMN Trend Analysis ➞ | |
 | TDS Telephone and Data Systems, Inc. |
| Sector: Technology | |
| SubSector: Wireless Communications | |
| MarketCap: 1851.87 Millions | |
| Recent Price: 14.96 Smart Investing & Trading Score: 17 | |
| Day Percent Change: -0.66% Day Change: -0.10 | |
| Week Change: -4.41% Year-to-date Change: -18.5% | |
| TDS Links: Profile News Message Board | |
| Charts:- Daily , Weekly | |
| Add TDS to Watchlist: View: Get Complete TDS Trend Analysis ➞ | |
 | ANET Arista Networks, Inc. |
| Sector: Technology | |
| SubSector: Diversified Computer Systems | |
| MarketCap: 14071.2 Millions | |
| Recent Price: 259.27 Smart Investing & Trading Score: 13 | |
| Day Percent Change: -1.33% Day Change: -3.49 | |
| Week Change: -4.41% Year-to-date Change: 10.1% | |
| ANET Links: Profile News Message Board | |
| Charts:- Daily , Weekly | |
| Add ANET to Watchlist: View: Get Complete ANET Trend Analysis ➞ | |
 | UCTT Ultra Clean Holdings, Inc. |
| Sector: Technology | |
| SubSector: Semiconductor Equipment & Materials | |
| MarketCap: 528.518 Millions | |
| Recent Price: 41.85 Smart Investing & Trading Score: 36 | |
| Day Percent Change: -3.62% Day Change: -1.57 | |
| Week Change: -4.43% Year-to-date Change: 22.6% | |
| UCTT Links: Profile News Message Board | |
| Charts:- Daily , Weekly | |
| Add UCTT to Watchlist: View: Get Complete UCTT Trend Analysis ➞ | |
 | UBER Uber Technologies, Inc. |
| Sector: Technology | |
| SubSector: Application Software | |
| MarketCap: 42671.2 Millions | |
| Recent Price: 71.94 Smart Investing & Trading Score: 26 | |
| Day Percent Change: -2.95% Day Change: -2.19 | |
| Week Change: -4.44% Year-to-date Change: 16.8% | |
| UBER Links: Profile News Message Board | |
| Charts:- Daily , Weekly | |
| Add UBER to Watchlist: View: Get Complete UBER Trend Analysis ➞ | |
 | VSAT Viasat, Inc. |
| Sector: Technology | |
| SubSector: Communication Equipment | |
| MarketCap: 1939.59 Millions | |
| Recent Price: 15.56 Smart Investing & Trading Score: 17 | |
| Day Percent Change: 1.37% Day Change: 0.21 | |
| Week Change: -4.48% Year-to-date Change: -44.3% | |
| VSAT Links: Profile News Message Board | |
| Charts:- Daily , Weekly | |
| Add VSAT to Watchlist: View: Get Complete VSAT Trend Analysis ➞ | |
 | TOST Toast, Inc. |
| Sector: Technology | |
| SubSector: Software - Infrastructure | |
| MarketCap: 11680 Millions | |
| Recent Price: 22.75 Smart Investing & Trading Score: 41 | |
| Day Percent Change: 1.38% Day Change: 0.31 | |
| Week Change: -4.49% Year-to-date Change: 24.3% | |
| TOST Links: Profile News Message Board | |
| Charts:- Daily , Weekly | |
| Add TOST to Watchlist: View: Get Complete TOST Trend Analysis ➞ | |
| For tabular summary view of above stock list: Summary View ➞ 0 - 25 , 25 - 50 , 50 - 75 , 75 - 100 , 100 - 125 , 125 - 150 , 150 - 175 , 175 - 200 , 200 - 225 , 225 - 250 , 250 - 275 , 275 - 300 , 300 - 325 , 325 - 350 , 350 - 375 , 375 - 400 , 400 - 425 , 425 - 450 , 450 - 475 , 475 - 500 , 500 - 525 , 525 - 550 , 550 - 575 , 575 - 600 , 600 - 625 , 625 - 650 | ||
| Click To Change The Sort Order: By Market Cap or Company Size Performance: Year-to-date, Week and Day | |
| Select Chart Type: | ||
|
Best Stocks Today 12Stocks.com |
© 2024 12Stocks.com Terms & Conditions Privacy Contact Us
All Information Provided Only For Education And Not To Be Used For Investing or Trading. See Terms & Conditions


One More Thing ... Get Best Stocks Delivered Daily!
Never Ever Miss A Move With Our Top Ten Stocks Lists
Find Best Stocks In Any Market - Bull or Bear Market
Take A Peek At Our Top Ten Stocks Lists: Daily, Weekly, Year-to-Date & Top Trends
Find Best Stocks In Any Market - Bull or Bear Market
Take A Peek At Our Top Ten Stocks Lists: Daily, Weekly, Year-to-Date & Top Trends
Technology Stocks With Best Up Trends [0-bearish to 100-bullish]: Zuora [100], GigaCloud [100], Inspire Medical[93], Allegro MicroSystems[93], Snap One[93], Encore Wire[93], NextNav [90], SYNNEX [88], Turkcell Iletisim[83], Model N[83], Benchmark Electronics[83]
Best Technology Stocks Year-to-Date:
MicroCloud Hologram[541.73%], MediaCo Holding[538.5%], Super Micro[237.75%], CXApp [223.55%], Smith Micro[136.08%], Uxin [133.95%], CuriosityStream [92.56%], GigaCloud [90.77%], D-Wave Quantum[90.34%], MicroStrategy [88.1%], SoundHound AI[85.28%] Best Technology Stocks This Week:
Snap One[29.85%], Mynaric AG[11.76%], Encore Wire[10.06%], Zuora [10%], Super Micro[6.85%], Applied Optoelectronics[6.68%], Luna Innovations[6.15%], NextNav [5.13%], Inspire Medical[5.08%], Sea [4.41%], Momo [4.15%] Best Technology Stocks Daily:
Zuora [11.69%], Inspire Medical[9.87%], MediaCo Holding[8.80%], Maxeon Solar[7.67%], CXApp [7.16%], FiscalNote [7.02%], Sunrun [4.99%], Snap [4.71%], Luna Innovations[4.55%], Cango [4.41%], Digital Turbine[4.20%]