
 Login Sign Up


| |||||
 |  | ||||

| 12Stocks.com Market Intelligence |
Best SmallCap Stocks
|
| In a hurry? Small Cap Stock Lists: Performance Trends Table, Stock Charts
Sort Small Cap stocks: Daily, Weekly, Year-to-Date, Market Cap & Trends. Filter Small Cap stocks list by sector: Show all, Tech, Finance, Energy, Staples, Retail, Industrial, Materials, Utilities and HealthCare Filter Small Cap stocks list by size: All Large Medium Small and MicroCap |
| 12Stocks.com Small Cap Stocks Performances & Trends Daily | |||||||||
|
|  The overall Smart Investing & Trading Score is 69 (0-bearish to 100-bullish) which puts Small Cap index in short term neutral to bullish trend. The Smart Investing & Trading Score from previous trading session is 49 and hence an improvement of trend.
| ||||||||
Here are the Smart Investing & Trading Scores of the most requested small cap stocks at 12Stocks.com (click stock name for detailed review):
|


| 12Stocks.com: Investing in Smallcap Index with Stocks | |
|
The following table helps investors and traders sort through current performance and trends (as measured by Smart Investing & Trading Score) of various
stocks in the Smallcap Index. Quick View: Move mouse or cursor over stock symbol (ticker) to view short-term technical chart and over stock name to view long term chart. Click on  to add stock symbol to your watchlist and to add stock symbol to your watchlist and  to view watchlist. Click on any ticker or stock name for detailed market intelligence report for that stock. to view watchlist. Click on any ticker or stock name for detailed market intelligence report for that stock. |
12Stocks.com Performance of Stocks in Smallcap Index
| Ticker | Stock Name | Watchlist | Category | Recent Price | Smart Investing & Trading Score | Change % | Weekly Change% |
| SFNC | Simmons First |   | Financials | 17.93 | 44 | 1.30% | 2.46% |
| GFF | Griffon | | Industrials | 69.94 | 54 | 1.79% | 2.45% |
| NWBI | Northwest Bancshares | | Financials | 11.09 | 67 | 1.42% | 2.45% |
| UE | Urban Edge | | Financials | 16.91 | 60 | -1.31% | 2.45% |
| AIR | AAR | | Industrials | 69.94 | 76 | 0.06% | 2.44% |
| AVD | American Vanguard | | Materials | 11.75 | 90 | -0.17% | 2.44% |
| FNLC | First Bancorp | | Financials | 23.10 | 67 | 1.40% | 2.44% |
| CEVA | CEVA | | Technology | 20.47 | 59 | 1.66% | 2.43% |
| MFA | MFA Financial | | Financials | 10.99 | 74 | 0.73% | 2.42% |
| GENC | Gencor Industries | | Industrials | 17.38 | 95 | -0.46% | 2.42% |
| WSR | Whitestone REIT | | Financials | 11.65 | 40 | -1.15% | 2.42% |
| PSFE | Paysafe | | Technology | 14.81 | 75 | 3.35% | 2.42% |
| GTY | Getty Realty | | Financials | 27.57 | 95 | -0.29% | 2.41% |
| UUUU | Energy Fuels | | Materials | 5.53 | 49 | -1.07% | 2.41% |
| FMBH | First Mid | | Financials | 32.27 | 100 | -0.06% | 2.41% |
| NMRK | Newmark Group | | Financials | 9.99 | 49 | 0.15% | 2.41% |
| GBCI | Glacier Bancorp | | Financials | 38.01 | 100 | 0.96% | 2.40% |
| MPB | Mid Penn | | Financials | 21.36 | 70 | 1.76% | 2.40% |
| THR | Thermon Group | | Industrials | 32.59 | 80 | -0.75% | 2.40% |
| AMWD | American Woodmark | | Consumer Staples | 95.14 | 39 | 1.90% | 2.39% |
| GPMT | Granite Point | | Financials | 4.50 | 62 | 4.05% | 2.39% |
| OSCR | Oscar Health | | Health Care | 17.98 | 95 | 1.30% | 2.39% |
| FA | First Advantage | | Industrials | 16.79 | 90 | 2.38% | 2.38% |
| AROW | Arrow Financial | | Financials | 23.50 | 74 | 0.36% | 2.37% |
| JXN | Jackson Financial | | Financials | 71.21 | 100 | 0.88% | 2.37% |


| Too many stocks? View smallcap stocks filtered by marketcap & sector |
| Marketcap: All SmallCap Stocks (default-no microcap), Large, Mid-Range, Small |
| Smallcap Sector: Tech, Finance, Energy, Staples, Retail, Industrial, Materials, & Medical |
|
Get the most comprehensive stock market coverage daily at 12Stocks.com ➞ Best Stocks Today ➞ Best Stocks Weekly ➞ Best Stocks Year-to-Date ➞ Best Stocks Trends ➞  Best Stocks Today 12Stocks.com Best Nasdaq Stocks ➞ Best S&P 500 Stocks ➞ Best Tech Stocks ➞ Best Biotech Stocks ➞ |
| Detailed Overview of SmallCap Stocks |
| SmallCap Technical Overview, Leaders & Laggards, Top SmallCap ETF Funds & Detailed SmallCap Stocks List, Charts, Trends & More |
| Smallcap: Technical Analysis, Trends & YTD Performance | |
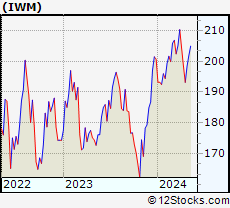
| SmallCap segment as represented by
IWM, an exchange-traded fund [ETF], holds basket of thousands of smallcap stocks from across all major sectors of the US stock market. The smallcap index (contains stocks like Riverbed & Sotheby's) is up by 0.55% and is currently underperforming the overall market by -6.35% year-to-date. Below is a quick view of technical charts and trends: | |
 IWM Weekly Chart |
|
| Long Term Trend: Not Good | |
| Medium Term Trend: Very Good | |
 IWM Daily Chart |
|
| Short Term Trend: Very Good | |
| Overall Trend Score: 69 | |
| YTD Performance: 0.55% | |
| **Trend Scores & Views Are Only For Educational Purposes And Not For Investing | |
| 12Stocks.com: Top Performing Small Cap Index Stocks | ||||||||||||||||||||||||||||||||||||||||||||||||
 The top performing Small Cap Index stocks year to date are
Now, more recently, over last week, the top performing Small Cap Index stocks on the move are


|
||||||||||||||||||||||||||||||||||||||||||||||||
| 12Stocks.com: Investing in Smallcap Index using Exchange Traded Funds | |
|
The following table shows list of key exchange traded funds (ETF) that
help investors track Smallcap index. The following list also includes leveraged ETF funds that track twice or thrice the daily returns of Smallcap indices. Short or inverse ETF funds move in the opposite direction to the index they track and are useful during market pullbacks or during bear markets. Quick View: Move mouse or cursor over ETF symbol (ticker) to view short-term technical chart and over ETF name to view long term chart. Click on ticker or stock name for detailed view. Click on to add stock symbol to your watchlist and to view watchlist. |
12Stocks.com List of ETFs that track Smallcap Index
| Ticker | ETF Name | Watchlist | Recent Price | Smart Investing & Trading Score | Change % | Week % | Year-to-date % |
| IWM | iShares Russell 2000 | | 201.81 | 69 | 0.95 | 1.72 | 0.55% |
| IJR | iShares Core S&P Small-Cap | | 107.17 | 82 | 0.79 | 1.44 | -1% |
| VTWO | Vanguard Russell 2000 ETF | | 81.74 | 30 | 1.10 | 1.89 | 0.79% |
| IWN | iShares Russell 2000 Value | | 154.25 | 50 | 0.90 | 2.06 | -0.7% |
| IJS | iShares S&P Small-Cap 600 Value | | 98.72 | 30 | 0.71 | 1.57 | -4.22% |
| IWO | iShares Russell 2000 Growth | | 256.90 | 20 | 1.01 | 1.51 | 1.86% |
| IJT | iShares S&P Small-Cap 600 Growth | | 127.92 | 50 | 0.95 | 1.45 | 2.22% |
| XSLV | PowerShares S&P SmallCap Low Volatil ETF | | 43.31 | 60 | 0.39 | 1.38 | -1.9% |
| SBB | ProShares Short SmallCap600 | | 16.16 | 41 | -1.28 | -1.37 | 1.44% |
| SAA | ProShares Ultra SmallCap600 | | 23.59 | 82 | 2.86 | 2.39 | -5.45% |
| SDD | ProShares UltraShort SmallCap600 | | 18.84 | 10 | -2.43 | -2.64 | 2.24% |
| SMLV | SPDR SSGA US Small Cap Low Volatil ETF | | 109.56 | 61 | 0.67 | 1.9 | -2.63% |
| 12Stocks.com: Charts, Trends, Fundamental Data and Performances of SmallCap Stocks | |
|
We now take in-depth look at all SmallCap stocks including charts, multi-period performances and overall trends (as measured by Smart Investing & Trading Score). One can sort SmallCap stocks (click link to choose) by Daily, Weekly and by Year-to-Date performances. Also, one can sort by size of the company or by market capitalization. |
| Select Your Default Chart Type: | |||||
| |||||
| Click on stock symbol or name for detailed view. Click on to add stock symbol to your watchlist and to view watchlist. Quick View: Move mouse or cursor over "Daily" to quickly view daily technical stock chart and over "Weekly" to view weekly technical stock chart. | |||||

 | SFNC Simmons First National Corporation |
| Sector: Financials | |
| SubSector: Money Center Banks | |
| MarketCap: 2125.49 Millions | |
| Recent Price: 17.93 Smart Investing & Trading Score: 44 | |
| Day Percent Change: 1.30% Day Change: 0.23 | |
| Week Change: 2.46% Year-to-date Change: -9.6% | |
| SFNC Links: Profile News Message Board | |
| Charts:- Daily , Weekly | |
| Add SFNC to Watchlist: View: Get Complete SFNC Trend Analysis ➞ | |
 | GFF Griffon Corporation |
| Sector: Industrials | |
| SubSector: General Building Materials | |
| MarketCap: 616 Millions | |
| Recent Price: 69.94 Smart Investing & Trading Score: 54 | |
| Day Percent Change: 1.79% Day Change: 1.23 | |
| Week Change: 2.45% Year-to-date Change: 14.8% | |
| GFF Links: Profile News Message Board | |
| Charts:- Daily , Weekly | |
| Add GFF to Watchlist: View: Get Complete GFF Trend Analysis ➞ | |
 | NWBI Northwest Bancshares, Inc. |
| Sector: Financials | |
| SubSector: Savings & Loans | |
| MarketCap: 1266.3 Millions | |
| Recent Price: 11.09 Smart Investing & Trading Score: 67 | |
| Day Percent Change: 1.42% Day Change: 0.16 | |
| Week Change: 2.45% Year-to-date Change: -11.2% | |
| NWBI Links: Profile News Message Board | |
| Charts:- Daily , Weekly | |
| Add NWBI to Watchlist: View: Get Complete NWBI Trend Analysis ➞ | |
 | UE Urban Edge Properties |
| Sector: Financials | |
| SubSector: REIT - Diversified | |
| MarketCap: 1112.33 Millions | |
| Recent Price: 16.91 Smart Investing & Trading Score: 60 | |
| Day Percent Change: -1.31% Day Change: -0.23 | |
| Week Change: 2.45% Year-to-date Change: -7.6% | |
| UE Links: Profile News Message Board | |
| Charts:- Daily , Weekly | |
| Add UE to Watchlist: View: Get Complete UE Trend Analysis ➞ | |
 | AIR AAR Corp. |
| Sector: Industrials | |
| SubSector: Aerospace/Defense Products & Services | |
| MarketCap: 591.701 Millions | |
| Recent Price: 69.94 Smart Investing & Trading Score: 76 | |
| Day Percent Change: 0.06% Day Change: 0.05 | |
| Week Change: 2.44% Year-to-date Change: 12.1% | |
| AIR Links: Profile News Message Board | |
| Charts:- Daily , Weekly | |
| Add AIR to Watchlist: View: Get Complete AIR Trend Analysis ➞ | |
 | AVD American Vanguard Corporation |
| Sector: Materials | |
| SubSector: Agricultural Chemicals | |
| MarketCap: 419.329 Millions | |
| Recent Price: 11.75 Smart Investing & Trading Score: 90 | |
| Day Percent Change: -0.17% Day Change: -0.02 | |
| Week Change: 2.44% Year-to-date Change: 7.1% | |
| AVD Links: Profile News Message Board | |
| Charts:- Daily , Weekly | |
| Add AVD to Watchlist: View: Get Complete AVD Trend Analysis ➞ | |
 | FNLC The First Bancorp, Inc. |
| Sector: Financials | |
| SubSector: Regional - Northeast Banks | |
| MarketCap: 264.799 Millions | |
| Recent Price: 23.10 Smart Investing & Trading Score: 67 | |
| Day Percent Change: 1.40% Day Change: 0.32 | |
| Week Change: 2.44% Year-to-date Change: -18.1% | |
| FNLC Links: Profile News Message Board | |
| Charts:- Daily , Weekly | |
| Add FNLC to Watchlist: View: Get Complete FNLC Trend Analysis ➞ | |
 | CEVA CEVA, Inc. |
| Sector: Technology | |
| SubSector: Semiconductor - Specialized | |
| MarketCap: 587.06 Millions | |
| Recent Price: 20.47 Smart Investing & Trading Score: 59 | |
| Day Percent Change: 1.66% Day Change: 0.34 | |
| Week Change: 2.43% Year-to-date Change: -9.9% | |
| CEVA Links: Profile News Message Board | |
| Charts:- Daily , Weekly | |
| Add CEVA to Watchlist: View: Get Complete CEVA Trend Analysis ➞ | |
 | MFA MFA Financial, Inc. |
| Sector: Financials | |
| SubSector: Mortgage Investment | |
| MarketCap: 1869.69 Millions | |
| Recent Price: 10.99 Smart Investing & Trading Score: 74 | |
| Day Percent Change: 0.73% Day Change: 0.08 | |
| Week Change: 2.42% Year-to-date Change: -2.5% | |
| MFA Links: Profile News Message Board | |
| Charts:- Daily , Weekly | |
| Add MFA to Watchlist: View: Get Complete MFA Trend Analysis ➞ | |
 | GENC Gencor Industries, Inc. |
| Sector: Industrials | |
| SubSector: Farm & Construction Machinery | |
| MarketCap: 147.607 Millions | |
| Recent Price: 17.38 Smart Investing & Trading Score: 95 | |
| Day Percent Change: -0.46% Day Change: -0.08 | |
| Week Change: 2.42% Year-to-date Change: 7.7% | |
| GENC Links: Profile News Message Board | |
| Charts:- Daily , Weekly | |
| Add GENC to Watchlist: View: Get Complete GENC Trend Analysis ➞ | |
 | WSR Whitestone REIT |
| Sector: Financials | |
| SubSector: REIT - Retail | |
| MarketCap: 316.114 Millions | |
| Recent Price: 11.65 Smart Investing & Trading Score: 40 | |
| Day Percent Change: -1.15% Day Change: -0.13 | |
| Week Change: 2.42% Year-to-date Change: -5.3% | |
| WSR Links: Profile News Message Board | |
| Charts:- Daily , Weekly | |
| Add WSR to Watchlist: View: Get Complete WSR Trend Analysis ➞ | |
 | PSFE Paysafe Limited |
| Sector: Technology | |
| SubSector: Software - Infrastructure | |
| MarketCap: 605 Millions | |
| Recent Price: 14.81 Smart Investing & Trading Score: 75 | |
| Day Percent Change: 3.35% Day Change: 0.48 | |
| Week Change: 2.42% Year-to-date Change: 14.8% | |
| PSFE Links: Profile News Message Board | |
| Charts:- Daily , Weekly | |
| Add PSFE to Watchlist: View: Get Complete PSFE Trend Analysis ➞ | |
 | GTY Getty Realty Corp. |
| Sector: Financials | |
| SubSector: REIT - Retail | |
| MarketCap: 926.114 Millions | |
| Recent Price: 27.57 Smart Investing & Trading Score: 95 | |
| Day Percent Change: -0.29% Day Change: -0.08 | |
| Week Change: 2.41% Year-to-date Change: -5.7% | |
| GTY Links: Profile News Message Board | |
| Charts:- Daily , Weekly | |
| Add GTY to Watchlist: View: Get Complete GTY Trend Analysis ➞ | |
 | UUUU Energy Fuels Inc. |
| Sector: Materials | |
| SubSector: Industrial Metals & Minerals | |
| MarketCap: 107.61 Millions | |
| Recent Price: 5.53 Smart Investing & Trading Score: 49 | |
| Day Percent Change: -1.07% Day Change: -0.06 | |
| Week Change: 2.41% Year-to-date Change: -23.1% | |
| UUUU Links: Profile News Message Board | |
| Charts:- Daily , Weekly | |
| Add UUUU to Watchlist: View: Get Complete UUUU Trend Analysis ➞ | |
 | FMBH First Mid Bancshares, Inc. |
| Sector: Financials | |
| SubSector: Regional - Midwest Banks | |
| MarketCap: 373.27 Millions | |
| Recent Price: 32.27 Smart Investing & Trading Score: 100 | |
| Day Percent Change: -0.06% Day Change: -0.02 | |
| Week Change: 2.41% Year-to-date Change: -6.9% | |
| FMBH Links: Profile News Message Board | |
| Charts:- Daily , Weekly | |
| Add FMBH to Watchlist: View: Get Complete FMBH Trend Analysis ➞ | |
 | NMRK Newmark Group, Inc. |
| Sector: Financials | |
| SubSector: Property Management | |
| MarketCap: 767.542 Millions | |
| Recent Price: 9.99 Smart Investing & Trading Score: 49 | |
| Day Percent Change: 0.15% Day Change: 0.01 | |
| Week Change: 2.41% Year-to-date Change: -8.8% | |
| NMRK Links: Profile News Message Board | |
| Charts:- Daily , Weekly | |
| Add NMRK to Watchlist: View: Get Complete NMRK Trend Analysis ➞ | |
 | GBCI Glacier Bancorp, Inc. |
| Sector: Financials | |
| SubSector: Regional - Pacific Banks | |
| MarketCap: 3142.89 Millions | |
| Recent Price: 38.01 Smart Investing & Trading Score: 100 | |
| Day Percent Change: 0.96% Day Change: 0.36 | |
| Week Change: 2.4% Year-to-date Change: -8.0% | |
| GBCI Links: Profile News Message Board | |
| Charts:- Daily , Weekly | |
| Add GBCI to Watchlist: View: Get Complete GBCI Trend Analysis ➞ | |
 | MPB Mid Penn Bancorp, Inc. |
| Sector: Financials | |
| SubSector: Regional - Northeast Banks | |
| MarketCap: 187.699 Millions | |
| Recent Price: 21.36 Smart Investing & Trading Score: 70 | |
| Day Percent Change: 1.76% Day Change: 0.37 | |
| Week Change: 2.4% Year-to-date Change: -12.0% | |
| MPB Links: Profile News Message Board | |
| Charts:- Daily , Weekly | |
| Add MPB to Watchlist: View: Get Complete MPB Trend Analysis ➞ | |
 | THR Thermon Group Holdings, Inc. |
| Sector: Industrials | |
| SubSector: Diversified Machinery | |
| MarketCap: 492.816 Millions | |
| Recent Price: 32.59 Smart Investing & Trading Score: 80 | |
| Day Percent Change: -0.75% Day Change: -0.25 | |
| Week Change: 2.4% Year-to-date Change: 0.1% | |
| THR Links: Profile News Message Board | |
| Charts:- Daily , Weekly | |
| Add THR to Watchlist: View: Get Complete THR Trend Analysis ➞ | |
 | AMWD American Woodmark Corporation |
| Sector: Consumer Staples | |
| SubSector: Home Furnishings & Fixtures | |
| MarketCap: 958.435 Millions | |
| Recent Price: 95.14 Smart Investing & Trading Score: 39 | |
| Day Percent Change: 1.90% Day Change: 1.77 | |
| Week Change: 2.39% Year-to-date Change: 2.5% | |
| AMWD Links: Profile News Message Board | |
| Charts:- Daily , Weekly | |
| Add AMWD to Watchlist: View: Get Complete AMWD Trend Analysis ➞ | |
 | GPMT Granite Point Mortgage Trust Inc. |
| Sector: Financials | |
| SubSector: Mortgage Investment | |
| MarketCap: 289.739 Millions | |
| Recent Price: 4.50 Smart Investing & Trading Score: 62 | |
| Day Percent Change: 4.05% Day Change: 0.17 | |
| Week Change: 2.39% Year-to-date Change: -24.3% | |
| GPMT Links: Profile News Message Board | |
| Charts:- Daily , Weekly | |
| Add GPMT to Watchlist: View: Get Complete GPMT Trend Analysis ➞ | |
 | OSCR Oscar Health, Inc. |
| Sector: Health Care | |
| SubSector: Healthcare Plans | |
| MarketCap: 1790 Millions | |
| Recent Price: 17.98 Smart Investing & Trading Score: 95 | |
| Day Percent Change: 1.30% Day Change: 0.23 | |
| Week Change: 2.39% Year-to-date Change: 97.5% | |
| OSCR Links: Profile News Message Board | |
| Charts:- Daily , Weekly | |
| Add OSCR to Watchlist: View: Get Complete OSCR Trend Analysis ➞ | |
 | FA First Advantage Corporation |
| Sector: Industrials | |
| SubSector: Specialty Business Services | |
| MarketCap: 2170 Millions | |
| Recent Price: 16.79 Smart Investing & Trading Score: 90 | |
| Day Percent Change: 2.38% Day Change: 0.39 | |
| Week Change: 2.38% Year-to-date Change: 0.7% | |
| FA Links: Profile News Message Board | |
| Charts:- Daily , Weekly | |
| Add FA to Watchlist: View: Get Complete FA Trend Analysis ➞ | |
 | AROW Arrow Financial Corporation |
| Sector: Financials | |
| SubSector: Regional - Northeast Banks | |
| MarketCap: 413.999 Millions | |
| Recent Price: 23.50 Smart Investing & Trading Score: 74 | |
| Day Percent Change: 0.36% Day Change: 0.08 | |
| Week Change: 2.37% Year-to-date Change: -15.9% | |
| AROW Links: Profile News Message Board | |
| Charts:- Daily , Weekly | |
| Add AROW to Watchlist: View: Get Complete AROW Trend Analysis ➞ | |
 | JXN Jackson Financial Inc. |
| Sector: Financials | |
| SubSector: Insurance - Life | |
| MarketCap: 2460 Millions | |
| Recent Price: 71.21 Smart Investing & Trading Score: 100 | |
| Day Percent Change: 0.88% Day Change: 0.62 | |
| Week Change: 2.37% Year-to-date Change: 38.5% | |
| JXN Links: Profile News Message Board | |
| Charts:- Daily , Weekly | |
| Add JXN to Watchlist: View: Get Complete JXN Trend Analysis ➞ | |
| Too many stocks? View smallcap stocks filtered by marketcap & sector |
| Marketcap: All SmallCap Stocks (default-no microcap), Large, Mid-Range, Small & MicroCap |
| Sector: Tech, Finance, Energy, Staples, Retail, Industrial, Materials, Utilities & Medical |
|
Best Stocks Today 12Stocks.com |
© 2024 12Stocks.com Terms & Conditions Privacy Contact Us
All Information Provided Only For Education And Not To Be Used For Investing or Trading. See Terms & Conditions


One More Thing ... Get Best Stocks Delivered Daily!
Never Ever Miss A Move With Our Top Ten Stocks Lists
Find Best Stocks In Any Market - Bull or Bear Market
Take A Peek At Our Top Ten Stocks Lists: Daily, Weekly, Year-to-Date & Top Trends
Find Best Stocks In Any Market - Bull or Bear Market
Take A Peek At Our Top Ten Stocks Lists: Daily, Weekly, Year-to-Date & Top Trends
Smallcap Stocks With Best Up Trends [0-bearish to 100-bullish]: WideOpenWest [100], FTC Solar[100], Joint [100], Origin Materials[100], Alignment Healthcare[100], IES [100], Enovix [100], El Pollo[100], Adtalem Global[100], Tidewater [100], Fluence Energy[100]
Best Smallcap Stocks Year-to-Date:
Janux [482.74%], Viking [314.62%], Longboard [272.5%], Alpine Immune[239.34%], Bakkt [199.55%], Avidity Biosciences[195.24%], Vera [189.47%], Cullinan Oncology[176.9%], Super Micro[174.89%], Arcutis Bio[152.48%], Y-mAbs [151.25%] Best Smallcap Stocks This Week:
Emergent BioSolutions[93.75%], Deciphera [73.07%], Eyenovia [68.74%], Origin Materials[66.52%], Aspen Aerogels[55.78%], Enovix [54.02%], Codexis [45.3%], Carvana Co[44.59%], Luna Innovations[42.96%], Cue Biopharma[41.39%], Office Properties[41.29%] Best Smallcap Stocks Daily:
Twist Bioscience[29.18%], WideOpenWest [29.16%], Ardelyx [26.73%], Luna Innovations[26.44%], FTC Solar[25.09%], Joint [23.48%], Origin Materials[22.23%], Alignment Healthcare[21.97%], 2U [20.34%], IES [19.85%], Aurora Innovation[18.09%]