
 Login Sign Up


| |||||
 |  | ||||

| 12Stocks.com Market Intelligence |
Best SmallCap Stocks
|
| In a hurry? Small Cap Stock Lists: Performance Trends Table, Stock Charts
Sort Small Cap stocks: Daily, Weekly, Year-to-Date, Market Cap & Trends. Filter Small Cap stocks list by sector: Show all, Tech, Finance, Energy, Staples, Retail, Industrial, Materials, Utilities and HealthCare Filter Small Cap stocks list by size: All Large Medium Small and MicroCap |
| 12Stocks.com Small Cap Stocks Performances & Trends Daily | |||||||||
|
|  The overall Smart Investing & Trading Score is 24 (0-bearish to 100-bullish) which puts Small Cap index in short term bearish to neutral trend. The Smart Investing & Trading Score from previous trading session is 14 and hence an improvement of trend.
| ||||||||
Here are the Smart Investing & Trading Scores of the most requested small cap stocks at 12Stocks.com (click stock name for detailed review):
|


| 12Stocks.com: Investing in Smallcap Index with Stocks | |
|
The following table helps investors and traders sort through current performance and trends (as measured by Smart Investing & Trading Score) of various
stocks in the Smallcap Index. Quick View: Move mouse or cursor over stock symbol (ticker) to view short-term technical chart and over stock name to view long term chart. Click on  to add stock symbol to your watchlist and to add stock symbol to your watchlist and  to view watchlist. Click on any ticker or stock name for detailed market intelligence report for that stock. to view watchlist. Click on any ticker or stock name for detailed market intelligence report for that stock. |
12Stocks.com Performance of Stocks in Smallcap Index
| Ticker | Stock Name | Watchlist | Category | Recent Price | Smart Investing & Trading Score | Change % | Weekly Change% |
| RBBN | Ribbon |   | Technology | 3.20 | 83 | 0.31% | 2.24% |
| EBF | Ennis | | Consumer Staples | 20.14 | 64 | 0.00% | 2.23% |
| NNOX | Nano X | | Health Care | 9.16 | 37 | 0.00% | 2.23% |
| SBCF | Seacoast Banking | | Financials | 23.90 | 62 | 1.66% | 2.22% |
| ONB | Old National | | Financials | 16.93 | 85 | 0.98% | 2.20% |
| NTB | Bank of N.T. Butterfield & Son | | Financials | 34.81 | 95 | 1.22% | 2.20% |
| DDD | 3D Systems | | Technology | 3.50 | 45 | 1.30% | 2.19% |
| TIPT | Tiptree | | Financials | 16.32 | 64 | 1.24% | 2.19% |
| ARRY | Array | | Technology | 12.67 | 90 | 1.69% | 2.18% |
| TCBI | Texas Capital | | Financials | 59.07 | 70 | 1.20% | 2.18% |
| PRAA | PRA Group | | Services & Goods | 24.64 | 42 | 1.46% | 2.18% |
| LPG | Dorian LPG | | Transports | 42.69 | 65 | 3.87% | 2.18% |
| RCKT | Rocket | | Health Care | 22.46 | 42 | -0.31% | 2.18% |
| VLGEA | Village Super | | Services & Goods | 28.00 | 95 | -1.15% | 2.17% |
| GBTG | Global Business | | Technology | 6.13 | 68 | 1.32% | 2.17% |
| ITIC | Investors Title | | Financials | 162.78 | 88 | 0.43% | 2.15% |
| FOLD | Amicus | | Health Care | 10.50 | 42 | 0.67% | 2.14% |
| ALRM | Alarm.com | | Technology | 67.38 | 39 | 0.72% | 2.14% |
| ADMA | ADMA Biologics | | Health Care | 6.69 | 78 | 0.30% | 2.14% |
| FIGS | FIGS | | Services & Goods | 5.03 | 50 | -0.89% | 2.13% |
| HAE | Haemonetics | | Health Care | 92.92 | 100 | 0.86% | 2.12% |
| AMKR | Amkor | | Technology | 31.27 | 17 | 3.10% | 2.12% |
| RMR | RMR Group | | Financials | 24.03 | 49 | -0.08% | 2.12% |
| ESSA | ESSA Bancorp | | Financials | 16.95 | 57 | 0.00% | 2.11% |
| RGCO | RGC Resources | | Utilities | 20.94 | 93 | 0.00% | 2.10% |


| Too many stocks? View smallcap stocks filtered by marketcap & sector |
| Marketcap: All SmallCap Stocks (default-no microcap), Large, Mid-Range, Small |
| Smallcap Sector: Tech, Finance, Energy, Staples, Retail, Industrial, Materials, & Medical |
|
Get the most comprehensive stock market coverage daily at 12Stocks.com ➞ Best Stocks Today ➞ Best Stocks Weekly ➞ Best Stocks Year-to-Date ➞ Best Stocks Trends ➞  Best Stocks Today 12Stocks.com Best Nasdaq Stocks ➞ Best S&P 500 Stocks ➞ Best Tech Stocks ➞ Best Biotech Stocks ➞ |
| Detailed Overview of SmallCap Stocks |
| SmallCap Technical Overview, Leaders & Laggards, Top SmallCap ETF Funds & Detailed SmallCap Stocks List, Charts, Trends & More |
| Smallcap: Technical Analysis, Trends & YTD Performance | |
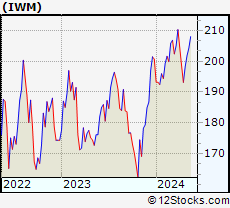
| SmallCap segment as represented by
IWM, an exchange-traded fund [ETF], holds basket of thousands of smallcap stocks from across all major sectors of the US stock market. The smallcap index (contains stocks like Riverbed & Sotheby's) is down by -1.02% and is currently underperforming the overall market by -6.17% year-to-date. Below is a quick view of technical charts and trends: | |
 IWM Weekly Chart |
|
| Long Term Trend: Not Good | |
| Medium Term Trend: Not Good | |
 IWM Daily Chart |
|
| Short Term Trend: Deteriorating | |
| Overall Trend Score: 24 | |
| YTD Performance: -1.02% | |
| **Trend Scores & Views Are Only For Educational Purposes And Not For Investing | |
| 12Stocks.com: Top Performing Small Cap Index Stocks | ||||||||||||||||||||||||||||||||||||||||||||||||
 The top performing Small Cap Index stocks year to date are
Now, more recently, over last week, the top performing Small Cap Index stocks on the move are


|
||||||||||||||||||||||||||||||||||||||||||||||||
| 12Stocks.com: Investing in Smallcap Index using Exchange Traded Funds | |
|
The following table shows list of key exchange traded funds (ETF) that
help investors track Smallcap index. The following list also includes leveraged ETF funds that track twice or thrice the daily returns of Smallcap indices. Short or inverse ETF funds move in the opposite direction to the index they track and are useful during market pullbacks or during bear markets. Quick View: Move mouse or cursor over ETF symbol (ticker) to view short-term technical chart and over ETF name to view long term chart. Click on ticker or stock name for detailed view. Click on to add stock symbol to your watchlist and to view watchlist. |
12Stocks.com List of ETFs that track Smallcap Index
| Ticker | ETF Name | Watchlist | Recent Price | Smart Investing & Trading Score | Change % | Week % | Year-to-date % |
| IWM | iShares Russell 2000 | | 198.66 | 24 | 1.20 | 0.14 | -1.02% |
| IJR | iShares Core S&P Small-Cap | | 105.66 | 15 | 0.88 | 0.01 | -2.39% |
| IWN | iShares Russell 2000 Value | | 151.74 | 15 | 1.28 | 0.39 | -2.31% |
| IWO | iShares Russell 2000 Growth | | 252.43 | 7 | 1.14 | -0.26 | 0.08% |
| 12Stocks.com: Charts, Trends, Fundamental Data and Performances of SmallCap Stocks | |
|
We now take in-depth look at all SmallCap stocks including charts, multi-period performances and overall trends (as measured by Smart Investing & Trading Score). One can sort SmallCap stocks (click link to choose) by Daily, Weekly and by Year-to-Date performances. Also, one can sort by size of the company or by market capitalization. |
| Select Your Default Chart Type: | |||||
| |||||
| Click on stock symbol or name for detailed view. Click on to add stock symbol to your watchlist and to view watchlist. Quick View: Move mouse or cursor over "Daily" to quickly view daily technical stock chart and over "Weekly" to view weekly technical stock chart. | |||||

 | RBBN Ribbon Communications Inc. |
| Sector: Technology | |
| SubSector: Telecom Services - Domestic | |
| MarketCap: 284.577 Millions | |
| Recent Price: 3.20 Smart Investing & Trading Score: 83 | |
| Day Percent Change: 0.31% Day Change: 0.01 | |
| Week Change: 2.24% Year-to-date Change: 10.3% | |
| RBBN Links: Profile News Message Board | |
| Charts:- Daily , Weekly | |
| Add RBBN to Watchlist: View: Get Complete RBBN Trend Analysis ➞ | |
 | EBF Ennis, Inc. |
| Sector: Consumer Staples | |
| SubSector: Office Supplies | |
| MarketCap: 464.5 Millions | |
| Recent Price: 20.14 Smart Investing & Trading Score: 64 | |
| Day Percent Change: 0.00% Day Change: 0.00 | |
| Week Change: 2.23% Year-to-date Change: -8.1% | |
| EBF Links: Profile News Message Board | |
| Charts:- Daily , Weekly | |
| Add EBF to Watchlist: View: Get Complete EBF Trend Analysis ➞ | |
 | NNOX Nano X Imaging Ltd. |
| Sector: Health Care | |
| SubSector: Medical Devices | |
| MarketCap: 22587 Millions | |
| Recent Price: 9.16 Smart Investing & Trading Score: 37 | |
| Day Percent Change: 0.00% Day Change: 0.00 | |
| Week Change: 2.23% Year-to-date Change: 43.8% | |
| NNOX Links: Profile News Message Board | |
| Charts:- Daily , Weekly | |
| Add NNOX to Watchlist: View: Get Complete NNOX Trend Analysis ➞ | |
 | SBCF Seacoast Banking Corporation of Florida |
| Sector: Financials | |
| SubSector: Regional - Mid-Atlantic Banks | |
| MarketCap: 881.559 Millions | |
| Recent Price: 23.90 Smart Investing & Trading Score: 62 | |
| Day Percent Change: 1.66% Day Change: 0.39 | |
| Week Change: 2.22% Year-to-date Change: -16.0% | |
| SBCF Links: Profile News Message Board | |
| Charts:- Daily , Weekly | |
| Add SBCF to Watchlist: View: Get Complete SBCF Trend Analysis ➞ | |
 | ONB Old National Bancorp |
| Sector: Financials | |
| SubSector: Regional - Midwest Banks | |
| MarketCap: 2340.8 Millions | |
| Recent Price: 16.93 Smart Investing & Trading Score: 85 | |
| Day Percent Change: 0.98% Day Change: 0.16 | |
| Week Change: 2.2% Year-to-date Change: 0.3% | |
| ONB Links: Profile News Message Board | |
| Charts:- Daily , Weekly | |
| Add ONB to Watchlist: View: Get Complete ONB Trend Analysis ➞ | |
 | NTB The Bank of N.T. Butterfield & Son Limited |
| Sector: Financials | |
| SubSector: Foreign Regional Banks | |
| MarketCap: 889.379 Millions | |
| Recent Price: 34.81 Smart Investing & Trading Score: 95 | |
| Day Percent Change: 1.22% Day Change: 0.42 | |
| Week Change: 2.2% Year-to-date Change: 8.8% | |
| NTB Links: Profile News Message Board | |
| Charts:- Daily , Weekly | |
| Add NTB to Watchlist: View: Get Complete NTB Trend Analysis ➞ | |
 | DDD 3D Systems Corporation |
| Sector: Technology | |
| SubSector: Computer Peripherals | |
| MarketCap: 842.989 Millions | |
| Recent Price: 3.50 Smart Investing & Trading Score: 45 | |
| Day Percent Change: 1.30% Day Change: 0.04 | |
| Week Change: 2.19% Year-to-date Change: -44.8% | |
| DDD Links: Profile News Message Board | |
| Charts:- Daily , Weekly | |
| Add DDD to Watchlist: View: Get Complete DDD Trend Analysis ➞ | |
 | TIPT Tiptree Inc. |
| Sector: Financials | |
| SubSector: Life Insurance | |
| MarketCap: 183.486 Millions | |
| Recent Price: 16.32 Smart Investing & Trading Score: 64 | |
| Day Percent Change: 1.24% Day Change: 0.20 | |
| Week Change: 2.19% Year-to-date Change: -13.9% | |
| TIPT Links: Profile News Message Board | |
| Charts:- Daily , Weekly | |
| Add TIPT to Watchlist: View: Get Complete TIPT Trend Analysis ➞ | |
 | ARRY Array Technologies, Inc. |
| Sector: Technology | |
| SubSector: Solar | |
| MarketCap: 45887 Millions | |
| Recent Price: 12.67 Smart Investing & Trading Score: 90 | |
| Day Percent Change: 1.69% Day Change: 0.21 | |
| Week Change: 2.18% Year-to-date Change: -24.6% | |
| ARRY Links: Profile News Message Board | |
| Charts:- Daily , Weekly | |
| Add ARRY to Watchlist: View: Get Complete ARRY Trend Analysis ➞ | |
 | TCBI Texas Capital Bancshares, Inc. |
| Sector: Financials | |
| SubSector: Regional - Southwest Banks | |
| MarketCap: 1202.75 Millions | |
| Recent Price: 59.07 Smart Investing & Trading Score: 70 | |
| Day Percent Change: 1.20% Day Change: 0.70 | |
| Week Change: 2.18% Year-to-date Change: -8.6% | |
| TCBI Links: Profile News Message Board | |
| Charts:- Daily , Weekly | |
| Add TCBI to Watchlist: View: Get Complete TCBI Trend Analysis ➞ | |
 | PRAA PRA Group, Inc. |
| Sector: Services & Goods | |
| SubSector: Business Services | |
| MarketCap: 1290.32 Millions | |
| Recent Price: 24.64 Smart Investing & Trading Score: 42 | |
| Day Percent Change: 1.46% Day Change: 0.36 | |
| Week Change: 2.18% Year-to-date Change: -6.0% | |
| PRAA Links: Profile News Message Board | |
| Charts:- Daily , Weekly | |
| Add PRAA to Watchlist: View: Get Complete PRAA Trend Analysis ➞ | |
 | LPG Dorian LPG Ltd. |
| Sector: Transports | |
| SubSector: Shipping | |
| MarketCap: 426.414 Millions | |
| Recent Price: 42.69 Smart Investing & Trading Score: 65 | |
| Day Percent Change: 3.87% Day Change: 1.59 | |
| Week Change: 2.18% Year-to-date Change: -2.7% | |
| LPG Links: Profile News Message Board | |
| Charts:- Daily , Weekly | |
| Add LPG to Watchlist: View: Get Complete LPG Trend Analysis ➞ | |
 | RCKT Rocket Pharmaceuticals, Inc. |
| Sector: Health Care | |
| SubSector: Biotechnology | |
| MarketCap: 899.585 Millions | |
| Recent Price: 22.46 Smart Investing & Trading Score: 42 | |
| Day Percent Change: -0.31% Day Change: -0.07 | |
| Week Change: 2.18% Year-to-date Change: -25.1% | |
| RCKT Links: Profile News Message Board | |
| Charts:- Daily , Weekly | |
| Add RCKT to Watchlist: View: Get Complete RCKT Trend Analysis ➞ | |
 | VLGEA Village Super Market, Inc. |
| Sector: Services & Goods | |
| SubSector: Grocery Stores | |
| MarketCap: 222.375 Millions | |
| Recent Price: 28.00 Smart Investing & Trading Score: 95 | |
| Day Percent Change: -1.15% Day Change: -0.32 | |
| Week Change: 2.17% Year-to-date Change: 6.7% | |
| VLGEA Links: Profile News Message Board | |
| Charts:- Daily , Weekly | |
| Add VLGEA to Watchlist: View: Get Complete VLGEA Trend Analysis ➞ | |
 | GBTG Global Business Travel Group, Inc. |
| Sector: Technology | |
| SubSector: Software - Application | |
| MarketCap: 3440 Millions | |
| Recent Price: 6.13 Smart Investing & Trading Score: 68 | |
| Day Percent Change: 1.32% Day Change: 0.08 | |
| Week Change: 2.17% Year-to-date Change: -6.1% | |
| GBTG Links: Profile News Message Board | |
| Charts:- Daily , Weekly | |
| Add GBTG to Watchlist: View: Get Complete GBTG Trend Analysis ➞ | |
 | ITIC Investors Title Company |
| Sector: Financials | |
| SubSector: Surety & Title Insurance | |
| MarketCap: 219.518 Millions | |
| Recent Price: 162.78 Smart Investing & Trading Score: 88 | |
| Day Percent Change: 0.43% Day Change: 0.70 | |
| Week Change: 2.15% Year-to-date Change: 0.4% | |
| ITIC Links: Profile News Message Board | |
| Charts:- Daily , Weekly | |
| Add ITIC to Watchlist: View: Get Complete ITIC Trend Analysis ➞ | |
 | FOLD Amicus Therapeutics, Inc. |
| Sector: Health Care | |
| SubSector: Biotechnology | |
| MarketCap: 2676.75 Millions | |
| Recent Price: 10.50 Smart Investing & Trading Score: 42 | |
| Day Percent Change: 0.67% Day Change: 0.07 | |
| Week Change: 2.14% Year-to-date Change: -26.0% | |
| FOLD Links: Profile News Message Board | |
| Charts:- Daily , Weekly | |
| Add FOLD to Watchlist: View: Get Complete FOLD Trend Analysis ➞ | |
 | ALRM Alarm.com Holdings, Inc. |
| Sector: Technology | |
| SubSector: Application Software | |
| MarketCap: 2035.62 Millions | |
| Recent Price: 67.38 Smart Investing & Trading Score: 39 | |
| Day Percent Change: 0.72% Day Change: 0.48 | |
| Week Change: 2.14% Year-to-date Change: 4.3% | |
| ALRM Links: Profile News Message Board | |
| Charts:- Daily , Weekly | |
| Add ALRM to Watchlist: View: Get Complete ALRM Trend Analysis ➞ | |
 | ADMA ADMA Biologics, Inc. |
| Sector: Health Care | |
| SubSector: Biotechnology | |
| MarketCap: 204.985 Millions | |
| Recent Price: 6.69 Smart Investing & Trading Score: 78 | |
| Day Percent Change: 0.30% Day Change: 0.02 | |
| Week Change: 2.14% Year-to-date Change: 48.0% | |
| ADMA Links: Profile News Message Board | |
| Charts:- Daily , Weekly | |
| Add ADMA to Watchlist: View: Get Complete ADMA Trend Analysis ➞ | |
 | FIGS FIGS, Inc. |
| Sector: Services & Goods | |
| SubSector: Apparel Manufacturing | |
| MarketCap: 1370 Millions | |
| Recent Price: 5.03 Smart Investing & Trading Score: 50 | |
| Day Percent Change: -0.89% Day Change: -0.04 | |
| Week Change: 2.13% Year-to-date Change: -29.5% | |
| FIGS Links: Profile News Message Board | |
| Charts:- Daily , Weekly | |
| Add FIGS to Watchlist: View: Get Complete FIGS Trend Analysis ➞ | |
 | HAE Haemonetics Corporation |
| Sector: Health Care | |
| SubSector: Medical Instruments & Supplies | |
| MarketCap: 4500.7 Millions | |
| Recent Price: 92.92 Smart Investing & Trading Score: 100 | |
| Day Percent Change: 0.86% Day Change: 0.79 | |
| Week Change: 2.12% Year-to-date Change: 8.7% | |
| HAE Links: Profile News Message Board | |
| Charts:- Daily , Weekly | |
| Add HAE to Watchlist: View: Get Complete HAE Trend Analysis ➞ | |
 | AMKR Amkor Technology, Inc. |
| Sector: Technology | |
| SubSector: Semiconductor - Integrated Circuits | |
| MarketCap: 1966.2 Millions | |
| Recent Price: 31.27 Smart Investing & Trading Score: 17 | |
| Day Percent Change: 3.10% Day Change: 0.94 | |
| Week Change: 2.12% Year-to-date Change: -6.0% | |
| AMKR Links: Profile News Message Board | |
| Charts:- Daily , Weekly | |
| Add AMKR to Watchlist: View: Get Complete AMKR Trend Analysis ➞ | |
 | RMR The RMR Group Inc. |
| Sector: Financials | |
| SubSector: Real Estate Development | |
| MarketCap: 797.419 Millions | |
| Recent Price: 24.03 Smart Investing & Trading Score: 49 | |
| Day Percent Change: -0.08% Day Change: -0.02 | |
| Week Change: 2.12% Year-to-date Change: -14.9% | |
| RMR Links: Profile News Message Board | |
| Charts:- Daily , Weekly | |
| Add RMR to Watchlist: View: Get Complete RMR Trend Analysis ➞ | |
 | ESSA ESSA Bancorp, Inc. |
| Sector: Financials | |
| SubSector: Savings & Loans | |
| MarketCap: 171.33 Millions | |
| Recent Price: 16.95 Smart Investing & Trading Score: 57 | |
| Day Percent Change: 0.00% Day Change: 0.00 | |
| Week Change: 2.11% Year-to-date Change: -15.3% | |
| ESSA Links: Profile News Message Board | |
| Charts:- Daily , Weekly | |
| Add ESSA to Watchlist: View: Get Complete ESSA Trend Analysis ➞ | |
 | RGCO RGC Resources, Inc. |
| Sector: Utilities | |
| SubSector: Gas Utilities | |
| MarketCap: 215.277 Millions | |
| Recent Price: 20.94 Smart Investing & Trading Score: 93 | |
| Day Percent Change: 0.00% Day Change: 0.00 | |
| Week Change: 2.1% Year-to-date Change: 3.0% | |
| RGCO Links: Profile News Message Board | |
| Charts:- Daily , Weekly | |
| Add RGCO to Watchlist: View: Get Complete RGCO Trend Analysis ➞ | |
| Too many stocks? View smallcap stocks filtered by marketcap & sector |
| Marketcap: All SmallCap Stocks (default-no microcap), Large, Mid-Range, Small & MicroCap |
| Sector: Tech, Finance, Energy, Staples, Retail, Industrial, Materials, Utilities & Medical |
|
Best Stocks Today 12Stocks.com |
© 2024 12Stocks.com Terms & Conditions Privacy Contact Us
All Information Provided Only For Education And Not To Be Used For Investing or Trading. See Terms & Conditions


One More Thing ... Get Best Stocks Delivered Daily!
Never Ever Miss A Move With Our Top Ten Stocks Lists
Find Best Stocks In Any Market - Bull or Bear Market
Take A Peek At Our Top Ten Stocks Lists: Daily, Weekly, Year-to-Date & Top Trends
Find Best Stocks In Any Market - Bull or Bear Market
Take A Peek At Our Top Ten Stocks Lists: Daily, Weekly, Year-to-Date & Top Trends
Smallcap Stocks With Best Up Trends [0-bearish to 100-bullish]: Gannett Co[100], Pitney Bowes[100], Sprouts Farmers[100], Herbalife Nutrition[100], Gray Television[100], Surmodics [100], TPI Composites[100], Outbrain [100], Fluence Energy[100], Heartland Financial[100], Mercury General[100]
Best Smallcap Stocks Year-to-Date:
Janux [440.16%], Viking [306.02%], Longboard [258.92%], Alpine Immune[239.44%], Bakkt [187.89%], Avidity Biosciences[184.07%], Vera [170.74%], Cullinan Oncology[169.74%], Arcutis Bio[163.93%], Super Micro[161.15%], Y-mAbs [145.23%] Best Smallcap Stocks This Week:
Emergent BioSolutions[110.94%], Eyenovia [45.27%], P3 Health[38.51%], Aspen Aerogels[37.17%], Origin Materials[36.24%], Cue Biopharma[35.9%], Poseida [34.98%], Enovix [32.07%], Surmodics [31.94%], Phibro Animal[28.44%], TransMedics Group[28.2%] Best Smallcap Stocks Daily:
Emergent BioSolutions[109.84%], Aspen Aerogels[45.11%], Gannett Co[31.12%], Enovix [31.06%], Pitney Bowes[23.87%], Office Properties[22.00%], Pulmonx [20.21%], Perdoceo Education[19.25%], Origin Materials[17.75%], Benchmark Electronics[17.40%], Children s[14.21%]