
 Login Sign Up


| |||||
 |  | ||||

| 12Stocks.com Market Intelligence |
Best SmallCap Stocks
|
| In a hurry? Small Cap Stock Lists: Performance Trends Table, Stock Charts
Sort Small Cap stocks: Daily, Weekly, Year-to-Date, Market Cap & Trends. Filter Small Cap stocks list by sector: Show all, Tech, Finance, Energy, Staples, Retail, Industrial, Materials, Utilities and HealthCare Filter Small Cap stocks list by size: All Large Medium Small and MicroCap |
| 12Stocks.com Small Cap Stocks Performances & Trends Daily | |||||||||
|
|  The overall Smart Investing & Trading Score is 14 (0-bearish to 100-bullish) which puts Small Cap index in short term bearish trend. The Smart Investing & Trading Score from previous trading session is 41 and hence a deterioration of trend.
| ||||||||
Here are the Smart Investing & Trading Scores of the most requested small cap stocks at 12Stocks.com (click stock name for detailed review):
|


| 12Stocks.com: Investing in Smallcap Index with Stocks | |
|
The following table helps investors and traders sort through current performance and trends (as measured by Smart Investing & Trading Score) of various
stocks in the Smallcap Index. Quick View: Move mouse or cursor over stock symbol (ticker) to view short-term technical chart and over stock name to view long term chart. Click on  to add stock symbol to your watchlist and to add stock symbol to your watchlist and  to view watchlist. Click on any ticker or stock name for detailed market intelligence report for that stock. to view watchlist. Click on any ticker or stock name for detailed market intelligence report for that stock. |
12Stocks.com Performance of Stocks in Smallcap Index
| Ticker | Stock Name | Watchlist | Category | Recent Price | Smart Investing & Trading Score | Change % | Weekly Change% |
| TRC | Tejon Ranch |   | Financials | 16.83 | 68 | 0.30% | -1.41% |
| LAUR | Laureate Education | | Services & Goods | 14.59 | 48 | 0.62% | -1.42% |
| PRIM | Primoris Services | | Industrials | 45.76 | 46 | -1.80% | -1.42% |
| KWR | Quaker Chemical | | Materials | 187.51 | 17 | 0.53% | -1.43% |
| KN | Knowles | | Technology | 15.80 | 17 | -0.19% | -1.43% |
| RMNI | Rimini Street | | Technology | 2.76 | 27 | 3.76% | -1.43% |
| FC | Franklin Covey | | Services & Goods | 38.97 | 51 | 0.08% | -1.44% |
| SKY | Skyline Champion | | Industrials | 75.24 | 10 | 0.33% | -1.45% |
| ACCO | ACCO Brands | | Consumer Staples | 4.76 | 10 | -1.24% | -1.45% |
| HSHP | Himalaya Shipping | | Industrials | 8.17 | 56 | 0.00% | -1.45% |
| CXW | CoreCivic | | Financials | 14.84 | 10 | -0.40% | -1.46% |
| BLUE | bluebird bio | | Health Care | 0.91 | 22 | 2.50% | -1.46% |
| PX | P10 | | Financials | 7.35 | 46 | 3.52% | -1.47% |
| ABUS | Arbutus Biopharma | | Health Care | 2.69 | 17 | -2.71% | -1.47% |
| HNI | HNI | | Consumer Staples | 41.87 | 15 | -0.19% | -1.48% |
| HLF | Herbalife Nutrition | | Consumer Staples | 8.68 | 30 | 0.35% | -1.48% |
| SHAK | Shake Shack | | Services & Goods | 103.33 | 27 | -2.38% | -1.48% |
| PRVA | Privia Health | | Health Care | 18.00 | 20 | -2.17% | -1.48% |
| PETS | PetMed Express | | Health Care | 3.96 | 20 | 0.25% | -1.49% |
| VMEO | Vimeo | | Technology | 3.63 | 25 | 0.97% | -1.49% |
| EVEX | Eve Holding | | Industrials | 5.28 | 42 | -2.04% | -1.49% |
| MOV | Movado Group | | Consumer Staples | 25.60 | 32 | 0.51% | -1.50% |
| UHG | United Homes | | Services & Goods | 6.57 | 42 | -1.79% | -1.50% |
| VGAS | Verde Clean | | Utilities | 4.53 | 50 | -7.55% | -1.52% |
| LICY | Li-Cycle | | Industrials | 0.67 | 46 | 1.57% | -1.52% |


| Too many stocks? View smallcap stocks filtered by marketcap & sector |
| Marketcap: All SmallCap Stocks (default-no microcap), Large, Mid-Range, Small |
| Smallcap Sector: Tech, Finance, Energy, Staples, Retail, Industrial, Materials, & Medical |
|
Get the most comprehensive stock market coverage daily at 12Stocks.com ➞ Best Stocks Today ➞ Best Stocks Weekly ➞ Best Stocks Year-to-Date ➞ Best Stocks Trends ➞  Best Stocks Today 12Stocks.com Best Nasdaq Stocks ➞ Best S&P 500 Stocks ➞ Best Tech Stocks ➞ Best Biotech Stocks ➞ |
| Detailed Overview of SmallCap Stocks |
| SmallCap Technical Overview, Leaders & Laggards, Top SmallCap ETF Funds & Detailed SmallCap Stocks List, Charts, Trends & More |
| Smallcap: Technical Analysis, Trends & YTD Performance | |
| SmallCap segment as represented by
IWM, an exchange-traded fund [ETF], holds basket of thousands of smallcap stocks from across all major sectors of the US stock market. The smallcap index (contains stocks like Riverbed & Sotheby's) is down by -2.19% and is currently underperforming the overall market by -6.73% year-to-date. Below is a quick view of technical charts and trends: | |
 IWM Weekly Chart |
|
| Long Term Trend: Not Good | |
| Medium Term Trend: Not Good | |
 IWM Daily Chart |
|
| Short Term Trend: Not Good | |
| Overall Trend Score: 14 | |
| YTD Performance: -2.19% | |
| **Trend Scores & Views Are Only For Educational Purposes And Not For Investing | |
| 12Stocks.com: Top Performing Small Cap Index Stocks | ||||||||||||||||||||||||||||||||||||||||||||||||
 The top performing Small Cap Index stocks year to date are
Now, more recently, over last week, the top performing Small Cap Index stocks on the move are


|
||||||||||||||||||||||||||||||||||||||||||||||||
| 12Stocks.com: Investing in Smallcap Index using Exchange Traded Funds | |
|
The following table shows list of key exchange traded funds (ETF) that
help investors track Smallcap index. The following list also includes leveraged ETF funds that track twice or thrice the daily returns of Smallcap indices. Short or inverse ETF funds move in the opposite direction to the index they track and are useful during market pullbacks or during bear markets. Quick View: Move mouse or cursor over ETF symbol (ticker) to view short-term technical chart and over ETF name to view long term chart. Click on ticker or stock name for detailed view. Click on to add stock symbol to your watchlist and to view watchlist. |
12Stocks.com List of ETFs that track Smallcap Index
| Ticker | ETF Name | Watchlist | Recent Price | Smart Investing & Trading Score | Change % | Week % | Year-to-date % |
| IWM | iShares Russell 2000 | | 196.31 | 14 | 0.21 | -1.05 | -2.19% |
| IJR | iShares Core S&P Small-Cap | | 104.74 | 22 | 0.34 | -0.86 | -3.24% |
| VTWO | Vanguard Russell 2000 ETF | | 79.36 | 14 | 0.25 | -1.07 | -2.15% |
| IWN | iShares Russell 2000 Value | | 149.82 | 22 | 0.52 | -0.87 | -3.55% |
| IJS | iShares S&P Small-Cap 600 Value | | 96.40 | 15 | 0.33 | -0.81 | -6.47% |
| IWO | iShares Russell 2000 Growth | | 249.58 | 7 | -0.30 | -1.39 | -1.05% |
| IJT | iShares S&P Small-Cap 600 Growth | | 124.94 | 15 | 0.27 | -0.91 | -0.16% |
| XSLV | PowerShares S&P SmallCap Low Volatil ETF | | 42.83 | 62 | 0.68 | 0.26 | -2.99% |
| SDD | ProShares UltraShort SmallCap600 | | 19.71 | 86 | 0.70 | 1.85 | 6.95% |
| SMLV | SPDR SSGA US Small Cap Low Volatil ETF | | 107.44 | 45 | 1.11 | -0.07 | -4.51% |
| SBB | ProShares Short SmallCap600 | | 16.56 | 79 | 0.05 | 1.06 | 3.94% |
| SAA | ProShares Ultra SmallCap600 | | 22.58 | 8 | -0.08 | -1.99 | -9.49% |
| 12Stocks.com: Charts, Trends, Fundamental Data and Performances of SmallCap Stocks | |
|
We now take in-depth look at all SmallCap stocks including charts, multi-period performances and overall trends (as measured by Smart Investing & Trading Score). One can sort SmallCap stocks (click link to choose) by Daily, Weekly and by Year-to-Date performances. Also, one can sort by size of the company or by market capitalization. |
| Select Your Default Chart Type: | |||||
| |||||
| Click on stock symbol or name for detailed view. Click on to add stock symbol to your watchlist and to view watchlist. Quick View: Move mouse or cursor over "Daily" to quickly view daily technical stock chart and over "Weekly" to view weekly technical stock chart. | |||||

 | TRC Tejon Ranch Co. |
| Sector: Financials | |
| SubSector: Property Management | |
| MarketCap: 346.442 Millions | |
| Recent Price: 16.83 Smart Investing & Trading Score: 68 | |
| Day Percent Change: 0.30% Day Change: 0.05 | |
| Week Change: -1.41% Year-to-date Change: -2.2% | |
| TRC Links: Profile News Message Board | |
| Charts:- Daily , Weekly | |
| Add TRC to Watchlist: View: Get Complete TRC Trend Analysis ➞ | |
 | LAUR Laureate Education, Inc. |
| Sector: Services & Goods | |
| SubSector: Education & Training Services | |
| MarketCap: 2258.56 Millions | |
| Recent Price: 14.59 Smart Investing & Trading Score: 48 | |
| Day Percent Change: 0.62% Day Change: 0.09 | |
| Week Change: -1.42% Year-to-date Change: 6.4% | |
| LAUR Links: Profile News Message Board | |
| Charts:- Daily , Weekly | |
| Add LAUR to Watchlist: View: Get Complete LAUR Trend Analysis ➞ | |
 | PRIM Primoris Services Corporation |
| Sector: Industrials | |
| SubSector: Heavy Construction | |
| MarketCap: 931.895 Millions | |
| Recent Price: 45.76 Smart Investing & Trading Score: 46 | |
| Day Percent Change: -1.80% Day Change: -0.84 | |
| Week Change: -1.42% Year-to-date Change: 37.8% | |
| PRIM Links: Profile News Message Board | |
| Charts:- Daily , Weekly | |
| Add PRIM to Watchlist: View: Get Complete PRIM Trend Analysis ➞ | |
 | KWR Quaker Chemical Corporation |
| Sector: Materials | |
| SubSector: Specialty Chemicals | |
| MarketCap: 2411.67 Millions | |
| Recent Price: 187.51 Smart Investing & Trading Score: 17 | |
| Day Percent Change: 0.53% Day Change: 0.98 | |
| Week Change: -1.43% Year-to-date Change: -12.1% | |
| KWR Links: Profile News Message Board | |
| Charts:- Daily , Weekly | |
| Add KWR to Watchlist: View: Get Complete KWR Trend Analysis ➞ | |
 | KN Knowles Corporation |
| Sector: Technology | |
| SubSector: Communication Equipment | |
| MarketCap: 1231.39 Millions | |
| Recent Price: 15.80 Smart Investing & Trading Score: 17 | |
| Day Percent Change: -0.19% Day Change: -0.03 | |
| Week Change: -1.43% Year-to-date Change: -11.8% | |
| KN Links: Profile News Message Board | |
| Charts:- Daily , Weekly | |
| Add KN to Watchlist: View: Get Complete KN Trend Analysis ➞ | |
 | RMNI Rimini Street, Inc. |
| Sector: Technology | |
| SubSector: Application Software | |
| MarketCap: 288.762 Millions | |
| Recent Price: 2.76 Smart Investing & Trading Score: 27 | |
| Day Percent Change: 3.76% Day Change: 0.10 | |
| Week Change: -1.43% Year-to-date Change: -15.6% | |
| RMNI Links: Profile News Message Board | |
| Charts:- Daily , Weekly | |
| Add RMNI to Watchlist: View: Get Complete RMNI Trend Analysis ➞ | |
 | FC Franklin Covey Co. |
| Sector: Services & Goods | |
| SubSector: Education & Training Services | |
| MarketCap: 243.306 Millions | |
| Recent Price: 38.97 Smart Investing & Trading Score: 51 | |
| Day Percent Change: 0.08% Day Change: 0.03 | |
| Week Change: -1.44% Year-to-date Change: -10.5% | |
| FC Links: Profile News Message Board | |
| Charts:- Daily , Weekly | |
| Add FC to Watchlist: View: Get Complete FC Trend Analysis ➞ | |
 | SKY Skyline Champion Corporation |
| Sector: Industrials | |
| SubSector: Manufactured Housing | |
| MarketCap: 915.145 Millions | |
| Recent Price: 75.24 Smart Investing & Trading Score: 10 | |
| Day Percent Change: 0.33% Day Change: 0.25 | |
| Week Change: -1.45% Year-to-date Change: 1.3% | |
| SKY Links: Profile News Message Board | |
| Charts:- Daily , Weekly | |
| Add SKY to Watchlist: View: Get Complete SKY Trend Analysis ➞ | |
 | ACCO ACCO Brands Corporation |
| Sector: Consumer Staples | |
| SubSector: Office Supplies | |
| MarketCap: 448.2 Millions | |
| Recent Price: 4.76 Smart Investing & Trading Score: 10 | |
| Day Percent Change: -1.24% Day Change: -0.06 | |
| Week Change: -1.45% Year-to-date Change: -21.7% | |
| ACCO Links: Profile News Message Board | |
| Charts:- Daily , Weekly | |
| Add ACCO to Watchlist: View: Get Complete ACCO Trend Analysis ➞ | |
 | HSHP Himalaya Shipping Ltd. |
| Sector: Industrials | |
| SubSector: Marine Shipping | |
| MarketCap: 179 Millions | |
| Recent Price: 8.17 Smart Investing & Trading Score: 56 | |
| Day Percent Change: 0.00% Day Change: 0.00 | |
| Week Change: -1.45% Year-to-date Change: 21.0% | |
| HSHP Links: Profile News Message Board | |
| Charts:- Daily , Weekly | |
| Add HSHP to Watchlist: View: Get Complete HSHP Trend Analysis ➞ | |
 | CXW CoreCivic, Inc. |
| Sector: Financials | |
| SubSector: REIT - Diversified | |
| MarketCap: 1440.23 Millions | |
| Recent Price: 14.84 Smart Investing & Trading Score: 10 | |
| Day Percent Change: -0.40% Day Change: -0.06 | |
| Week Change: -1.46% Year-to-date Change: 2.1% | |
| CXW Links: Profile News Message Board | |
| Charts:- Daily , Weekly | |
| Add CXW to Watchlist: View: Get Complete CXW Trend Analysis ➞ | |
 | BLUE bluebird bio, Inc. |
| Sector: Health Care | |
| SubSector: Biotechnology | |
| MarketCap: 3365.05 Millions | |
| Recent Price: 0.91 Smart Investing & Trading Score: 22 | |
| Day Percent Change: 2.50% Day Change: 0.02 | |
| Week Change: -1.46% Year-to-date Change: -34.1% | |
| BLUE Links: Profile News Message Board | |
| Charts:- Daily , Weekly | |
| Add BLUE to Watchlist: View: Get Complete BLUE Trend Analysis ➞ | |
 | PX P10, Inc. |
| Sector: Financials | |
| SubSector: Asset Management | |
| MarketCap: 1300 Millions | |
| Recent Price: 7.35 Smart Investing & Trading Score: 46 | |
| Day Percent Change: 3.52% Day Change: 0.25 | |
| Week Change: -1.47% Year-to-date Change: -28.1% | |
| PX Links: Profile News Message Board | |
| Charts:- Daily , Weekly | |
| Add PX to Watchlist: View: Get Complete PX Trend Analysis ➞ | |
 | ABUS Arbutus Biopharma Corporation |
| Sector: Health Care | |
| SubSector: Biotechnology | |
| MarketCap: 110.885 Millions | |
| Recent Price: 2.69 Smart Investing & Trading Score: 17 | |
| Day Percent Change: -2.71% Day Change: -0.08 | |
| Week Change: -1.47% Year-to-date Change: 7.6% | |
| ABUS Links: Profile News Message Board | |
| Charts:- Daily , Weekly | |
| Add ABUS to Watchlist: View: Get Complete ABUS Trend Analysis ➞ | |
 | HNI HNI Corporation |
| Sector: Consumer Staples | |
| SubSector: Business Equipment | |
| MarketCap: 1053.67 Millions | |
| Recent Price: 41.87 Smart Investing & Trading Score: 15 | |
| Day Percent Change: -0.19% Day Change: -0.08 | |
| Week Change: -1.48% Year-to-date Change: 0.1% | |
| HNI Links: Profile News Message Board | |
| Charts:- Daily , Weekly | |
| Add HNI to Watchlist: View: Get Complete HNI Trend Analysis ➞ | |
 | HLF Herbalife Nutrition Ltd. |
| Sector: Consumer Staples | |
| SubSector: Personal Products | |
| MarketCap: 4884.65 Millions | |
| Recent Price: 8.68 Smart Investing & Trading Score: 30 | |
| Day Percent Change: 0.35% Day Change: 0.03 | |
| Week Change: -1.48% Year-to-date Change: -43.1% | |
| HLF Links: Profile News Message Board | |
| Charts:- Daily , Weekly | |
| Add HLF to Watchlist: View: Get Complete HLF Trend Analysis ➞ | |
 | SHAK Shake Shack Inc. |
| Sector: Services & Goods | |
| SubSector: Specialty Eateries | |
| MarketCap: 1497.67 Millions | |
| Recent Price: 103.33 Smart Investing & Trading Score: 27 | |
| Day Percent Change: -2.38% Day Change: -2.52 | |
| Week Change: -1.48% Year-to-date Change: 39.4% | |
| SHAK Links: Profile News Message Board | |
| Charts:- Daily , Weekly | |
| Add SHAK to Watchlist: View: Get Complete SHAK Trend Analysis ➞ | |
 | PRVA Privia Health Group, Inc. |
| Sector: Health Care | |
| SubSector: Health Information Services | |
| MarketCap: 3130 Millions | |
| Recent Price: 18.00 Smart Investing & Trading Score: 20 | |
| Day Percent Change: -2.17% Day Change: -0.40 | |
| Week Change: -1.48% Year-to-date Change: -23.8% | |
| PRVA Links: Profile News Message Board | |
| Charts:- Daily , Weekly | |
| Add PRVA to Watchlist: View: Get Complete PRVA Trend Analysis ➞ | |
 | PETS PetMed Express, Inc. |
| Sector: Health Care | |
| SubSector: Drug Delivery | |
| MarketCap: 528.23 Millions | |
| Recent Price: 3.96 Smart Investing & Trading Score: 20 | |
| Day Percent Change: 0.25% Day Change: 0.01 | |
| Week Change: -1.49% Year-to-date Change: -47.6% | |
| PETS Links: Profile News Message Board | |
| Charts:- Daily , Weekly | |
| Add PETS to Watchlist: View: Get Complete PETS Trend Analysis ➞ | |
 | VMEO Vimeo, Inc. |
| Sector: Technology | |
| SubSector: Software - Application | |
| MarketCap: 678 Millions | |
| Recent Price: 3.63 Smart Investing & Trading Score: 25 | |
| Day Percent Change: 0.97% Day Change: 0.03 | |
| Week Change: -1.49% Year-to-date Change: -7.4% | |
| VMEO Links: Profile News Message Board | |
| Charts:- Daily , Weekly | |
| Add VMEO to Watchlist: View: Get Complete VMEO Trend Analysis ➞ | |
 | EVEX Eve Holding, Inc. |
| Sector: Industrials | |
| SubSector: Aerospace & Defense | |
| MarketCap: 2830 Millions | |
| Recent Price: 5.28 Smart Investing & Trading Score: 42 | |
| Day Percent Change: -2.04% Day Change: -0.11 | |
| Week Change: -1.49% Year-to-date Change: -28.3% | |
| EVEX Links: Profile News Message Board | |
| Charts:- Daily , Weekly | |
| Add EVEX to Watchlist: View: Get Complete EVEX Trend Analysis ➞ | |
 | MOV Movado Group, Inc. |
| Sector: Consumer Staples | |
| SubSector: Recreational Goods, Other | |
| MarketCap: 161.659 Millions | |
| Recent Price: 25.60 Smart Investing & Trading Score: 32 | |
| Day Percent Change: 0.51% Day Change: 0.13 | |
| Week Change: -1.5% Year-to-date Change: -15.1% | |
| MOV Links: Profile News Message Board | |
| Charts:- Daily , Weekly | |
| Add MOV to Watchlist: View: Get Complete MOV Trend Analysis ➞ | |
 | UHG United Homes Group, Inc. |
| Sector: Services & Goods | |
| SubSector: Residential Construction | |
| MarketCap: 566 Millions | |
| Recent Price: 6.57 Smart Investing & Trading Score: 42 | |
| Day Percent Change: -1.79% Day Change: -0.12 | |
| Week Change: -1.5% Year-to-date Change: -21.7% | |
| UHG Links: Profile News Message Board | |
| Charts:- Daily , Weekly | |
| Add UHG to Watchlist: View: Get Complete UHG Trend Analysis ➞ | |
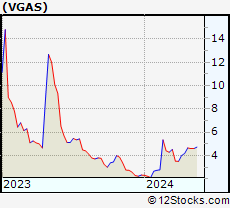 | VGAS Verde Clean Fuels, Inc. |
| Sector: Utilities | |
| SubSector: Utilities - Renewable | |
| MarketCap: 204 Millions | |
| Recent Price: 4.53 Smart Investing & Trading Score: 50 | |
| Day Percent Change: -7.55% Day Change: -0.37 | |
| Week Change: -1.52% Year-to-date Change: 94.4% | |
| VGAS Links: Profile News Message Board | |
| Charts:- Daily , Weekly | |
| Add VGAS to Watchlist: View: Get Complete VGAS Trend Analysis ➞ | |
 | LICY Li-Cycle Holdings Corp. |
| Sector: Industrials | |
| SubSector: Waste Management | |
| MarketCap: 959 Millions | |
| Recent Price: 0.67 Smart Investing & Trading Score: 46 | |
| Day Percent Change: 1.57% Day Change: 0.01 | |
| Week Change: -1.52% Year-to-date Change: 7.0% | |
| LICY Links: Profile News Message Board | |
| Charts:- Daily , Weekly | |
| Add LICY to Watchlist: View: Get Complete LICY Trend Analysis ➞ | |
| Too many stocks? View smallcap stocks filtered by marketcap & sector |
| Marketcap: All SmallCap Stocks (default-no microcap), Large, Mid-Range, Small & MicroCap |
| Sector: Tech, Finance, Energy, Staples, Retail, Industrial, Materials, Utilities & Medical |
|
Best Stocks Today 12Stocks.com |
© 2024 12Stocks.com Terms & Conditions Privacy Contact Us
All Information Provided Only For Education And Not To Be Used For Investing or Trading. See Terms & Conditions


One More Thing ... Get Best Stocks Delivered Daily!
Never Ever Miss A Move With Our Top Ten Stocks Lists
Find Best Stocks In Any Market - Bull or Bear Market
Take A Peek At Our Top Ten Stocks Lists: Daily, Weekly, Year-to-Date & Top Trends
Find Best Stocks In Any Market - Bull or Bear Market
Take A Peek At Our Top Ten Stocks Lists: Daily, Weekly, Year-to-Date & Top Trends
Smallcap Stocks With Best Up Trends [0-bearish to 100-bullish]: Surmodics [100], Rocky Brands[100], TransMedics Group[100], LendingClub [100], Summit [100], A10 s[100], Carpenter [100], UFP [100], PROCEPT BioRobotics[100], Xencor [100], Trinity Industries[100]
Best Smallcap Stocks Year-to-Date:
Janux [441.55%], Viking [310.69%], Longboard [259.25%], Alpine Immune[239.29%], Avidity Biosciences[185.4%], Bakkt [182.96%], Cullinan Oncology[175.33%], Arcutis Bio[173.68%], Vera [173.32%], Super Micro[159.73%], Y-mAbs [141.79%] Best Smallcap Stocks This Week:
Deciphera [73.11%], Eyenovia [45.65%], Cue Biopharma[39.56%], Seres [30.91%], Poseida [30.05%], P3 Health[29.62%], Phibro Animal[28.44%], TransMedics Group[27.72%], Surmodics [27.36%], LendingTree [26.36%], Rocky Brands[24.92%] Best Smallcap Stocks Daily:
Surmodics [29.74%], Rocky Brands[28.41%], TransMedics Group[24.93%], Ventyx Biosciences[24.63%], Eyenovia [21.84%], LendingClub [19.68%], Summit [19.59%], Powell Industries[18.89%], MiMedx Group[18.67%], CareDx [18.30%], A10 s[17.69%]