
 Login Sign Up


| |||||
 |  | ||||

| 12Stocks.com Market Intelligence |
Best SmallCap Stocks
|
| In a hurry? Small Cap Stock Lists: Performance Trends Table, Stock Charts
Sort Small Cap stocks: Daily, Weekly, Year-to-Date, Market Cap & Trends. Filter Small Cap stocks list by sector: Show all, Tech, Finance, Energy, Staples, Retail, Industrial, Materials, Utilities and HealthCare Filter Small Cap stocks list by size: All Large Medium Small and MicroCap |
| 12Stocks.com Small Cap Stocks Performances & Trends Daily | |||||||||
|
|  The overall Smart Investing & Trading Score is 49 (0-bearish to 100-bullish) which puts Small Cap index in short term neutral trend. The Smart Investing & Trading Score from previous trading session is 14 and hence an improvement of trend.
| ||||||||
Here are the Smart Investing & Trading Scores of the most requested small cap stocks at 12Stocks.com (click stock name for detailed review):
|


| 12Stocks.com: Investing in Smallcap Index with Stocks | |
|
The following table helps investors and traders sort through current performance and trends (as measured by Smart Investing & Trading Score) of various
stocks in the Smallcap Index. Quick View: Move mouse or cursor over stock symbol (ticker) to view short-term technical chart and over stock name to view long term chart. Click on  to add stock symbol to your watchlist and to add stock symbol to your watchlist and  to view watchlist. Click on any ticker or stock name for detailed market intelligence report for that stock. to view watchlist. Click on any ticker or stock name for detailed market intelligence report for that stock. |
12Stocks.com Performance of Stocks in Smallcap Index
| Ticker | Stock Name | Watchlist | Category | Recent Price | Smart Investing & Trading Score | Change % | Weekly Change% |
| NWN | Northwest Natural |   | Utilities | 38.93 | 95 | 0.36% | 1.59% |
| KMT | Kennametal | | Industrials | 24.42 | 60 | 1.08% | 1.58% |
| PAGS | PagSeguro Digital | | Financials | 12.88 | 42 | 2.30% | 1.58% |
| BELFB | Bel Fuse | | Technology | 58.82 | 51 | 0.43% | 1.57% |
| BLKB | Blackbaud | | Technology | 79.17 | 76 | 0.94% | 1.57% |
| NEXT | NextDecade | | Energy | 6.50 | 63 | 0.08% | 1.56% |
| ZUO | Zuora | | Technology | 10.11 | 68 | 3.43% | 1.56% |
| IONQ | IonQ | | Technology | 9.11 | 45 | 2.36% | 1.56% |
| TH | Target Hospitality | | Industrials | 11.29 | 73 | 0.53% | 1.53% |
| CNSL | Consolidated | | Technology | 4.34 | 47 | 0.12% | 1.52% |
| LZB | La-Z-Boy | | Consumer Staples | 33.61 | 10 | 1.91% | 1.51% |
| GES | Guess | | Services & Goods | 26.63 | 43 | 1.35% | 1.51% |
| ALTI | AlTi Global | | Financials | 4.81 | 42 | -1.84% | 1.48% |
| CCSI | Consensus Cloud | | Technology | 12.45 | 37 | 4.80% | 1.47% |
| NOTE | FiscalNote | | Technology | 1.39 | 32 | 6.11% | 1.46% |
| KAR | KAR Auction | | Services & Goods | 17.67 | 76 | 0.51% | 1.44% |
| IBCP | Independent Bank | | Financials | 25.35 | 66 | 1.24% | 1.44% |
| SUPN | Supernus | | Health Care | 30.50 | 61 | 0.76% | 1.43% |
| VSH | Vishay Inter | | Technology | 22.95 | 68 | 1.59% | 1.41% |
| PX | P10 | | Financials | 7.57 | 46 | 2.79% | 1.41% |
| MATX | Matson | | Transports | 110.48 | 27 | 1.26% | 1.41% |
| FCF | First Commonwealth | | Financials | 13.74 | 95 | 1.10% | 1.40% |
| DHT | DHT | | Transports | 11.67 | 100 | -0.85% | 1.39% |
| RDN | Radian Group | | Financials | 30.77 | 80 | 0.10% | 1.38% |
| NNI | Nelnet | | Financials | 96.11 | 95 | 0.22% | 1.36% |
| For chart view version of above stock list: Chart View ➞ 0 - 25 , 25 - 50 , 50 - 75 , 75 - 100 , 100 - 125 , 125 - 150 , 150 - 175 , 175 - 200 , 200 - 225 , 225 - 250 , 250 - 275 , 275 - 300 , 300 - 325 , 325 - 350 , 350 - 375 , 375 - 400 , 400 - 425 , 425 - 450 , 450 - 475 , 475 - 500 , 500 - 525 , 525 - 550 , 550 - 575 , 575 - 600 , 600 - 625 , 625 - 650 , 650 - 675 , 675 - 700 , 700 - 725 , 725 - 750 , 750 - 775 , 775 - 800 , 800 - 825 , 825 - 850 , 850 - 875 , 875 - 900 , 900 - 925 , 925 - 950 , 950 - 975 , 975 - 1000 , 1000 - 1025 , 1025 - 1050 , 1050 - 1075 , 1075 - 1100 , 1100 - 1125 , 1125 - 1150 , 1150 - 1175 , 1175 - 1200 , 1200 - 1225 , 1225 - 1250 , 1250 - 1275 , 1275 - 1300 , 1300 - 1325 , 1325 - 1350 , 1350 - 1375 , 1375 - 1400 , 1400 - 1425 , 1425 - 1450 , 1450 - 1475 , 1475 - 1500 , 1500 - 1525 , 1525 - 1550 , 1550 - 1575 , 1575 - 1600 | ||
 | Click To Change The Sort Order: By Market Cap or Company Size Performance: Year-to-date, Week and Day |  |
| Too many stocks? View smallcap stocks filtered by marketcap & sector |
| Marketcap: All SmallCap Stocks (default-no microcap), Large, Mid-Range, Small |
| Smallcap Sector: Tech, Finance, Energy, Staples, Retail, Industrial, Materials, & Medical |
|
Get the most comprehensive stock market coverage daily at 12Stocks.com ➞ Best Stocks Today ➞ Best Stocks Weekly ➞ Best Stocks Year-to-Date ➞ Best Stocks Trends ➞  Best Stocks Today 12Stocks.com Best Nasdaq Stocks ➞ Best S&P 500 Stocks ➞ Best Tech Stocks ➞ Best Biotech Stocks ➞ |
| Detailed Overview of SmallCap Stocks |
| SmallCap Technical Overview, Leaders & Laggards, Top SmallCap ETF Funds & Detailed SmallCap Stocks List, Charts, Trends & More |
| Smallcap: Technical Analysis, Trends & YTD Performance | |
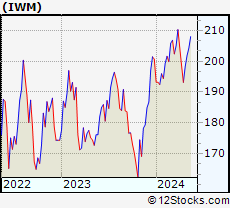
| SmallCap segment as represented by
IWM, an exchange-traded fund [ETF], holds basket of thousands of smallcap stocks from across all major sectors of the US stock market. The smallcap index (contains stocks like Riverbed & Sotheby's) is up by 1.11% and is currently underperforming the overall market by -5.68% year-to-date. Below is a quick view of technical charts and trends: | |
 IWM Weekly Chart |
|
| Long Term Trend: Not Good | |
| Medium Term Trend: Good | |
 IWM Daily Chart |
|
| Short Term Trend: Deteriorating | |
| Overall Trend Score: 49 | |
| YTD Performance: 1.11% | |
| **Trend Scores & Views Are Only For Educational Purposes And Not For Investing | |
| 12Stocks.com: Top Performing Small Cap Index Stocks | ||||||||||||||||||||||||||||||||||||||||||||||||
 The top performing Small Cap Index stocks year to date are
Now, more recently, over last week, the top performing Small Cap Index stocks on the move are


|
||||||||||||||||||||||||||||||||||||||||||||||||
| 12Stocks.com: Investing in Smallcap Index using Exchange Traded Funds | |
|
The following table shows list of key exchange traded funds (ETF) that
help investors track Smallcap index. The following list also includes leveraged ETF funds that track twice or thrice the daily returns of Smallcap indices. Short or inverse ETF funds move in the opposite direction to the index they track and are useful during market pullbacks or during bear markets. Quick View: Move mouse or cursor over ETF symbol (ticker) to view short-term technical chart and over ETF name to view long term chart. Click on ticker or stock name for detailed view. Click on to add stock symbol to your watchlist and to view watchlist. |
12Stocks.com List of ETFs that track Smallcap Index
| Ticker | ETF Name | Watchlist | Recent Price | Smart Investing & Trading Score | Change % | Week % | Year-to-date % |
| IWM | iShares Russell 2000 | | 202.94 | 49 | 1.51 | 2.29 | 1.11% |
| SDD | ProShares UltraShort SmallCap600 | | 18.35 | 56 | -4.97 | -5.17 | -0.42% |
| SBB | ProShares Short SmallCap600 | | 16.33 | 49 | -0.25 | -0.34 | 2.51% |
| SAA | ProShares Ultra SmallCap600 | | 23.93 | 42 | 4.36 | 3.88 | -4.07% |
| 12Stocks.com: Charts, Trends, Fundamental Data and Performances of SmallCap Stocks | |
|
We now take in-depth look at all SmallCap stocks including charts, multi-period performances and overall trends (as measured by Smart Investing & Trading Score). One can sort SmallCap stocks (click link to choose) by Daily, Weekly and by Year-to-Date performances. Also, one can sort by size of the company or by market capitalization. |
| Select Your Default Chart Type: | |||||
| |||||
| Click on stock symbol or name for detailed view. Click on to add stock symbol to your watchlist and to view watchlist. Quick View: Move mouse or cursor over "Daily" to quickly view daily technical stock chart and over "Weekly" to view weekly technical stock chart. | |||||

 | NWN Northwest Natural Holding Company |
| Sector: Utilities | |
| SubSector: Gas Utilities | |
| MarketCap: 2058.17 Millions | |
| Recent Price: 38.93 Smart Investing & Trading Score: 95 | |
| Day Percent Change: 0.36% Day Change: 0.14 | |
| Week Change: 1.59% Year-to-date Change: 0.0% | |
| NWN Links: Profile News Message Board | |
| Charts:- Daily , Weekly | |
| Add NWN to Watchlist: View: Get Complete NWN Trend Analysis ➞ | |
 | KMT Kennametal Inc. |
| Sector: Industrials | |
| SubSector: Machine Tools & Accessories | |
| MarketCap: 1486.48 Millions | |
| Recent Price: 24.42 Smart Investing & Trading Score: 60 | |
| Day Percent Change: 1.08% Day Change: 0.26 | |
| Week Change: 1.58% Year-to-date Change: -5.3% | |
| KMT Links: Profile News Message Board | |
| Charts:- Daily , Weekly | |
| Add KMT to Watchlist: View: Get Complete KMT Trend Analysis ➞ | |
 | PAGS PagSeguro Digital Ltd. |
| Sector: Financials | |
| SubSector: Credit Services | |
| MarketCap: 6500.78 Millions | |
| Recent Price: 12.88 Smart Investing & Trading Score: 42 | |
| Day Percent Change: 2.30% Day Change: 0.29 | |
| Week Change: 1.58% Year-to-date Change: 3.3% | |
| PAGS Links: Profile News Message Board | |
| Charts:- Daily , Weekly | |
| Add PAGS to Watchlist: View: Get Complete PAGS Trend Analysis ➞ | |
 | BELFB Bel Fuse Inc. |
| Sector: Technology | |
| SubSector: Diversified Electronics | |
| MarketCap: 77.0396 Millions | |
| Recent Price: 58.82 Smart Investing & Trading Score: 51 | |
| Day Percent Change: 0.43% Day Change: 0.25 | |
| Week Change: 1.57% Year-to-date Change: -11.9% | |
| BELFB Links: Profile News Message Board | |
| Charts:- Daily , Weekly | |
| Add BELFB to Watchlist: View: Get Complete BELFB Trend Analysis ➞ | |
 | BLKB Blackbaud, Inc. |
| Sector: Technology | |
| SubSector: Business Software & Services | |
| MarketCap: 2838.48 Millions | |
| Recent Price: 79.17 Smart Investing & Trading Score: 76 | |
| Day Percent Change: 0.94% Day Change: 0.74 | |
| Week Change: 1.57% Year-to-date Change: -8.7% | |
| BLKB Links: Profile News Message Board | |
| Charts:- Daily , Weekly | |
| Add BLKB to Watchlist: View: Get Complete BLKB Trend Analysis ➞ | |
 | NEXT NextDecade Corporation |
| Sector: Energy | |
| SubSector: Independent Oil & Gas | |
| MarketCap: 270.893 Millions | |
| Recent Price: 6.50 Smart Investing & Trading Score: 63 | |
| Day Percent Change: 0.08% Day Change: 0.00 | |
| Week Change: 1.56% Year-to-date Change: 36.3% | |
| NEXT Links: Profile News Message Board | |
| Charts:- Daily , Weekly | |
| Add NEXT to Watchlist: View: Get Complete NEXT Trend Analysis ➞ | |
 | ZUO Zuora, Inc. |
| Sector: Technology | |
| SubSector: Application Software | |
| MarketCap: 1063.22 Millions | |
| Recent Price: 10.11 Smart Investing & Trading Score: 68 | |
| Day Percent Change: 3.43% Day Change: 0.34 | |
| Week Change: 1.56% Year-to-date Change: 7.5% | |
| ZUO Links: Profile News Message Board | |
| Charts:- Daily , Weekly | |
| Add ZUO to Watchlist: View: Get Complete ZUO Trend Analysis ➞ | |
 | IONQ IonQ, Inc. |
| Sector: Technology | |
| SubSector: Computer Hardware | |
| MarketCap: 2680 Millions | |
| Recent Price: 9.11 Smart Investing & Trading Score: 45 | |
| Day Percent Change: 2.36% Day Change: 0.21 | |
| Week Change: 1.56% Year-to-date Change: -26.9% | |
| IONQ Links: Profile News Message Board | |
| Charts:- Daily , Weekly | |
| Add IONQ to Watchlist: View: Get Complete IONQ Trend Analysis ➞ | |
 | TH Target Hospitality Corp. |
| Sector: Industrials | |
| SubSector: Conglomerates | |
| MarketCap: 218.048 Millions | |
| Recent Price: 11.29 Smart Investing & Trading Score: 73 | |
| Day Percent Change: 0.53% Day Change: 0.06 | |
| Week Change: 1.53% Year-to-date Change: 16.0% | |
| TH Links: Profile News Message Board | |
| Charts:- Daily , Weekly | |
| Add TH to Watchlist: View: Get Complete TH Trend Analysis ➞ | |
 | CNSL Consolidated Communications Holdings, Inc. |
| Sector: Technology | |
| SubSector: Telecom Services - Domestic | |
| MarketCap: 319.677 Millions | |
| Recent Price: 4.34 Smart Investing & Trading Score: 47 | |
| Day Percent Change: 0.12% Day Change: 0.00 | |
| Week Change: 1.52% Year-to-date Change: -0.3% | |
| CNSL Links: Profile News Message Board | |
| Charts:- Daily , Weekly | |
| Add CNSL to Watchlist: View: Get Complete CNSL Trend Analysis ➞ | |
 | LZB La-Z-Boy Incorporated |
| Sector: Consumer Staples | |
| SubSector: Home Furnishings & Fixtures | |
| MarketCap: 951.635 Millions | |
| Recent Price: 33.61 Smart Investing & Trading Score: 10 | |
| Day Percent Change: 1.91% Day Change: 0.63 | |
| Week Change: 1.51% Year-to-date Change: -9.0% | |
| LZB Links: Profile News Message Board | |
| Charts:- Daily , Weekly | |
| Add LZB to Watchlist: View: Get Complete LZB Trend Analysis ➞ | |
 | GES Guess , Inc. |
| Sector: Services & Goods | |
| SubSector: Apparel Stores | |
| MarketCap: 591.908 Millions | |
| Recent Price: 26.63 Smart Investing & Trading Score: 43 | |
| Day Percent Change: 1.35% Day Change: 0.36 | |
| Week Change: 1.51% Year-to-date Change: 15.5% | |
| GES Links: Profile News Message Board | |
| Charts:- Daily , Weekly | |
| Add GES to Watchlist: View: Get Complete GES Trend Analysis ➞ | |
 | ALTI AlTi Global, Inc. |
| Sector: Financials | |
| SubSector: Asset Management | |
| MarketCap: 917 Millions | |
| Recent Price: 4.81 Smart Investing & Trading Score: 42 | |
| Day Percent Change: -1.84% Day Change: -0.09 | |
| Week Change: 1.48% Year-to-date Change: -47.0% | |
| ALTI Links: Profile News Message Board | |
| Charts:- Daily , Weekly | |
| Add ALTI to Watchlist: View: Get Complete ALTI Trend Analysis ➞ | |
 | CCSI Consensus Cloud Solutions, Inc. |
| Sector: Technology | |
| SubSector: Software - Infrastructure | |
| MarketCap: 609 Millions | |
| Recent Price: 12.45 Smart Investing & Trading Score: 37 | |
| Day Percent Change: 4.80% Day Change: 0.57 | |
| Week Change: 1.47% Year-to-date Change: -53.3% | |
| CCSI Links: Profile News Message Board | |
| Charts:- Daily , Weekly | |
| Add CCSI to Watchlist: View: Get Complete CCSI Trend Analysis ➞ | |
 | NOTE FiscalNote Holdings, Inc. |
| Sector: Technology | |
| SubSector: Information Technology Services | |
| MarketCap: 493 Millions | |
| Recent Price: 1.39 Smart Investing & Trading Score: 32 | |
| Day Percent Change: 6.11% Day Change: 0.08 | |
| Week Change: 1.46% Year-to-date Change: 18.8% | |
| NOTE Links: Profile News Message Board | |
| Charts:- Daily , Weekly | |
| Add NOTE to Watchlist: View: Get Complete NOTE Trend Analysis ➞ | |
 | KAR KAR Auction Services, Inc. |
| Sector: Services & Goods | |
| SubSector: Specialty Retail, Other | |
| MarketCap: 1709.54 Millions | |
| Recent Price: 17.67 Smart Investing & Trading Score: 76 | |
| Day Percent Change: 0.51% Day Change: 0.09 | |
| Week Change: 1.44% Year-to-date Change: 19.3% | |
| KAR Links: Profile News Message Board | |
| Charts:- Daily , Weekly | |
| Add KAR to Watchlist: View: Get Complete KAR Trend Analysis ➞ | |
 | IBCP Independent Bank Corporation |
| Sector: Financials | |
| SubSector: Regional - Midwest Banks | |
| MarketCap: 273.67 Millions | |
| Recent Price: 25.35 Smart Investing & Trading Score: 66 | |
| Day Percent Change: 1.24% Day Change: 0.31 | |
| Week Change: 1.44% Year-to-date Change: -2.6% | |
| IBCP Links: Profile News Message Board | |
| Charts:- Daily , Weekly | |
| Add IBCP to Watchlist: View: Get Complete IBCP Trend Analysis ➞ | |
 | SUPN Supernus Pharmaceuticals, Inc. |
| Sector: Health Care | |
| SubSector: Drugs - Generic | |
| MarketCap: 833.585 Millions | |
| Recent Price: 30.50 Smart Investing & Trading Score: 61 | |
| Day Percent Change: 0.76% Day Change: 0.23 | |
| Week Change: 1.43% Year-to-date Change: 5.4% | |
| SUPN Links: Profile News Message Board | |
| Charts:- Daily , Weekly | |
| Add SUPN to Watchlist: View: Get Complete SUPN Trend Analysis ➞ | |
 | VSH Vishay Intertechnology, Inc. |
| Sector: Technology | |
| SubSector: Semiconductor - Broad Line | |
| MarketCap: 2132.52 Millions | |
| Recent Price: 22.95 Smart Investing & Trading Score: 68 | |
| Day Percent Change: 1.59% Day Change: 0.36 | |
| Week Change: 1.41% Year-to-date Change: -4.3% | |
| VSH Links: Profile News Message Board | |
| Charts:- Daily , Weekly | |
| Add VSH to Watchlist: View: Get Complete VSH Trend Analysis ➞ | |
 | PX P10, Inc. |
| Sector: Financials | |
| SubSector: Asset Management | |
| MarketCap: 1300 Millions | |
| Recent Price: 7.57 Smart Investing & Trading Score: 46 | |
| Day Percent Change: 2.79% Day Change: 0.21 | |
| Week Change: 1.41% Year-to-date Change: -26.0% | |
| PX Links: Profile News Message Board | |
| Charts:- Daily , Weekly | |
| Add PX to Watchlist: View: Get Complete PX Trend Analysis ➞ | |
 | MATX Matson, Inc. |
| Sector: Transports | |
| SubSector: Shipping | |
| MarketCap: 1509.94 Millions | |
| Recent Price: 110.48 Smart Investing & Trading Score: 27 | |
| Day Percent Change: 1.26% Day Change: 1.37 | |
| Week Change: 1.41% Year-to-date Change: 0.8% | |
| MATX Links: Profile News Message Board | |
| Charts:- Daily , Weekly | |
| Add MATX to Watchlist: View: Get Complete MATX Trend Analysis ➞ | |
 | FCF First Commonwealth Financial Corporation |
| Sector: Financials | |
| SubSector: Regional - Northeast Banks | |
| MarketCap: 900.299 Millions | |
| Recent Price: 13.74 Smart Investing & Trading Score: 95 | |
| Day Percent Change: 1.10% Day Change: 0.15 | |
| Week Change: 1.4% Year-to-date Change: -11.0% | |
| FCF Links: Profile News Message Board | |
| Charts:- Daily , Weekly | |
| Add FCF to Watchlist: View: Get Complete FCF Trend Analysis ➞ | |
 | DHT DHT Holdings, Inc. |
| Sector: Transports | |
| SubSector: Shipping | |
| MarketCap: 754.514 Millions | |
| Recent Price: 11.67 Smart Investing & Trading Score: 100 | |
| Day Percent Change: -0.85% Day Change: -0.10 | |
| Week Change: 1.39% Year-to-date Change: 19.0% | |
| DHT Links: Profile News Message Board | |
| Charts:- Daily , Weekly | |
| Add DHT to Watchlist: View: Get Complete DHT Trend Analysis ➞ | |
 | RDN Radian Group Inc. |
| Sector: Financials | |
| SubSector: Property & Casualty Insurance | |
| MarketCap: 2950.12 Millions | |
| Recent Price: 30.77 Smart Investing & Trading Score: 80 | |
| Day Percent Change: 0.10% Day Change: 0.03 | |
| Week Change: 1.38% Year-to-date Change: 7.8% | |
| RDN Links: Profile News Message Board | |
| Charts:- Daily , Weekly | |
| Add RDN to Watchlist: View: Get Complete RDN Trend Analysis ➞ | |
 | NNI Nelnet, Inc. |
| Sector: Financials | |
| SubSector: Credit Services | |
| MarketCap: 1664.38 Millions | |
| Recent Price: 96.11 Smart Investing & Trading Score: 95 | |
| Day Percent Change: 0.22% Day Change: 0.21 | |
| Week Change: 1.36% Year-to-date Change: 8.9% | |
| NNI Links: Profile News Message Board | |
| Charts:- Daily , Weekly | |
| Add NNI to Watchlist: View: Get Complete NNI Trend Analysis ➞ | |
| For tabular summary view of above stock list: Summary View ➞ 0 - 25 , 25 - 50 , 50 - 75 , 75 - 100 , 100 - 125 , 125 - 150 , 150 - 175 , 175 - 200 , 200 - 225 , 225 - 250 , 250 - 275 , 275 - 300 , 300 - 325 , 325 - 350 , 350 - 375 , 375 - 400 , 400 - 425 , 425 - 450 , 450 - 475 , 475 - 500 , 500 - 525 , 525 - 550 , 550 - 575 , 575 - 600 , 600 - 625 , 625 - 650 , 650 - 675 , 675 - 700 , 700 - 725 , 725 - 750 , 750 - 775 , 775 - 800 , 800 - 825 , 825 - 850 , 850 - 875 , 875 - 900 , 900 - 925 , 925 - 950 , 950 - 975 , 975 - 1000 , 1000 - 1025 , 1025 - 1050 , 1050 - 1075 , 1075 - 1100 , 1100 - 1125 , 1125 - 1150 , 1150 - 1175 , 1175 - 1200 , 1200 - 1225 , 1225 - 1250 , 1250 - 1275 , 1275 - 1300 , 1300 - 1325 , 1325 - 1350 , 1350 - 1375 , 1375 - 1400 , 1400 - 1425 , 1425 - 1450 , 1450 - 1475 , 1475 - 1500 , 1500 - 1525 , 1525 - 1550 , 1550 - 1575 , 1575 - 1600 | ||
| Click To Change The Sort Order: By Market Cap or Company Size Performance: Year-to-date, Week and Day | |
| Select Chart Type: | ||
| Too many stocks? View smallcap stocks filtered by marketcap & sector |
| Marketcap: All SmallCap Stocks (default-no microcap), Large, Mid-Range, Small & MicroCap |
| Sector: Tech, Finance, Energy, Staples, Retail, Industrial, Materials, Utilities & Medical |
|
Best Stocks Today 12Stocks.com |
© 2024 12Stocks.com Terms & Conditions Privacy Contact Us
All Information Provided Only For Education And Not To Be Used For Investing or Trading. See Terms & Conditions


One More Thing ... Get Best Stocks Delivered Daily!
Never Ever Miss A Move With Our Top Ten Stocks Lists
Find Best Stocks In Any Market - Bull or Bear Market
Take A Peek At Our Top Ten Stocks Lists: Daily, Weekly, Year-to-Date & Top Trends
Find Best Stocks In Any Market - Bull or Bear Market
Take A Peek At Our Top Ten Stocks Lists: Daily, Weekly, Year-to-Date & Top Trends
Smallcap Stocks With Best Up Trends [0-bearish to 100-bullish]: Origin Materials[100], Clearfield [100], Fluence Energy[100], Emergent BioSolutions[100], TPI Composites[100], ALLETE [100], E.W. Scripps[100], Conduent [100], Cutera [100], Bloom Energy[100], Super Group[100]
Best Smallcap Stocks Year-to-Date:
Janux [458.63%], Longboard [289.77%], Alpine Immune[239.36%], Avidity Biosciences[198.01%], Bakkt [194.84%], Vera [187.73%], Cullinan Oncology[177.78%], Super Micro[177.56%], Arcutis Bio[169.66%], Y-mAbs [154.69%], Sana [148.85%] Best Smallcap Stocks This Week:
Emergent BioSolutions[88.54%], Deciphera [73.28%], Origin Materials[59.41%], Eyenovia [59.18%], Enovix [54.87%], Codexis [46.8%], Cue Biopharma[41.39%], WideOpenWest [41.07%], TPI Composites[40.65%], Seres [39.39%], Carvana Co[39.19%] Best Smallcap Stocks Daily:
WideOpenWest [29.16%], Alignment Healthcare[24.23%], Ardelyx [23.42%], Twist Bioscience[23.18%], El Pollo[21.45%], IES [20.21%], Vaxxinity [17.64%], Enovix [17.26%], Origin Materials[17.01%], Codexis [16.92%], Adtalem Global[16.86%]