
 Login Sign Up


| |||||
 |  | ||||

| 12Stocks.com Market Intelligence |
Best SmallCap Stocks
|
| In a hurry? Small Cap Stock Lists: Performance Trends Table, Stock Charts
Sort Small Cap stocks: Daily, Weekly, Year-to-Date, Market Cap & Trends. Filter Small Cap stocks list by sector: Show all, Tech, Finance, Energy, Staples, Retail, Industrial, Materials, Utilities and HealthCare Filter Small Cap stocks list by size: All Large Medium Small and MicroCap |
| 12Stocks.com Small Cap Stocks Performances & Trends Daily | |||||||||
|
|  The overall Smart Investing & Trading Score is 41 (0-bearish to 100-bullish) which puts Small Cap index in short term neutral trend. The Smart Investing & Trading Score from previous trading session is 88 and hence a deterioration of trend.
| ||||||||
Here are the Smart Investing & Trading Scores of the most requested small cap stocks at 12Stocks.com (click stock name for detailed review):
|


| 12Stocks.com: Investing in Smallcap Index with Stocks | |
|
The following table helps investors and traders sort through current performance and trends (as measured by Smart Investing & Trading Score) of various
stocks in the Smallcap Index. Quick View: Move mouse or cursor over stock symbol (ticker) to view short-term technical chart and over stock name to view long term chart. Click on  to add stock symbol to your watchlist and to add stock symbol to your watchlist and  to view watchlist. Click on any ticker or stock name for detailed market intelligence report for that stock. to view watchlist. Click on any ticker or stock name for detailed market intelligence report for that stock. |
12Stocks.com Performance of Stocks in Smallcap Index
| Ticker | Stock Name | Watchlist | Category | Recent Price | Smart Investing & Trading Score | Change % | Weekly Change% |
| NXRT | NexPoint Residential |   | Financials | 34.24 | 100 | 2.79% | 2.92% |
| REVG | REV Group | | Consumer Staples | 21.86 | 61 | 1.44% | 2.92% |
| WOW | WideOpenWest | | Technology | 3.57 | 54 | -0.56% | 2.88% |
| THRD | Third Harmonic | | Health Care | 11.14 | 68 | -0.09% | 2.86% |
| PMVP | PMV | | Health Care | 1.80 | 61 | 1.69% | 2.86% |
| MLAB | Mesa | | Technology | 106.08 | 88 | 0.53% | 2.80% |
| VIR | Vir | | Health Care | 8.46 | 42 | 1.08% | 2.79% |
| TCBK | TriCo Bancshares | | Financials | 34.77 | 69 | -0.03% | 2.72% |
| VSEC | VSE | | Services & Goods | 78.07 | 76 | 1.32% | 2.71% |
| CCRN | Cross Country | | Services & Goods | 17.60 | 67 | 0.28% | 2.68% |
| PDM | Piedmont Office | | Financials | 6.89 | 93 | -0.72% | 2.68% |
| MQ | Marqeta | | Technology | 5.56 | 64 | -0.18% | 2.68% |
| MIRM | Mirum | | Health Care | 25.11 | 64 | 0.16% | 2.66% |
| CSV | Carriage Services | | Services & Goods | 25.58 | 100 | -1.99% | 2.65% |
| BRT | BRT Apartments | | Financials | 18.00 | 95 | -0.42% | 2.65% |
| CDNA | CareDx | | Services & Goods | 7.76 | 30 | -5.60% | 2.65% |
| VYGR | Voyager | | Health Care | 7.82 | 58 | 0.64% | 2.62% |
| OOMA | Ooma | | Technology | 7.06 | 49 | -1.26% | 2.62% |
| SWTX | SpringWorks | | Health Care | 46.69 | 95 | 0.52% | 2.55% |
| LQDA | Liquidia | | Health Care | 12.85 | 45 | 3.09% | 2.55% |
| KRG | Kite Realty | | Financials | 21.80 | 95 | 0.46% | 2.54% |
| DEI | Douglas Emmett | | Financials | 13.71 | 93 | -0.72% | 2.54% |
| GSHD | Goosehead Insurance | | Financials | 56.91 | 35 | 0.11% | 2.54% |
| EPRT | Essential Properties | | Financials | 26.34 | 100 | 0.11% | 2.53% |
| GTN | Gray Television | | Services & Goods | 5.75 | 50 | -2.04% | 2.50% |


| Too many stocks? View smallcap stocks filtered by marketcap & sector |
| Marketcap: All SmallCap Stocks (default-no microcap), Large, Mid-Range, Small |
| Smallcap Sector: Tech, Finance, Energy, Staples, Retail, Industrial, Materials, & Medical |
|
Get the most comprehensive stock market coverage daily at 12Stocks.com ➞ Best Stocks Today ➞ Best Stocks Weekly ➞ Best Stocks Year-to-Date ➞ Best Stocks Trends ➞  Best Stocks Today 12Stocks.com Best Nasdaq Stocks ➞ Best S&P 500 Stocks ➞ Best Tech Stocks ➞ Best Biotech Stocks ➞ |
| Detailed Overview of SmallCap Stocks |
| SmallCap Technical Overview, Leaders & Laggards, Top SmallCap ETF Funds & Detailed SmallCap Stocks List, Charts, Trends & More |
| Smallcap: Technical Analysis, Trends & YTD Performance | |
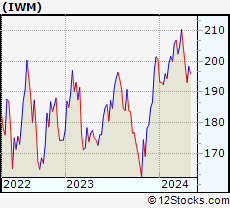
| SmallCap segment as represented by
IWM, an exchange-traded fund [ETF], holds basket of thousands of smallcap stocks from across all major sectors of the US stock market. The smallcap index (contains stocks like Riverbed & Sotheby's) is down by -2.4% and is currently underperforming the overall market by -7.2% year-to-date. Below is a quick view of technical charts and trends: | |
 IWM Weekly Chart |
|
| Long Term Trend: Good | |
| Medium Term Trend: Not Good | |
 IWM Daily Chart |
|
| Short Term Trend: Not Good | |
| Overall Trend Score: 41 | |
| YTD Performance: -2.4% | |
| **Trend Scores & Views Are Only For Educational Purposes And Not For Investing | |
| 12Stocks.com: Top Performing Small Cap Index Stocks | ||||||||||||||||||||||||||||||||||||||||||||||||
 The top performing Small Cap Index stocks year to date are
Now, more recently, over last week, the top performing Small Cap Index stocks on the move are


|
||||||||||||||||||||||||||||||||||||||||||||||||
| 12Stocks.com: Investing in Smallcap Index using Exchange Traded Funds | |
|
The following table shows list of key exchange traded funds (ETF) that
help investors track Smallcap index. The following list also includes leveraged ETF funds that track twice or thrice the daily returns of Smallcap indices. Short or inverse ETF funds move in the opposite direction to the index they track and are useful during market pullbacks or during bear markets. Quick View: Move mouse or cursor over ETF symbol (ticker) to view short-term technical chart and over ETF name to view long term chart. Click on ticker or stock name for detailed view. Click on to add stock symbol to your watchlist and to view watchlist. |
12Stocks.com List of ETFs that track Smallcap Index
| Ticker | ETF Name | Watchlist | Recent Price | Smart Investing & Trading Score | Change % | Week % | Year-to-date % |
| IWM | iShares Russell 2000 | | 195.90 | 41 | -2.03 | -1.26 | -2.4% |
| IJR | iShares Core S&P Small-Cap | | 104.39 | 40 | -1.90 | -1.19 | -3.57% |
| VTWO | Vanguard Russell 2000 ETF | | 79.16 | 41 | -2.01 | -1.32 | -2.39% |
| IWN | iShares Russell 2000 Value | | 149.04 | 25 | -1.98 | -1.39 | -4.05% |
| IWO | iShares Russell 2000 Growth | | 250.32 | 41 | -2.12 | -1.09 | -0.75% |
| IJS | iShares S&P Small-Cap 600 Value | | 96.08 | 22 | -1.91 | -1.14 | -6.78% |
| IJT | iShares S&P Small-Cap 600 Growth | | 124.60 | 53 | -1.86 | -1.18 | -0.43% |
| XSLV | PowerShares S&P SmallCap Low Volatil ETF | | 42.54 | 55 | -0.77 | -0.42 | -3.65% |
| SMLV | SPDR SSGA US Small Cap Low Volatil ETF | | 106.26 | 20 | -1.40 | -1.17 | -5.56% |
| SDD | ProShares UltraShort SmallCap600 | | 19.57 | 37 | 2.51 | 1.14 | 6.21% |
| SAA | ProShares Ultra SmallCap600 | | 22.60 | 33 | -2.88 | -1.91 | -9.42% |
| SBB | ProShares Short SmallCap600 | | 16.55 | 48 | 1.66 | 1.01 | 3.89% |
| 12Stocks.com: Charts, Trends, Fundamental Data and Performances of SmallCap Stocks | |
|
We now take in-depth look at all SmallCap stocks including charts, multi-period performances and overall trends (as measured by Smart Investing & Trading Score). One can sort SmallCap stocks (click link to choose) by Daily, Weekly and by Year-to-Date performances. Also, one can sort by size of the company or by market capitalization. |
| Select Your Default Chart Type: | |||||
| |||||
| Click on stock symbol or name for detailed view. Click on to add stock symbol to your watchlist and to view watchlist. Quick View: Move mouse or cursor over "Daily" to quickly view daily technical stock chart and over "Weekly" to view weekly technical stock chart. | |||||

 | NXRT NexPoint Residential Trust, Inc. |
| Sector: Financials | |
| SubSector: REIT - Residential | |
| MarketCap: 839.161 Millions | |
| Recent Price: 34.24 Smart Investing & Trading Score: 100 | |
| Day Percent Change: 2.79% Day Change: 0.93 | |
| Week Change: 2.92% Year-to-date Change: -0.6% | |
| NXRT Links: Profile News Message Board | |
| Charts:- Daily , Weekly | |
| Add NXRT to Watchlist: View: Get Complete NXRT Trend Analysis ➞ | |
 | REVG REV Group, Inc. |
| Sector: Consumer Staples | |
| SubSector: Trucks & Other Vehicles | |
| MarketCap: 398.597 Millions | |
| Recent Price: 21.86 Smart Investing & Trading Score: 61 | |
| Day Percent Change: 1.44% Day Change: 0.31 | |
| Week Change: 2.92% Year-to-date Change: 20.3% | |
| REVG Links: Profile News Message Board | |
| Charts:- Daily , Weekly | |
| Add REVG to Watchlist: View: Get Complete REVG Trend Analysis ➞ | |
 | WOW WideOpenWest, Inc. |
| Sector: Technology | |
| SubSector: CATV Systems | |
| MarketCap: 328.932 Millions | |
| Recent Price: 3.57 Smart Investing & Trading Score: 54 | |
| Day Percent Change: -0.56% Day Change: -0.02 | |
| Week Change: 2.88% Year-to-date Change: -11.9% | |
| WOW Links: Profile News Message Board | |
| Charts:- Daily , Weekly | |
| Add WOW to Watchlist: View: Get Complete WOW Trend Analysis ➞ | |
 | THRD Third Harmonic Bio, Inc. |
| Sector: Health Care | |
| SubSector: Biotechnology | |
| MarketCap: 190 Millions | |
| Recent Price: 11.14 Smart Investing & Trading Score: 68 | |
| Day Percent Change: -0.09% Day Change: -0.01 | |
| Week Change: 2.86% Year-to-date Change: 1.1% | |
| THRD Links: Profile News Message Board | |
| Charts:- Daily , Weekly | |
| Add THRD to Watchlist: View: Get Complete THRD Trend Analysis ➞ | |
 | PMVP PMV Pharmaceuticals, Inc. |
| Sector: Health Care | |
| SubSector: Biotechnology | |
| MarketCap: 20187 Millions | |
| Recent Price: 1.80 Smart Investing & Trading Score: 61 | |
| Day Percent Change: 1.69% Day Change: 0.03 | |
| Week Change: 2.86% Year-to-date Change: -41.9% | |
| PMVP Links: Profile News Message Board | |
| Charts:- Daily , Weekly | |
| Add PMVP to Watchlist: View: Get Complete PMVP Trend Analysis ➞ | |
 | MLAB Mesa Laboratories, Inc. |
| Sector: Technology | |
| SubSector: Scientific & Technical Instruments | |
| MarketCap: 935.453 Millions | |
| Recent Price: 106.08 Smart Investing & Trading Score: 88 | |
| Day Percent Change: 0.53% Day Change: 0.56 | |
| Week Change: 2.8% Year-to-date Change: 1.3% | |
| MLAB Links: Profile News Message Board | |
| Charts:- Daily , Weekly | |
| Add MLAB to Watchlist: View: Get Complete MLAB Trend Analysis ➞ | |
 | VIR Vir Biotechnology, Inc. |
| Sector: Health Care | |
| SubSector: Biotechnology | |
| MarketCap: 3916.75 Millions | |
| Recent Price: 8.46 Smart Investing & Trading Score: 42 | |
| Day Percent Change: 1.08% Day Change: 0.09 | |
| Week Change: 2.79% Year-to-date Change: -15.9% | |
| VIR Links: Profile News Message Board | |
| Charts:- Daily , Weekly | |
| Add VIR to Watchlist: View: Get Complete VIR Trend Analysis ➞ | |
 | TCBK TriCo Bancshares |
| Sector: Financials | |
| SubSector: Regional - Pacific Banks | |
| MarketCap: 875.129 Millions | |
| Recent Price: 34.77 Smart Investing & Trading Score: 69 | |
| Day Percent Change: -0.03% Day Change: -0.01 | |
| Week Change: 2.72% Year-to-date Change: -19.1% | |
| TCBK Links: Profile News Message Board | |
| Charts:- Daily , Weekly | |
| Add TCBK to Watchlist: View: Get Complete TCBK Trend Analysis ➞ | |
 | VSEC VSE Corporation |
| Sector: Services & Goods | |
| SubSector: Technical Services | |
| MarketCap: 183.61 Millions | |
| Recent Price: 78.07 Smart Investing & Trading Score: 76 | |
| Day Percent Change: 1.32% Day Change: 1.02 | |
| Week Change: 2.71% Year-to-date Change: 20.8% | |
| VSEC Links: Profile News Message Board | |
| Charts:- Daily , Weekly | |
| Add VSEC to Watchlist: View: Get Complete VSEC Trend Analysis ➞ | |
 | CCRN Cross Country Healthcare, Inc. |
| Sector: Services & Goods | |
| SubSector: Staffing & Outsourcing Services | |
| MarketCap: 348.328 Millions | |
| Recent Price: 17.60 Smart Investing & Trading Score: 67 | |
| Day Percent Change: 0.28% Day Change: 0.05 | |
| Week Change: 2.68% Year-to-date Change: -22.3% | |
| CCRN Links: Profile News Message Board | |
| Charts:- Daily , Weekly | |
| Add CCRN to Watchlist: View: Get Complete CCRN Trend Analysis ➞ | |
 | PDM Piedmont Office Realty Trust, Inc. |
| Sector: Financials | |
| SubSector: REIT - Office | |
| MarketCap: 2097.46 Millions | |
| Recent Price: 6.89 Smart Investing & Trading Score: 93 | |
| Day Percent Change: -0.72% Day Change: -0.05 | |
| Week Change: 2.68% Year-to-date Change: -3.1% | |
| PDM Links: Profile News Message Board | |
| Charts:- Daily , Weekly | |
| Add PDM to Watchlist: View: Get Complete PDM Trend Analysis ➞ | |
 | MQ Marqeta, Inc. |
| Sector: Technology | |
| SubSector: Software - Infrastructure | |
| MarketCap: 2650 Millions | |
| Recent Price: 5.56 Smart Investing & Trading Score: 64 | |
| Day Percent Change: -0.18% Day Change: -0.01 | |
| Week Change: 2.68% Year-to-date Change: -21.0% | |
| MQ Links: Profile News Message Board | |
| Charts:- Daily , Weekly | |
| Add MQ to Watchlist: View: Get Complete MQ Trend Analysis ➞ | |
 | MIRM Mirum Pharmaceuticals, Inc. |
| Sector: Health Care | |
| SubSector: Biotechnology | |
| MarketCap: 309.585 Millions | |
| Recent Price: 25.11 Smart Investing & Trading Score: 64 | |
| Day Percent Change: 0.16% Day Change: 0.04 | |
| Week Change: 2.66% Year-to-date Change: -14.9% | |
| MIRM Links: Profile News Message Board | |
| Charts:- Daily , Weekly | |
| Add MIRM to Watchlist: View: Get Complete MIRM Trend Analysis ➞ | |
 | CSV Carriage Services, Inc. |
| Sector: Services & Goods | |
| SubSector: Personal Services | |
| MarketCap: 304.725 Millions | |
| Recent Price: 25.58 Smart Investing & Trading Score: 100 | |
| Day Percent Change: -1.99% Day Change: -0.52 | |
| Week Change: 2.65% Year-to-date Change: 2.3% | |
| CSV Links: Profile News Message Board | |
| Charts:- Daily , Weekly | |
| Add CSV to Watchlist: View: Get Complete CSV Trend Analysis ➞ | |
 | BRT BRT Apartments Corp. |
| Sector: Financials | |
| SubSector: Mortgage Investment | |
| MarketCap: 163.239 Millions | |
| Recent Price: 18.00 Smart Investing & Trading Score: 95 | |
| Day Percent Change: -0.42% Day Change: -0.07 | |
| Week Change: 2.65% Year-to-date Change: -3.2% | |
| BRT Links: Profile News Message Board | |
| Charts:- Daily , Weekly | |
| Add BRT to Watchlist: View: Get Complete BRT Trend Analysis ➞ | |
 | CDNA CareDx, Inc |
| Sector: Services & Goods | |
| SubSector: Research Services | |
| MarketCap: 828.194 Millions | |
| Recent Price: 7.76 Smart Investing & Trading Score: 30 | |
| Day Percent Change: -5.60% Day Change: -0.46 | |
| Week Change: 2.65% Year-to-date Change: -35.3% | |
| CDNA Links: Profile News Message Board | |
| Charts:- Daily , Weekly | |
| Add CDNA to Watchlist: View: Get Complete CDNA Trend Analysis ➞ | |
 | VYGR Voyager Therapeutics, Inc. |
| Sector: Health Care | |
| SubSector: Biotechnology | |
| MarketCap: 321.085 Millions | |
| Recent Price: 7.82 Smart Investing & Trading Score: 58 | |
| Day Percent Change: 0.64% Day Change: 0.05 | |
| Week Change: 2.62% Year-to-date Change: -7.4% | |
| VYGR Links: Profile News Message Board | |
| Charts:- Daily , Weekly | |
| Add VYGR to Watchlist: View: Get Complete VYGR Trend Analysis ➞ | |
 | OOMA Ooma, Inc. |
| Sector: Technology | |
| SubSector: Diversified Communication Services | |
| MarketCap: 222.064 Millions | |
| Recent Price: 7.06 Smart Investing & Trading Score: 49 | |
| Day Percent Change: -1.26% Day Change: -0.09 | |
| Week Change: 2.62% Year-to-date Change: -34.2% | |
| OOMA Links: Profile News Message Board | |
| Charts:- Daily , Weekly | |
| Add OOMA to Watchlist: View: Get Complete OOMA Trend Analysis ➞ | |
 | SWTX SpringWorks Therapeutics, Inc. |
| Sector: Health Care | |
| SubSector: Biotechnology | |
| MarketCap: 1311.85 Millions | |
| Recent Price: 46.69 Smart Investing & Trading Score: 95 | |
| Day Percent Change: 0.52% Day Change: 0.24 | |
| Week Change: 2.55% Year-to-date Change: 27.9% | |
| SWTX Links: Profile News Message Board | |
| Charts:- Daily , Weekly | |
| Add SWTX to Watchlist: View: Get Complete SWTX Trend Analysis ➞ | |
 | LQDA Liquidia Technologies, Inc. |
| Sector: Health Care | |
| SubSector: Biotechnology | |
| MarketCap: 80.4785 Millions | |
| Recent Price: 12.85 Smart Investing & Trading Score: 45 | |
| Day Percent Change: 3.09% Day Change: 0.38 | |
| Week Change: 2.55% Year-to-date Change: 6.8% | |
| LQDA Links: Profile News Message Board | |
| Charts:- Daily , Weekly | |
| Add LQDA to Watchlist: View: Get Complete LQDA Trend Analysis ➞ | |
 | KRG Kite Realty Group Trust |
| Sector: Financials | |
| SubSector: REIT - Retail | |
| MarketCap: 1030.14 Millions | |
| Recent Price: 21.80 Smart Investing & Trading Score: 95 | |
| Day Percent Change: 0.46% Day Change: 0.10 | |
| Week Change: 2.54% Year-to-date Change: -4.6% | |
| KRG Links: Profile News Message Board | |
| Charts:- Daily , Weekly | |
| Add KRG to Watchlist: View: Get Complete KRG Trend Analysis ➞ | |
 | DEI Douglas Emmett, Inc. |
| Sector: Financials | |
| SubSector: REIT - Diversified | |
| MarketCap: 4917.83 Millions | |
| Recent Price: 13.71 Smart Investing & Trading Score: 93 | |
| Day Percent Change: -0.72% Day Change: -0.10 | |
| Week Change: 2.54% Year-to-date Change: -5.5% | |
| DEI Links: Profile News Message Board | |
| Charts:- Daily , Weekly | |
| Add DEI to Watchlist: View: Get Complete DEI Trend Analysis ➞ | |
 | GSHD Goosehead Insurance, Inc |
| Sector: Financials | |
| SubSector: Insurance Brokers | |
| MarketCap: 1863.57 Millions | |
| Recent Price: 56.91 Smart Investing & Trading Score: 35 | |
| Day Percent Change: 0.11% Day Change: 0.06 | |
| Week Change: 2.54% Year-to-date Change: -24.9% | |
| GSHD Links: Profile News Message Board | |
| Charts:- Daily , Weekly | |
| Add GSHD to Watchlist: View: Get Complete GSHD Trend Analysis ➞ | |
 | EPRT Essential Properties Realty Trust, Inc. |
| Sector: Financials | |
| SubSector: REIT - Diversified | |
| MarketCap: 1424.43 Millions | |
| Recent Price: 26.34 Smart Investing & Trading Score: 100 | |
| Day Percent Change: 0.11% Day Change: 0.03 | |
| Week Change: 2.53% Year-to-date Change: 3.1% | |
| EPRT Links: Profile News Message Board | |
| Charts:- Daily , Weekly | |
| Add EPRT to Watchlist: View: Get Complete EPRT Trend Analysis ➞ | |
 | GTN Gray Television, Inc. |
| Sector: Services & Goods | |
| SubSector: Broadcasting - TV | |
| MarketCap: 1144.63 Millions | |
| Recent Price: 5.75 Smart Investing & Trading Score: 50 | |
| Day Percent Change: -2.04% Day Change: -0.12 | |
| Week Change: 2.5% Year-to-date Change: -35.8% | |
| GTN Links: Profile News Message Board | |
| Charts:- Daily , Weekly | |
| Add GTN to Watchlist: View: Get Complete GTN Trend Analysis ➞ | |
| Too many stocks? View smallcap stocks filtered by marketcap & sector |
| Marketcap: All SmallCap Stocks (default-no microcap), Large, Mid-Range, Small & MicroCap |
| Sector: Tech, Finance, Energy, Staples, Retail, Industrial, Materials, Utilities & Medical |
|
Best Stocks Today 12Stocks.com |
© 2024 12Stocks.com Terms & Conditions Privacy Contact Us
All Information Provided Only For Education And Not To Be Used For Investing or Trading. See Terms & Conditions


One More Thing ... Get Best Stocks Delivered Daily!
Never Ever Miss A Move With Our Top Ten Stocks Lists
Find Best Stocks In Any Market - Bull or Bear Market
Take A Peek At Our Top Ten Stocks Lists: Daily, Weekly, Year-to-Date & Top Trends
Find Best Stocks In Any Market - Bull or Bear Market
Take A Peek At Our Top Ten Stocks Lists: Daily, Weekly, Year-to-Date & Top Trends
Smallcap Stocks With Best Up Trends [0-bearish to 100-bullish]: GrowGeneration [100], LendingTree [100], SES AI[100], Allegheny [100], AnaptysBio [100], LSB Industries[100], Clearwater Paper[100], Brinker [100], TPI Composites[100], Innovative Industrial[100], Day One[100]
Best Smallcap Stocks Year-to-Date:
Janux [431.32%], Viking [327.62%], Longboard [248.61%], Alpine Immune[239.23%], Super Micro[202.12%], Bakkt [200.9%], Avidity Biosciences[166.92%], Cullinan Oncology[164.93%], Arcutis Bio[157.59%], Vera [155.36%], Hippo [134.8%] Best Smallcap Stocks This Week:
Deciphera [72.49%], Cue Biopharma[39.19%], GrowGeneration [34.68%], Phibro Animal[31.19%], LendingTree [27.36%], Janux [20.3%], Seres [20.07%], Eyenovia [19.55%], P3 Health[18.22%], Heartland Financial[17.89%], Harmonic [16.74%] Best Smallcap Stocks Daily:
Cue Biopharma[33.80%], GrowGeneration [30.00%], LendingTree [29.24%], SES AI[17.04%], Allegheny [15.03%], AnaptysBio [14.27%], Harmonic [14.26%], LSB Industries[13.14%], P3 Health[12.09%], Clearwater Paper[10.69%], Seres [8.98%]