
 Login Sign Up


| |||||
 |  | ||||

| 12Stocks.com Market Intelligence |
Best SmallCap Stocks
|
| In a hurry? Small Cap Stock Lists: Performance Trends Table, Stock Charts
Sort Small Cap stocks: Daily, Weekly, Year-to-Date, Market Cap & Trends. Filter Small Cap stocks list by sector: Show all, Tech, Finance, Energy, Staples, Retail, Industrial, Materials, Utilities and HealthCare Filter Small Cap stocks list by size: All Large Medium Small and MicroCap |
| 12Stocks.com Small Cap Stocks Performances & Trends Daily | |||||||||
|
|  The overall Smart Investing & Trading Score is 69 (0-bearish to 100-bullish) which puts Small Cap index in short term neutral to bullish trend. The Smart Investing & Trading Score from previous trading session is 49 and hence an improvement of trend.
| ||||||||
Here are the Smart Investing & Trading Scores of the most requested small cap stocks at 12Stocks.com (click stock name for detailed review):
|


| 12Stocks.com: Investing in Smallcap Index with Stocks | |
|
The following table helps investors and traders sort through current performance and trends (as measured by Smart Investing & Trading Score) of various
stocks in the Smallcap Index. Quick View: Move mouse or cursor over stock symbol (ticker) to view short-term technical chart and over stock name to view long term chart. Click on  to add stock symbol to your watchlist and to add stock symbol to your watchlist and  to view watchlist. Click on any ticker or stock name for detailed market intelligence report for that stock. to view watchlist. Click on any ticker or stock name for detailed market intelligence report for that stock. |
12Stocks.com Performance of Stocks in Smallcap Index
| Ticker | Stock Name | Watchlist | Category | Recent Price | Smart Investing & Trading Score | Change % | Weekly Change% |
| SGMO | Sangamo |   | Health Care | 0.55 | 47 | 5.90% | 6.76% |
| TSE | Trinseo S.A | | Materials | 3.00 | 74 | 6.38% | 6.76% |
| HEAR | Turtle Beach | | Technology | 15.10 | 70 | 0.70% | 6.75% |
| AVAV | AeroVironment | | Industrials | 168.65 | 100 | 1.77% | 6.68% |
| FIZZ | National Beverage | | Consumer Staples | 46.46 | 67 | -0.94% | 6.66% |
| DTC | Solo Brands | | Services & Goods | 2.00 | 64 | 8.38% | 6.65% |
| DAN | Dana | | Consumer Staples | 13.31 | 100 | -0.08% | 6.65% |
| IRMD | IRadimed | | Health Care | 44.64 | 100 | 1.80% | 6.64% |
| RCKT | Rocket | | Health Care | 23.44 | 42 | 2.94% | 6.64% |
| KPTI | Karyopharm | | Health Care | 1.13 | 42 | 4.63% | 6.60% |
| IPI | Intrepid Potash | | Materials | 20.82 | 74 | 1.49% | 6.58% |
| EDIT | Editas Medicine | | Health Care | 5.67 | 42 | 0.89% | 6.58% |
| SVRA | Savara | | Health Care | 4.70 | 49 | 0.43% | 6.58% |
| BIPC | Brookfield Infrastructure | | Utilities | 33.36 | 87 | 2.52% | 6.58% |
| INNV | InnovAge Holding | | Health Care | 4.05 | 67 | 7.14% | 6.58% |
| KZR | Kezar Life | | Health Care | 0.86 | 39 | 0.36% | 6.57% |
| HUBG | Hub Group | | Transports | 42.54 | 87 | 0.61% | 6.54% |
| MORF | Morphic Holding | | Health Care | 29.90 | 74 | 4.14% | 6.52% |
| TDUP | ThredUp | | Services & Goods | 1.72 | 64 | 2.69% | 6.52% |
| BCRX | BioCryst | | Health Care | 4.43 | 59 | -1.12% | 6.49% |
| KIND | Nextdoor | | Services & Goods | 2.15 | 64 | -0.42% | 6.49% |
| AVIR | Atea | | Health Care | 3.95 | 54 | 3.13% | 6.47% |
| CNOB | ConnectOne Bancorp | | Financials | 19.48 | 67 | 2.31% | 6.45% |
| LOB | Live Oak | | Financials | 35.32 | 42 | 1.47% | 6.45% |
| IVR | Invesco Mortgage | | Financials | 9.11 | 87 | 1.00% | 6.43% |


| Too many stocks? View smallcap stocks filtered by marketcap & sector |
| Marketcap: All SmallCap Stocks (default-no microcap), Large, Mid-Range, Small |
| Smallcap Sector: Tech, Finance, Energy, Staples, Retail, Industrial, Materials, & Medical |
|
Get the most comprehensive stock market coverage daily at 12Stocks.com ➞ Best Stocks Today ➞ Best Stocks Weekly ➞ Best Stocks Year-to-Date ➞ Best Stocks Trends ➞  Best Stocks Today 12Stocks.com Best Nasdaq Stocks ➞ Best S&P 500 Stocks ➞ Best Tech Stocks ➞ Best Biotech Stocks ➞ |
| Detailed Overview of SmallCap Stocks |
| SmallCap Technical Overview, Leaders & Laggards, Top SmallCap ETF Funds & Detailed SmallCap Stocks List, Charts, Trends & More |
| Smallcap: Technical Analysis, Trends & YTD Performance | |
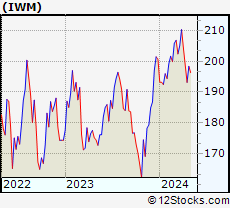
| SmallCap segment as represented by
IWM, an exchange-traded fund [ETF], holds basket of thousands of smallcap stocks from across all major sectors of the US stock market. The smallcap index (contains stocks like Riverbed & Sotheby's) is up by 0.59% and is currently underperforming the overall market by -6.29% year-to-date. Below is a quick view of technical charts and trends: | |
 IWM Weekly Chart |
|
| Long Term Trend: Not Good | |
| Medium Term Trend: Very Good | |
 IWM Daily Chart |
|
| Short Term Trend: Very Good | |
| Overall Trend Score: 69 | |
| YTD Performance: 0.59% | |
| **Trend Scores & Views Are Only For Educational Purposes And Not For Investing | |
| 12Stocks.com: Top Performing Small Cap Index Stocks | ||||||||||||||||||||||||||||||||||||||||||||||||
 The top performing Small Cap Index stocks year to date are
Now, more recently, over last week, the top performing Small Cap Index stocks on the move are


|
||||||||||||||||||||||||||||||||||||||||||||||||
| 12Stocks.com: Investing in Smallcap Index using Exchange Traded Funds | |
|
The following table shows list of key exchange traded funds (ETF) that
help investors track Smallcap index. The following list also includes leveraged ETF funds that track twice or thrice the daily returns of Smallcap indices. Short or inverse ETF funds move in the opposite direction to the index they track and are useful during market pullbacks or during bear markets. Quick View: Move mouse or cursor over ETF symbol (ticker) to view short-term technical chart and over ETF name to view long term chart. Click on ticker or stock name for detailed view. Click on to add stock symbol to your watchlist and to view watchlist. |
12Stocks.com List of ETFs that track Smallcap Index
| Ticker | ETF Name | Watchlist | Recent Price | Smart Investing & Trading Score | Change % | Week % | Year-to-date % |
| IWM | iShares Russell 2000 | | 201.90 | 69 | 0.99 | 1.77 | 0.59% |
| IJR | iShares Core S&P Small-Cap | | 107.13 | 82 | 0.75 | 1.4 | -1.03% |
| VTWO | Vanguard Russell 2000 ETF | | 81.61 | 37 | 0.94 | 1.73 | 0.63% |
| IWN | iShares Russell 2000 Value | | 154.21 | 57 | 0.87 | 2.03 | -0.72% |
| IJS | iShares S&P Small-Cap 600 Value | | 98.72 | 44 | 0.71 | 1.57 | -4.22% |
| IWO | iShares Russell 2000 Growth | | 256.87 | 27 | 0.99 | 1.49 | 1.84% |
| IJT | iShares S&P Small-Cap 600 Growth | | 127.79 | 57 | 0.84 | 1.35 | 2.12% |
| XSLV | PowerShares S&P SmallCap Low Volatil ETF | | 43.28 | 67 | 0.34 | 1.32 | -1.96% |
| SBB | ProShares Short SmallCap600 | | 16.22 | 41 | -0.92 | -1.01 | 1.82% |
| SDD | ProShares UltraShort SmallCap600 | | 18.84 | 10 | -2.43 | -2.64 | 2.24% |
| SAA | ProShares Ultra SmallCap600 | | 23.93 | 82 | 4.36 | 3.88 | -4.07% |
| SMLV | SPDR SSGA US Small Cap Low Volatil ETF | | 109.69 | 75 | 0.78 | 2.01 | -2.52% |
| 12Stocks.com: Charts, Trends, Fundamental Data and Performances of SmallCap Stocks | |
|
We now take in-depth look at all SmallCap stocks including charts, multi-period performances and overall trends (as measured by Smart Investing & Trading Score). One can sort SmallCap stocks (click link to choose) by Daily, Weekly and by Year-to-Date performances. Also, one can sort by size of the company or by market capitalization. |
| Select Your Default Chart Type: | |||||
| |||||
| Click on stock symbol or name for detailed view. Click on to add stock symbol to your watchlist and to view watchlist. Quick View: Move mouse or cursor over "Daily" to quickly view daily technical stock chart and over "Weekly" to view weekly technical stock chart. | |||||

 | SGMO Sangamo Therapeutics, Inc. |
| Sector: Health Care | |
| SubSector: Biotechnology | |
| MarketCap: 779.285 Millions | |
| Recent Price: 0.55 Smart Investing & Trading Score: 47 | |
| Day Percent Change: 5.90% Day Change: 0.03 | |
| Week Change: 6.76% Year-to-date Change: 1.8% | |
| SGMO Links: Profile News Message Board | |
| Charts:- Daily , Weekly | |
| Add SGMO to Watchlist: View: Get Complete SGMO Trend Analysis ➞ | |
 | TSE Trinseo S.A. |
| Sector: Materials | |
| SubSector: Specialty Chemicals | |
| MarketCap: 790.057 Millions | |
| Recent Price: 3.00 Smart Investing & Trading Score: 74 | |
| Day Percent Change: 6.38% Day Change: 0.18 | |
| Week Change: 6.76% Year-to-date Change: -64.2% | |
| TSE Links: Profile News Message Board | |
| Charts:- Daily , Weekly | |
| Add TSE to Watchlist: View: Get Complete TSE Trend Analysis ➞ | |
 | HEAR Turtle Beach Corporation |
| Sector: Technology | |
| SubSector: Communication Equipment | |
| MarketCap: 73.0539 Millions | |
| Recent Price: 15.10 Smart Investing & Trading Score: 70 | |
| Day Percent Change: 0.70% Day Change: 0.11 | |
| Week Change: 6.75% Year-to-date Change: 37.9% | |
| HEAR Links: Profile News Message Board | |
| Charts:- Daily , Weekly | |
| Add HEAR to Watchlist: View: Get Complete HEAR Trend Analysis ➞ | |
 | AVAV AeroVironment, Inc. |
| Sector: Industrials | |
| SubSector: Aerospace/Defense Products & Services | |
| MarketCap: 1502.41 Millions | |
| Recent Price: 168.65 Smart Investing & Trading Score: 100 | |
| Day Percent Change: 1.77% Day Change: 2.93 | |
| Week Change: 6.68% Year-to-date Change: 33.8% | |
| AVAV Links: Profile News Message Board | |
| Charts:- Daily , Weekly | |
| Add AVAV to Watchlist: View: Get Complete AVAV Trend Analysis ➞ | |
 | FIZZ National Beverage Corp. |
| Sector: Consumer Staples | |
| SubSector: Beverages - Soft Drinks | |
| MarketCap: 2031.4 Millions | |
| Recent Price: 46.46 Smart Investing & Trading Score: 67 | |
| Day Percent Change: -0.94% Day Change: -0.44 | |
| Week Change: 6.66% Year-to-date Change: -6.6% | |
| FIZZ Links: Profile News Message Board | |
| Charts:- Daily , Weekly | |
| Add FIZZ to Watchlist: View: Get Complete FIZZ Trend Analysis ➞ | |
 | DTC Solo Brands, Inc. |
| Sector: Services & Goods | |
| SubSector: Internet Retail | |
| MarketCap: 525 Millions | |
| Recent Price: 2.00 Smart Investing & Trading Score: 64 | |
| Day Percent Change: 8.38% Day Change: 0.15 | |
| Week Change: 6.65% Year-to-date Change: -67.7% | |
| DTC Links: Profile News Message Board | |
| Charts:- Daily , Weekly | |
| Add DTC to Watchlist: View: Get Complete DTC Trend Analysis ➞ | |
 | DAN Dana Incorporated |
| Sector: Consumer Staples | |
| SubSector: Auto Parts | |
| MarketCap: 1052.59 Millions | |
| Recent Price: 13.31 Smart Investing & Trading Score: 100 | |
| Day Percent Change: -0.08% Day Change: -0.01 | |
| Week Change: 6.65% Year-to-date Change: -8.9% | |
| DAN Links: Profile News Message Board | |
| Charts:- Daily , Weekly | |
| Add DAN to Watchlist: View: Get Complete DAN Trend Analysis ➞ | |
 | IRMD IRadimed Corporation |
| Sector: Health Care | |
| SubSector: Medical Appliances & Equipment | |
| MarketCap: 207.78 Millions | |
| Recent Price: 44.64 Smart Investing & Trading Score: 100 | |
| Day Percent Change: 1.80% Day Change: 0.79 | |
| Week Change: 6.64% Year-to-date Change: -6.0% | |
| IRMD Links: Profile News Message Board | |
| Charts:- Daily , Weekly | |
| Add IRMD to Watchlist: View: Get Complete IRMD Trend Analysis ➞ | |
 | RCKT Rocket Pharmaceuticals, Inc. |
| Sector: Health Care | |
| SubSector: Biotechnology | |
| MarketCap: 899.585 Millions | |
| Recent Price: 23.44 Smart Investing & Trading Score: 42 | |
| Day Percent Change: 2.94% Day Change: 0.67 | |
| Week Change: 6.64% Year-to-date Change: -21.8% | |
| RCKT Links: Profile News Message Board | |
| Charts:- Daily , Weekly | |
| Add RCKT to Watchlist: View: Get Complete RCKT Trend Analysis ➞ | |
 | KPTI Karyopharm Therapeutics Inc. |
| Sector: Health Care | |
| SubSector: Biotechnology | |
| MarketCap: 1471.85 Millions | |
| Recent Price: 1.13 Smart Investing & Trading Score: 42 | |
| Day Percent Change: 4.63% Day Change: 0.05 | |
| Week Change: 6.6% Year-to-date Change: 30.6% | |
| KPTI Links: Profile News Message Board | |
| Charts:- Daily , Weekly | |
| Add KPTI to Watchlist: View: Get Complete KPTI Trend Analysis ➞ | |
 | IPI Intrepid Potash, Inc. |
| Sector: Materials | |
| SubSector: Agricultural Chemicals | |
| MarketCap: 160.329 Millions | |
| Recent Price: 20.82 Smart Investing & Trading Score: 74 | |
| Day Percent Change: 1.49% Day Change: 0.30 | |
| Week Change: 6.58% Year-to-date Change: -12.9% | |
| IPI Links: Profile News Message Board | |
| Charts:- Daily , Weekly | |
| Add IPI to Watchlist: View: Get Complete IPI Trend Analysis ➞ | |
 | EDIT Editas Medicine, Inc. |
| Sector: Health Care | |
| SubSector: Biotechnology | |
| MarketCap: 1194.95 Millions | |
| Recent Price: 5.67 Smart Investing & Trading Score: 42 | |
| Day Percent Change: 0.89% Day Change: 0.05 | |
| Week Change: 6.58% Year-to-date Change: -44.0% | |
| EDIT Links: Profile News Message Board | |
| Charts:- Daily , Weekly | |
| Add EDIT to Watchlist: View: Get Complete EDIT Trend Analysis ➞ | |
 | SVRA Savara Inc. |
| Sector: Health Care | |
| SubSector: Biotechnology | |
| MarketCap: 80.3785 Millions | |
| Recent Price: 4.70 Smart Investing & Trading Score: 49 | |
| Day Percent Change: 0.43% Day Change: 0.02 | |
| Week Change: 6.58% Year-to-date Change: 0.0% | |
| SVRA Links: Profile News Message Board | |
| Charts:- Daily , Weekly | |
| Add SVRA to Watchlist: View: Get Complete SVRA Trend Analysis ➞ | |
 | BIPC Brookfield Infrastructure Corporation |
| Sector: Utilities | |
| SubSector: Utilities Regulated Gas | |
| MarketCap: 31197 Millions | |
| Recent Price: 33.36 Smart Investing & Trading Score: 87 | |
| Day Percent Change: 2.52% Day Change: 0.82 | |
| Week Change: 6.58% Year-to-date Change: -5.4% | |
| BIPC Links: Profile News Message Board | |
| Charts:- Daily , Weekly | |
| Add BIPC to Watchlist: View: Get Complete BIPC Trend Analysis ➞ | |
 | INNV InnovAge Holding Corp. |
| Sector: Health Care | |
| SubSector: Medical Care Facilities | |
| MarketCap: 1010 Millions | |
| Recent Price: 4.05 Smart Investing & Trading Score: 67 | |
| Day Percent Change: 7.14% Day Change: 0.27 | |
| Week Change: 6.58% Year-to-date Change: -29.0% | |
| INNV Links: Profile News Message Board | |
| Charts:- Daily , Weekly | |
| Add INNV to Watchlist: View: Get Complete INNV Trend Analysis ➞ | |
 | KZR Kezar Life Sciences, Inc. |
| Sector: Health Care | |
| SubSector: Biotechnology | |
| MarketCap: 174.885 Millions | |
| Recent Price: 0.86 Smart Investing & Trading Score: 39 | |
| Day Percent Change: 0.36% Day Change: 0.00 | |
| Week Change: 6.57% Year-to-date Change: -9.5% | |
| KZR Links: Profile News Message Board | |
| Charts:- Daily , Weekly | |
| Add KZR to Watchlist: View: Get Complete KZR Trend Analysis ➞ | |
 | HUBG Hub Group, Inc. |
| Sector: Transports | |
| SubSector: Air Delivery & Freight Services | |
| MarketCap: 1503.88 Millions | |
| Recent Price: 42.54 Smart Investing & Trading Score: 87 | |
| Day Percent Change: 0.61% Day Change: 0.26 | |
| Week Change: 6.54% Year-to-date Change: -53.7% | |
| HUBG Links: Profile News Message Board | |
| Charts:- Daily , Weekly | |
| Add HUBG to Watchlist: View: Get Complete HUBG Trend Analysis ➞ | |
 | MORF Morphic Holding, Inc. |
| Sector: Health Care | |
| SubSector: Biotechnology | |
| MarketCap: 484.885 Millions | |
| Recent Price: 29.90 Smart Investing & Trading Score: 74 | |
| Day Percent Change: 4.14% Day Change: 1.19 | |
| Week Change: 6.52% Year-to-date Change: 3.5% | |
| MORF Links: Profile News Message Board | |
| Charts:- Daily , Weekly | |
| Add MORF to Watchlist: View: Get Complete MORF Trend Analysis ➞ | |
 | TDUP ThredUp Inc. |
| Sector: Services & Goods | |
| SubSector: Internet Retail | |
| MarketCap: 258 Millions | |
| Recent Price: 1.72 Smart Investing & Trading Score: 64 | |
| Day Percent Change: 2.69% Day Change: 0.05 | |
| Week Change: 6.52% Year-to-date Change: -24.1% | |
| TDUP Links: Profile News Message Board | |
| Charts:- Daily , Weekly | |
| Add TDUP to Watchlist: View: Get Complete TDUP Trend Analysis ➞ | |
 | BCRX BioCryst Pharmaceuticals, Inc. |
| Sector: Health Care | |
| SubSector: Biotechnology | |
| MarketCap: 369.385 Millions | |
| Recent Price: 4.43 Smart Investing & Trading Score: 59 | |
| Day Percent Change: -1.12% Day Change: -0.05 | |
| Week Change: 6.49% Year-to-date Change: -26.0% | |
| BCRX Links: Profile News Message Board | |
| Charts:- Daily , Weekly | |
| Add BCRX to Watchlist: View: Get Complete BCRX Trend Analysis ➞ | |
 | KIND Nextdoor Holdings, Inc. |
| Sector: Services & Goods | |
| SubSector: Internet Content & Information | |
| MarketCap: 1170 Millions | |
| Recent Price: 2.15 Smart Investing & Trading Score: 64 | |
| Day Percent Change: -0.42% Day Change: -0.01 | |
| Week Change: 6.49% Year-to-date Change: 16.3% | |
| KIND Links: Profile News Message Board | |
| Charts:- Daily , Weekly | |
| Add KIND to Watchlist: View: Get Complete KIND Trend Analysis ➞ | |
 | AVIR Atea Pharmaceuticals, Inc. |
| Sector: Health Care | |
| SubSector: Biotechnology | |
| MarketCap: 22587 Millions | |
| Recent Price: 3.95 Smart Investing & Trading Score: 54 | |
| Day Percent Change: 3.13% Day Change: 0.12 | |
| Week Change: 6.47% Year-to-date Change: 29.5% | |
| AVIR Links: Profile News Message Board | |
| Charts:- Daily , Weekly | |
| Add AVIR to Watchlist: View: Get Complete AVIR Trend Analysis ➞ | |
 | CNOB ConnectOne Bancorp, Inc. |
| Sector: Financials | |
| SubSector: Regional - Northeast Banks | |
| MarketCap: 491.899 Millions | |
| Recent Price: 19.48 Smart Investing & Trading Score: 67 | |
| Day Percent Change: 2.31% Day Change: 0.44 | |
| Week Change: 6.45% Year-to-date Change: -15.0% | |
| CNOB Links: Profile News Message Board | |
| Charts:- Daily , Weekly | |
| Add CNOB to Watchlist: View: Get Complete CNOB Trend Analysis ➞ | |
 | LOB Live Oak Bancshares, Inc. |
| Sector: Financials | |
| SubSector: Savings & Loans | |
| MarketCap: 394.23 Millions | |
| Recent Price: 35.32 Smart Investing & Trading Score: 42 | |
| Day Percent Change: 1.47% Day Change: 0.51 | |
| Week Change: 6.45% Year-to-date Change: -22.4% | |
| LOB Links: Profile News Message Board | |
| Charts:- Daily , Weekly | |
| Add LOB to Watchlist: View: Get Complete LOB Trend Analysis ➞ | |
 | IVR Invesco Mortgage Capital Inc. |
| Sector: Financials | |
| SubSector: Mortgage Investment | |
| MarketCap: 1182.19 Millions | |
| Recent Price: 9.11 Smart Investing & Trading Score: 87 | |
| Day Percent Change: 1.00% Day Change: 0.09 | |
| Week Change: 6.43% Year-to-date Change: 2.8% | |
| IVR Links: Profile News Message Board | |
| Charts:- Daily , Weekly | |
| Add IVR to Watchlist: View: Get Complete IVR Trend Analysis ➞ | |
| Too many stocks? View smallcap stocks filtered by marketcap & sector |
| Marketcap: All SmallCap Stocks (default-no microcap), Large, Mid-Range, Small & MicroCap |
| Sector: Tech, Finance, Energy, Staples, Retail, Industrial, Materials, Utilities & Medical |
|
Best Stocks Today 12Stocks.com |
© 2024 12Stocks.com Terms & Conditions Privacy Contact Us
All Information Provided Only For Education And Not To Be Used For Investing or Trading. See Terms & Conditions


One More Thing ... Get Best Stocks Delivered Daily!
Never Ever Miss A Move With Our Top Ten Stocks Lists
Find Best Stocks In Any Market - Bull or Bear Market
Take A Peek At Our Top Ten Stocks Lists: Daily, Weekly, Year-to-Date & Top Trends
Find Best Stocks In Any Market - Bull or Bear Market
Take A Peek At Our Top Ten Stocks Lists: Daily, Weekly, Year-to-Date & Top Trends
Smallcap Stocks With Best Up Trends [0-bearish to 100-bullish]: WideOpenWest [100], Joint [100], FTC Solar[100], Origin Materials[100], Alignment Healthcare[100], Clarus [100], Emergent BioSolutions[100], IES [100], Enovix [100], El Pollo[100], Adtalem Global[100]
Best Smallcap Stocks Year-to-Date:
Janux [482.74%], Viking [313.65%], Longboard [272.5%], Alpine Immune[239.23%], Bakkt [199.55%], Avidity Biosciences[192.48%], Vera [189.47%], Cullinan Oncology[176.9%], Super Micro[175.33%], Y-mAbs [151.47%], Sana [149.33%] Best Smallcap Stocks This Week:
Emergent BioSolutions[102.6%], Deciphera [73.14%], Origin Materials[66.52%], Eyenovia [57.77%], Cue Biopharma[56.04%], Aspen Aerogels[56.02%], Enovix [54.02%], Luna Innovations[53.27%], Codexis [47.37%], Carvana Co[44.31%], Office Properties[43.28%] Best Smallcap Stocks Daily:
Luna Innovations[35.56%], Twist Bioscience[28.77%], WideOpenWest [28.23%], Ardelyx [28.13%], 2U [26.26%], Joint [25.74%], FTC Solar[25.09%], Origin Materials[22.23%], Alignment Healthcare[21.97%], Clarus [18.34%], Aurora Innovation[18.09%]