
 Login Sign Up


| |||||
 |  | ||||

| 12Stocks.com Market Intelligence |
Best SmallCap Stocks
|
| In a hurry? Small Cap Stock Lists: Performance Trends Table, Stock Charts
Sort Small Cap stocks: Daily, Weekly, Year-to-Date, Market Cap & Trends. Filter Small Cap stocks list by sector: Show all, Tech, Finance, Energy, Staples, Retail, Industrial, Materials, Utilities and HealthCare Filter Small Cap stocks list by size: All Large Medium Small and MicroCap |
| 12Stocks.com Small Cap Stocks Performances & Trends Daily | |||||||||
|
|  The overall Smart Investing & Trading Score is 69 (0-bearish to 100-bullish) which puts Small Cap index in short term neutral to bullish trend. The Smart Investing & Trading Score from previous trading session is 49 and hence an improvement of trend.
| ||||||||
Here are the Smart Investing & Trading Scores of the most requested small cap stocks at 12Stocks.com (click stock name for detailed review):
|


| 12Stocks.com: Investing in Smallcap Index with Stocks | |
|
The following table helps investors and traders sort through current performance and trends (as measured by Smart Investing & Trading Score) of various
stocks in the Smallcap Index. Quick View: Move mouse or cursor over stock symbol (ticker) to view short-term technical chart and over stock name to view long term chart. Click on  to add stock symbol to your watchlist and to add stock symbol to your watchlist and  to view watchlist. Click on any ticker or stock name for detailed market intelligence report for that stock. to view watchlist. Click on any ticker or stock name for detailed market intelligence report for that stock. |
12Stocks.com Performance of Stocks in Smallcap Index
| Ticker | Stock Name | Watchlist | Category | Recent Price | Smart Investing & Trading Score | Change % | Weekly Change% |
| CRK | Comstock Resources |   | Energy | 9.99 | 70 | 1.32% | -3.20% |
| PRO | PROS | | Technology | 32.89 | 32 | -1.76% | -3.21% |
| FF | FutureFuel | | Materials | 5.38 | 17 | 0.75% | -3.24% |
| FLIC | First of Long Island | | Financials | 10.16 | 60 | 0.99% | -3.24% |
| VTS | Vitesse Energy | | Energy | 22.19 | 17 | -0.65% | -3.27% |
| HLX | Helix Energy | | Energy | 10.95 | 58 | 1.11% | -3.27% |
| ULCC | Frontier Group | | Industrials | 5.92 | 27 | 0.34% | -3.27% |
| DNUT | Krispy Kreme | | Consumer Staples | 12.57 | 18 | -0.32% | -3.27% |
| IE | Ivanhoe Electric | | Materials | 10.33 | 75 | 2.68% | -3.28% |
| ASUR | Asure | | Technology | 7.03 | 17 | -11.68% | -3.30% |
| STOK | Stoke | | Health Care | 12.00 | 75 | 2.65% | -3.30% |
| DDS | Dillard s | | Services & Goods | 434.00 | 55 | 0.63% | -3.33% |
| PEB | Pebblebrook Hotel | | Financials | 14.46 | 25 | 1.54% | -3.34% |
| WTTR | Select Energy | | Industrials | 9.16 | 31 | 1.22% | -3.38% |
| CVGI | Commercial Vehicle | | Services & Goods | 5.97 | 35 | 0.51% | -3.40% |
| RLJ | RLJ Lodging | | Financials | 10.73 | 0 | 0.28% | -3.42% |
| AIN | Albany | | Industrials | 84.67 | 32 | 1.21% | -3.43% |
| VRNS | Varonis Systems | | Technology | 43.77 | 42 | -0.95% | -3.44% |
| LZ | LegalZoom.com | | Industrials | 12.05 | 25 | -0.90% | -3.48% |
| EXTR | Extreme s | | Technology | 11.20 | 62 | -1.97% | -3.49% |
| TG | Tredegar | | Materials | 6.33 | 36 | -0.47% | -3.51% |
| KAI | Kadant | | Industrials | 272.46 | 17 | 2.10% | -3.51% |
| HRI | Herc | | Transports | 146.90 | 32 | -1.12% | -3.53% |
| MTDR | Matador Resources | | Energy | 63.28 | 25 | 1.88% | -3.55% |
| HCI | HCI Group | | Financials | 110.87 | 41 | -0.80% | -3.59% |


| Too many stocks? View smallcap stocks filtered by marketcap & sector |
| Marketcap: All SmallCap Stocks (default-no microcap), Large, Mid-Range, Small |
| Smallcap Sector: Tech, Finance, Energy, Staples, Retail, Industrial, Materials, & Medical |
|
Get the most comprehensive stock market coverage daily at 12Stocks.com ➞ Best Stocks Today ➞ Best Stocks Weekly ➞ Best Stocks Year-to-Date ➞ Best Stocks Trends ➞  Best Stocks Today 12Stocks.com Best Nasdaq Stocks ➞ Best S&P 500 Stocks ➞ Best Tech Stocks ➞ Best Biotech Stocks ➞ |
| Detailed Overview of SmallCap Stocks |
| SmallCap Technical Overview, Leaders & Laggards, Top SmallCap ETF Funds & Detailed SmallCap Stocks List, Charts, Trends & More |
| Smallcap: Technical Analysis, Trends & YTD Performance | |
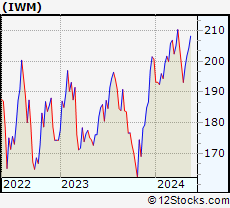
| SmallCap segment as represented by
IWM, an exchange-traded fund [ETF], holds basket of thousands of smallcap stocks from across all major sectors of the US stock market. The smallcap index (contains stocks like Riverbed & Sotheby's) is up by 0.59% and is currently underperforming the overall market by -6.29% year-to-date. Below is a quick view of technical charts and trends: | |
 IWM Weekly Chart |
|
| Long Term Trend: Not Good | |
| Medium Term Trend: Very Good | |
 IWM Daily Chart |
|
| Short Term Trend: Very Good | |
| Overall Trend Score: 69 | |
| YTD Performance: 0.59% | |
| **Trend Scores & Views Are Only For Educational Purposes And Not For Investing | |
| 12Stocks.com: Top Performing Small Cap Index Stocks | ||||||||||||||||||||||||||||||||||||||||||||||||
 The top performing Small Cap Index stocks year to date are
Now, more recently, over last week, the top performing Small Cap Index stocks on the move are


|
||||||||||||||||||||||||||||||||||||||||||||||||
| 12Stocks.com: Investing in Smallcap Index using Exchange Traded Funds | |
|
The following table shows list of key exchange traded funds (ETF) that
help investors track Smallcap index. The following list also includes leveraged ETF funds that track twice or thrice the daily returns of Smallcap indices. Short or inverse ETF funds move in the opposite direction to the index they track and are useful during market pullbacks or during bear markets. Quick View: Move mouse or cursor over ETF symbol (ticker) to view short-term technical chart and over ETF name to view long term chart. Click on ticker or stock name for detailed view. Click on to add stock symbol to your watchlist and to view watchlist. |
12Stocks.com List of ETFs that track Smallcap Index
| Ticker | ETF Name | Watchlist | Recent Price | Smart Investing & Trading Score | Change % | Week % | Year-to-date % |
| IWM | iShares Russell 2000 | | 201.90 | 69 | 0.99 | 1.77 | 0.59% |
| IJR | iShares Core S&P Small-Cap | | 107.13 | 82 | 0.75 | 1.4 | -1.03% |
| VTWO | Vanguard Russell 2000 ETF | | 81.61 | 37 | 0.94 | 1.73 | 0.63% |
| IWN | iShares Russell 2000 Value | | 154.21 | 57 | 0.87 | 2.03 | -0.72% |
| IJS | iShares S&P Small-Cap 600 Value | | 98.72 | 44 | 0.71 | 1.57 | -4.22% |
| IWO | iShares Russell 2000 Growth | | 256.87 | 27 | 0.99 | 1.49 | 1.84% |
| IJT | iShares S&P Small-Cap 600 Growth | | 127.79 | 57 | 0.84 | 1.35 | 2.12% |
| XSLV | PowerShares S&P SmallCap Low Volatil ETF | | 43.28 | 67 | 0.34 | 1.32 | -1.96% |
| SBB | ProShares Short SmallCap600 | | 16.22 | 41 | -0.92 | -1.01 | 1.82% |
| SDD | ProShares UltraShort SmallCap600 | | 18.84 | 10 | -2.43 | -2.64 | 2.24% |
| SAA | ProShares Ultra SmallCap600 | | 23.93 | 82 | 4.36 | 3.88 | -4.07% |
| SMLV | SPDR SSGA US Small Cap Low Volatil ETF | | 109.69 | 75 | 0.78 | 2.01 | -2.52% |
| 12Stocks.com: Charts, Trends, Fundamental Data and Performances of SmallCap Stocks | |
|
We now take in-depth look at all SmallCap stocks including charts, multi-period performances and overall trends (as measured by Smart Investing & Trading Score). One can sort SmallCap stocks (click link to choose) by Daily, Weekly and by Year-to-Date performances. Also, one can sort by size of the company or by market capitalization. |
| Select Your Default Chart Type: | |||||
| |||||
| Click on stock symbol or name for detailed view. Click on to add stock symbol to your watchlist and to view watchlist. Quick View: Move mouse or cursor over "Daily" to quickly view daily technical stock chart and over "Weekly" to view weekly technical stock chart. | |||||

 | CRK Comstock Resources, Inc. |
| Sector: Energy | |
| SubSector: Independent Oil & Gas | |
| MarketCap: 959.793 Millions | |
| Recent Price: 9.99 Smart Investing & Trading Score: 70 | |
| Day Percent Change: 1.32% Day Change: 0.13 | |
| Week Change: -3.2% Year-to-date Change: 12.9% | |
| CRK Links: Profile News Message Board | |
| Charts:- Daily , Weekly | |
| Add CRK to Watchlist: View: Get Complete CRK Trend Analysis ➞ | |
 | PRO PROS Holdings, Inc. |
| Sector: Technology | |
| SubSector: Application Software | |
| MarketCap: 1357.42 Millions | |
| Recent Price: 32.89 Smart Investing & Trading Score: 32 | |
| Day Percent Change: -1.76% Day Change: -0.59 | |
| Week Change: -3.21% Year-to-date Change: -15.2% | |
| PRO Links: Profile News Message Board | |
| Charts:- Daily , Weekly | |
| Add PRO to Watchlist: View: Get Complete PRO Trend Analysis ➞ | |
 | FF FutureFuel Corp. |
| Sector: Materials | |
| SubSector: Chemicals - Major Diversified | |
| MarketCap: 450.736 Millions | |
| Recent Price: 5.38 Smart Investing & Trading Score: 17 | |
| Day Percent Change: 0.75% Day Change: 0.04 | |
| Week Change: -3.24% Year-to-date Change: -11.5% | |
| FF Links: Profile News Message Board | |
| Charts:- Daily , Weekly | |
| Add FF to Watchlist: View: Get Complete FF Trend Analysis ➞ | |
 | FLIC The First of Long Island Corporation |
| Sector: Financials | |
| SubSector: Regional - Northeast Banks | |
| MarketCap: 352.899 Millions | |
| Recent Price: 10.16 Smart Investing & Trading Score: 60 | |
| Day Percent Change: 0.99% Day Change: 0.10 | |
| Week Change: -3.24% Year-to-date Change: -23.3% | |
| FLIC Links: Profile News Message Board | |
| Charts:- Daily , Weekly | |
| Add FLIC to Watchlist: View: Get Complete FLIC Trend Analysis ➞ | |
 | VTS Vitesse Energy, Inc. |
| Sector: Energy | |
| SubSector: Oil & Gas E&P | |
| MarketCap: 639 Millions | |
| Recent Price: 22.19 Smart Investing & Trading Score: 17 | |
| Day Percent Change: -0.65% Day Change: -0.14 | |
| Week Change: -3.27% Year-to-date Change: 0.2% | |
| VTS Links: Profile News Message Board | |
| Charts:- Daily , Weekly | |
| Add VTS to Watchlist: View: Get Complete VTS Trend Analysis ➞ | |
 | HLX Helix Energy Solutions Group, Inc. |
| Sector: Energy | |
| SubSector: Oil & Gas Equipment & Services | |
| MarketCap: 341.661 Millions | |
| Recent Price: 10.95 Smart Investing & Trading Score: 58 | |
| Day Percent Change: 1.11% Day Change: 0.12 | |
| Week Change: -3.27% Year-to-date Change: 6.5% | |
| HLX Links: Profile News Message Board | |
| Charts:- Daily , Weekly | |
| Add HLX to Watchlist: View: Get Complete HLX Trend Analysis ➞ | |
 | ULCC Frontier Group Holdings, Inc. |
| Sector: Industrials | |
| SubSector: Airlines | |
| MarketCap: 2160 Millions | |
| Recent Price: 5.92 Smart Investing & Trading Score: 27 | |
| Day Percent Change: 0.34% Day Change: 0.02 | |
| Week Change: -3.27% Year-to-date Change: 9.0% | |
| ULCC Links: Profile News Message Board | |
| Charts:- Daily , Weekly | |
| Add ULCC to Watchlist: View: Get Complete ULCC Trend Analysis ➞ | |
 | DNUT Krispy Kreme, Inc. |
| Sector: Consumer Staples | |
| SubSector: Grocery Stores | |
| MarketCap: 2480 Millions | |
| Recent Price: 12.57 Smart Investing & Trading Score: 18 | |
| Day Percent Change: -0.32% Day Change: -0.04 | |
| Week Change: -3.27% Year-to-date Change: -17.2% | |
| DNUT Links: Profile News Message Board | |
| Charts:- Daily , Weekly | |
| Add DNUT to Watchlist: View: Get Complete DNUT Trend Analysis ➞ | |
 | IE Ivanhoe Electric Inc. |
| Sector: Materials | |
| SubSector: Copper | |
| MarketCap: 1200 Millions | |
| Recent Price: 10.33 Smart Investing & Trading Score: 75 | |
| Day Percent Change: 2.68% Day Change: 0.27 | |
| Week Change: -3.28% Year-to-date Change: 1.9% | |
| IE Links: Profile News Message Board | |
| Charts:- Daily , Weekly | |
| Add IE to Watchlist: View: Get Complete IE Trend Analysis ➞ | |
 | ASUR Asure Software, Inc. |
| Sector: Technology | |
| SubSector: Business Software & Services | |
| MarketCap: 103.758 Millions | |
| Recent Price: 7.03 Smart Investing & Trading Score: 17 | |
| Day Percent Change: -11.68% Day Change: -0.93 | |
| Week Change: -3.3% Year-to-date Change: -26.2% | |
| ASUR Links: Profile News Message Board | |
| Charts:- Daily , Weekly | |
| Add ASUR to Watchlist: View: Get Complete ASUR Trend Analysis ➞ | |
 | STOK Stoke Therapeutics, Inc. |
| Sector: Health Care | |
| SubSector: Biotechnology | |
| MarketCap: 772.485 Millions | |
| Recent Price: 12.00 Smart Investing & Trading Score: 75 | |
| Day Percent Change: 2.65% Day Change: 0.31 | |
| Week Change: -3.3% Year-to-date Change: 128.1% | |
| STOK Links: Profile News Message Board | |
| Charts:- Daily , Weekly | |
| Add STOK to Watchlist: View: Get Complete STOK Trend Analysis ➞ | |
 | DDS Dillard s, Inc. |
| Sector: Services & Goods | |
| SubSector: Department Stores | |
| MarketCap: 1170.82 Millions | |
| Recent Price: 434.00 Smart Investing & Trading Score: 55 | |
| Day Percent Change: 0.63% Day Change: 2.70 | |
| Week Change: -3.33% Year-to-date Change: 7.5% | |
| DDS Links: Profile News Message Board | |
| Charts:- Daily , Weekly | |
| Add DDS to Watchlist: View: Get Complete DDS Trend Analysis ➞ | |
 | PEB Pebblebrook Hotel Trust |
| Sector: Financials | |
| SubSector: REIT - Hotel/Motel | |
| MarketCap: 1472.84 Millions | |
| Recent Price: 14.46 Smart Investing & Trading Score: 25 | |
| Day Percent Change: 1.54% Day Change: 0.22 | |
| Week Change: -3.34% Year-to-date Change: -9.5% | |
| PEB Links: Profile News Message Board | |
| Charts:- Daily , Weekly | |
| Add PEB to Watchlist: View: Get Complete PEB Trend Analysis ➞ | |
 | WTTR Select Energy Services, Inc. |
| Sector: Industrials | |
| SubSector: Pollution & Treatment Controls | |
| MarketCap: 347.075 Millions | |
| Recent Price: 9.16 Smart Investing & Trading Score: 31 | |
| Day Percent Change: 1.22% Day Change: 0.11 | |
| Week Change: -3.38% Year-to-date Change: 20.7% | |
| WTTR Links: Profile News Message Board | |
| Charts:- Daily , Weekly | |
| Add WTTR to Watchlist: View: Get Complete WTTR Trend Analysis ➞ | |
 | CVGI Commercial Vehicle Group, Inc. |
| Sector: Services & Goods | |
| SubSector: Auto Parts Wholesale | |
| MarketCap: 56.6 Millions | |
| Recent Price: 5.97 Smart Investing & Trading Score: 35 | |
| Day Percent Change: 0.51% Day Change: 0.03 | |
| Week Change: -3.4% Year-to-date Change: -14.8% | |
| CVGI Links: Profile News Message Board | |
| Charts:- Daily , Weekly | |
| Add CVGI to Watchlist: View: Get Complete CVGI Trend Analysis ➞ | |
 | RLJ RLJ Lodging Trust |
| Sector: Financials | |
| SubSector: REIT - Hotel/Motel | |
| MarketCap: 1019.34 Millions | |
| Recent Price: 10.73 Smart Investing & Trading Score: 0 | |
| Day Percent Change: 0.28% Day Change: 0.03 | |
| Week Change: -3.42% Year-to-date Change: -8.5% | |
| RLJ Links: Profile News Message Board | |
| Charts:- Daily , Weekly | |
| Add RLJ to Watchlist: View: Get Complete RLJ Trend Analysis ➞ | |
 | AIN Albany International Corp. |
| Sector: Industrials | |
| SubSector: Textile Industrial | |
| MarketCap: 1538.4 Millions | |
| Recent Price: 84.67 Smart Investing & Trading Score: 32 | |
| Day Percent Change: 1.21% Day Change: 1.01 | |
| Week Change: -3.43% Year-to-date Change: -13.8% | |
| AIN Links: Profile News Message Board | |
| Charts:- Daily , Weekly | |
| Add AIN to Watchlist: View: Get Complete AIN Trend Analysis ➞ | |
 | VRNS Varonis Systems, Inc. |
| Sector: Technology | |
| SubSector: Technical & System Software | |
| MarketCap: 1715 Millions | |
| Recent Price: 43.77 Smart Investing & Trading Score: 42 | |
| Day Percent Change: -0.95% Day Change: -0.42 | |
| Week Change: -3.44% Year-to-date Change: -3.3% | |
| VRNS Links: Profile News Message Board | |
| Charts:- Daily , Weekly | |
| Add VRNS to Watchlist: View: Get Complete VRNS Trend Analysis ➞ | |
 | LZ LegalZoom.com, Inc. |
| Sector: Industrials | |
| SubSector: Specialty Business Services | |
| MarketCap: 2330 Millions | |
| Recent Price: 12.05 Smart Investing & Trading Score: 25 | |
| Day Percent Change: -0.90% Day Change: -0.11 | |
| Week Change: -3.48% Year-to-date Change: 6.1% | |
| LZ Links: Profile News Message Board | |
| Charts:- Daily , Weekly | |
| Add LZ to Watchlist: View: Get Complete LZ Trend Analysis ➞ | |
 | EXTR Extreme Networks, Inc. |
| Sector: Technology | |
| SubSector: Communication Equipment | |
| MarketCap: 339.939 Millions | |
| Recent Price: 11.20 Smart Investing & Trading Score: 62 | |
| Day Percent Change: -1.97% Day Change: -0.22 | |
| Week Change: -3.49% Year-to-date Change: -36.5% | |
| EXTR Links: Profile News Message Board | |
| Charts:- Daily , Weekly | |
| Add EXTR to Watchlist: View: Get Complete EXTR Trend Analysis ➞ | |
 | TG Tredegar Corporation |
| Sector: Materials | |
| SubSector: Specialty Chemicals | |
| MarketCap: 545.057 Millions | |
| Recent Price: 6.33 Smart Investing & Trading Score: 36 | |
| Day Percent Change: -0.47% Day Change: -0.03 | |
| Week Change: -3.51% Year-to-date Change: 17.0% | |
| TG Links: Profile News Message Board | |
| Charts:- Daily , Weekly | |
| Add TG to Watchlist: View: Get Complete TG Trend Analysis ➞ | |
 | KAI Kadant Inc. |
| Sector: Industrials | |
| SubSector: Diversified Machinery | |
| MarketCap: 787.116 Millions | |
| Recent Price: 272.46 Smart Investing & Trading Score: 17 | |
| Day Percent Change: 2.10% Day Change: 5.60 | |
| Week Change: -3.51% Year-to-date Change: -2.8% | |
| KAI Links: Profile News Message Board | |
| Charts:- Daily , Weekly | |
| Add KAI to Watchlist: View: Get Complete KAI Trend Analysis ➞ | |
 | HRI Herc Holdings Inc. |
| Sector: Transports | |
| SubSector: Rental & Leasing Services | |
| MarketCap: 469.344 Millions | |
| Recent Price: 146.90 Smart Investing & Trading Score: 32 | |
| Day Percent Change: -1.12% Day Change: -1.66 | |
| Week Change: -3.53% Year-to-date Change: -1.3% | |
| HRI Links: Profile News Message Board | |
| Charts:- Daily , Weekly | |
| Add HRI to Watchlist: View: Get Complete HRI Trend Analysis ➞ | |
 | MTDR Matador Resources Company |
| Sector: Energy | |
| SubSector: Independent Oil & Gas | |
| MarketCap: 196.593 Millions | |
| Recent Price: 63.28 Smart Investing & Trading Score: 25 | |
| Day Percent Change: 1.88% Day Change: 1.17 | |
| Week Change: -3.55% Year-to-date Change: 11.3% | |
| MTDR Links: Profile News Message Board | |
| Charts:- Daily , Weekly | |
| Add MTDR to Watchlist: View: Get Complete MTDR Trend Analysis ➞ | |
 | HCI HCI Group, Inc. |
| Sector: Financials | |
| SubSector: Property & Casualty Insurance | |
| MarketCap: 297.412 Millions | |
| Recent Price: 110.87 Smart Investing & Trading Score: 41 | |
| Day Percent Change: -0.80% Day Change: -0.89 | |
| Week Change: -3.59% Year-to-date Change: 26.9% | |
| HCI Links: Profile News Message Board | |
| Charts:- Daily , Weekly | |
| Add HCI to Watchlist: View: Get Complete HCI Trend Analysis ➞ | |
| Too many stocks? View smallcap stocks filtered by marketcap & sector |
| Marketcap: All SmallCap Stocks (default-no microcap), Large, Mid-Range, Small & MicroCap |
| Sector: Tech, Finance, Energy, Staples, Retail, Industrial, Materials, Utilities & Medical |
|
Best Stocks Today 12Stocks.com |
© 2024 12Stocks.com Terms & Conditions Privacy Contact Us
All Information Provided Only For Education And Not To Be Used For Investing or Trading. See Terms & Conditions


One More Thing ... Get Best Stocks Delivered Daily!
Never Ever Miss A Move With Our Top Ten Stocks Lists
Find Best Stocks In Any Market - Bull or Bear Market
Take A Peek At Our Top Ten Stocks Lists: Daily, Weekly, Year-to-Date & Top Trends
Find Best Stocks In Any Market - Bull or Bear Market
Take A Peek At Our Top Ten Stocks Lists: Daily, Weekly, Year-to-Date & Top Trends
Smallcap Stocks With Best Up Trends [0-bearish to 100-bullish]: WideOpenWest [100], Joint [100], FTC Solar[100], Origin Materials[100], Alignment Healthcare[100], Clarus [100], Emergent BioSolutions[100], IES [100], Enovix [100], El Pollo[100], Adtalem Global[100]
Best Smallcap Stocks Year-to-Date:
Janux [482.74%], Viking [313.65%], Longboard [272.5%], Alpine Immune[239.23%], Bakkt [199.55%], Avidity Biosciences[192.48%], Vera [189.47%], Cullinan Oncology[176.9%], Super Micro[175.33%], Y-mAbs [151.47%], Sana [149.33%] Best Smallcap Stocks This Week:
Emergent BioSolutions[102.6%], Deciphera [73.14%], Origin Materials[66.52%], Eyenovia [57.77%], Cue Biopharma[56.04%], Aspen Aerogels[56.02%], Enovix [54.02%], Luna Innovations[53.27%], Codexis [47.37%], Carvana Co[44.31%], Office Properties[43.28%] Best Smallcap Stocks Daily:
Luna Innovations[35.56%], Twist Bioscience[28.77%], WideOpenWest [28.23%], Ardelyx [28.13%], 2U [26.26%], Joint [25.74%], FTC Solar[25.09%], Origin Materials[22.23%], Alignment Healthcare[21.97%], Clarus [18.34%], Aurora Innovation[18.09%]