
 Login Sign Up


| |||||
 |  | ||||

| 12Stocks.com Market Intelligence |
Best SmallCap Stocks
|
| In a hurry? Small Cap Stock Lists: Performance Trends Table, Stock Charts
Sort Small Cap stocks: Daily, Weekly, Year-to-Date, Market Cap & Trends. Filter Small Cap stocks list by sector: Show all, Tech, Finance, Energy, Staples, Retail, Industrial, Materials, Utilities and HealthCare Filter Small Cap stocks list by size: All Large Medium Small and MicroCap |
| 12Stocks.com Small Cap Stocks Performances & Trends Daily | |||||||||
|
|  The overall Smart Investing & Trading Score is 65 (0-bearish to 100-bullish) which puts Small Cap index in short term neutral to bullish trend. The Smart Investing & Trading Score from previous trading session is 93 and hence a deterioration of trend.
| ||||||||
Here are the Smart Investing & Trading Scores of the most requested small cap stocks at 12Stocks.com (click stock name for detailed review):
|


| 12Stocks.com: Investing in Smallcap Index with Stocks | |
|
The following table helps investors and traders sort through current performance and trends (as measured by Smart Investing & Trading Score) of various
stocks in the Smallcap Index. Quick View: Move mouse or cursor over stock symbol (ticker) to view short-term technical chart and over stock name to view long term chart. Click on  to add stock symbol to your watchlist and to add stock symbol to your watchlist and  to view watchlist. Click on any ticker or stock name for detailed market intelligence report for that stock. to view watchlist. Click on any ticker or stock name for detailed market intelligence report for that stock. |
12Stocks.com Performance of Stocks in Smallcap Index
| Ticker | Stock Name | Watchlist | Category | Recent Price | Smart Investing & Trading Score | Change % | YTD Change% |
| TPH | TRI Pointe |   | Industrials | 39.77 | 83 | -0.33% | 12.34% |
| KBH | KB Home | | Industrials | 70.14 | 78 | -0.20% | 12.30% |
| BANC | Banc of California | | Financials | 15.08 | 88 | 0.87% | 12.29% |
| MGEE | MGE Energy | | Utilities | 81.18 | 85 | -0.49% | 12.27% |
| KNSA | Kiniksa | | Health Care | 19.69 | 45 | -2.04% | 12.26% |
| HAE | Haemonetics | | Health Care | 95.86 | 83 | 3.52% | 12.10% |
| MTX | Minerals | | Materials | 79.90 | 76 | 0.20% | 12.05% |
| PSMT | PriceSmart | | Services & Goods | 84.89 | 76 | -0.60% | 12.02% |
| PRFT | Perficient | | Technology | 73.60 | 88 | 0.03% | 11.82% |
| RPHM | Reneo | | Health Care | 1.81 | 93 | -2.69% | 11.73% |
| TMHC | Taylor Morrison | | Industrials | 59.56 | 85 | 0.27% | 11.64% |
| GOOD | Gladstone Commercial | | Financials | 14.76 | 100 | -0.81% | 11.48% |
| HLIO | Helios | | Industrials | 50.53 | 100 | -3.29% | 11.42% |
| CIVI | Civitas Solutions | | Health Care | 76.18 | 22 | -2.53% | 11.41% |
| WHD | Cactus | | Energy | 50.55 | 68 | -0.86% | 11.34% |
| WVE | Wave Life | | Health Care | 5.62 | 58 | -2.43% | 11.29% |
| HL | Hecla Mining | | Materials | 5.35 | 100 | -2.19% | 11.23% |
| HBI | Hanesbrands | | Consumer Staples | 4.96 | 69 | 5.98% | 11.21% |
| MYRG | MYR Group | | Industrials | 160.70 | 32 | 2.59% | 11.11% |
| GTLS | Chart Industries | | Industrials | 151.30 | 58 | -2.38% | 10.98% |
| ZUO | Zuora | | Technology | 10.43 | 68 | -0.86% | 10.90% |
| GPOR | Gulfport Energy | | Energy | 147.71 | 26 | -3.44% | 10.89% |
| HWKN | Hawkins | | Materials | 78.09 | 88 | -0.85% | 10.89% |
| DJCO | Daily Journal | | Services & Goods | 377.90 | 95 | 0.00% | 10.88% |
| DORM | Dorman Products | | Consumer Staples | 92.44 | 59 | 0.26% | 10.83% |


| Too many stocks? View smallcap stocks filtered by marketcap & sector |
| Marketcap: All SmallCap Stocks (default-no microcap), Large, Mid-Range, Small |
| Smallcap Sector: Tech, Finance, Energy, Staples, Retail, Industrial, Materials, & Medical |
|
Get the most comprehensive stock market coverage daily at 12Stocks.com ➞ Best Stocks Today ➞ Best Stocks Weekly ➞ Best Stocks Year-to-Date ➞ Best Stocks Trends ➞  Best Stocks Today 12Stocks.com Best Nasdaq Stocks ➞ Best S&P 500 Stocks ➞ Best Tech Stocks ➞ Best Biotech Stocks ➞ |
| Detailed Overview of SmallCap Stocks |
| SmallCap Technical Overview, Leaders & Laggards, Top SmallCap ETF Funds & Detailed SmallCap Stocks List, Charts, Trends & More |
| Smallcap: Technical Analysis, Trends & YTD Performance | |
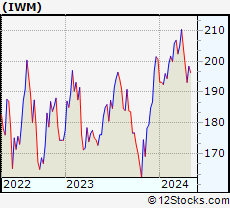
| SmallCap segment as represented by
IWM, an exchange-traded fund [ETF], holds basket of thousands of smallcap stocks from across all major sectors of the US stock market. The smallcap index (contains stocks like Riverbed & Sotheby's) is up by 1.79% and is currently underperforming the overall market by -6.99% year-to-date. Below is a quick view of technical charts and trends: | |
 IWM Weekly Chart |
|
| Long Term Trend: Very Good | |
| Medium Term Trend: Very Good | |
 IWM Daily Chart |
|
| Short Term Trend: Not Good | |
| Overall Trend Score: 65 | |
| YTD Performance: 1.79% | |
| **Trend Scores & Views Are Only For Educational Purposes And Not For Investing | |
| 12Stocks.com: Top Performing Small Cap Index Stocks | ||||||||||||||||||||||||||||||||||||||||||||||||
 The top performing Small Cap Index stocks year to date are
Now, more recently, over last week, the top performing Small Cap Index stocks on the move are


|
||||||||||||||||||||||||||||||||||||||||||||||||
| 12Stocks.com: Investing in Smallcap Index using Exchange Traded Funds | |
|
The following table shows list of key exchange traded funds (ETF) that
help investors track Smallcap index. The following list also includes leveraged ETF funds that track twice or thrice the daily returns of Smallcap indices. Short or inverse ETF funds move in the opposite direction to the index they track and are useful during market pullbacks or during bear markets. Quick View: Move mouse or cursor over ETF symbol (ticker) to view short-term technical chart and over ETF name to view long term chart. Click on ticker or stock name for detailed view. Click on to add stock symbol to your watchlist and to view watchlist. |
12Stocks.com List of ETFs that track Smallcap Index
| Ticker | ETF Name | Watchlist | Recent Price | Smart Investing & Trading Score | Change % | Week % | Year-to-date % |
| IWM | iShares Russell 2000 | | 204.31 | 65 | -0.75 | 1.19 | 1.79% |
| IJR | iShares Core S&P Small-Cap | | 108.98 | 88 | -0.53 | 1.73 | 0.67% |
| IWN | iShares Russell 2000 Value | | 156.19 | 88 | -0.61 | 1.28 | 0.55% |
| VTWO | Vanguard Russell 2000 ETF | | 82.63 | 58 | -0.68 | 1.24 | 1.88% |
| IWO | iShares Russell 2000 Growth | | 259.92 | 57 | -0.76 | 1.19 | 3.05% |
| IJS | iShares S&P Small-Cap 600 Value | | 100.52 | 60 | -0.46 | 1.82 | -2.47% |
| IJT | iShares S&P Small-Cap 600 Growth | | 129.86 | 76 | -0.51 | 1.64 | 3.77% |
| XSLV | PowerShares S&P SmallCap Low Volatil ETF | | 44.23 | 83 | -0.47 | 2.34 | 0.18% |
| SBB | ProShares Short SmallCap600 | | 15.96 | 18 | 0.47 | -1.27 | 0.16% |
| SMLV | SPDR SSGA US Small Cap Low Volatil ETF | | 111.22 | 95 | -0.48 | 1.4 | -1.16% |
| SDD | ProShares UltraShort SmallCap600 | | 18.28 | 28 | 0.19 | -3 | -0.8% |
| SAA | ProShares Ultra SmallCap600 | | 24.35 | 90 | -0.40 | 3.22 | -2.4% |
| 12Stocks.com: Charts, Trends, Fundamental Data and Performances of SmallCap Stocks | |
|
We now take in-depth look at all SmallCap stocks including charts, multi-period performances and overall trends (as measured by Smart Investing & Trading Score). One can sort SmallCap stocks (click link to choose) by Daily, Weekly and by Year-to-Date performances. Also, one can sort by size of the company or by market capitalization. |
| Select Your Default Chart Type: | |||||
| |||||
| Click on stock symbol or name for detailed view. Click on to add stock symbol to your watchlist and to view watchlist. Quick View: Move mouse or cursor over "Daily" to quickly view daily technical stock chart and over "Weekly" to view weekly technical stock chart. | |||||

 | TPH TRI Pointe Group, Inc. |
| Sector: Industrials | |
| SubSector: Residential Construction | |
| MarketCap: 1140.06 Millions | |
| Recent Price: 39.77 Smart Investing & Trading Score: 83 | |
| Day Percent Change: -0.33% Day Change: -0.13 | |
| Week Change: 2% Year-to-date Change: 12.3% | |
| TPH Links: Profile News Message Board | |
| Charts:- Daily , Weekly | |
| Add TPH to Watchlist: View: Get Complete TPH Trend Analysis ➞ | |
 | KBH KB Home |
| Sector: Industrials | |
| SubSector: Residential Construction | |
| MarketCap: 1249.66 Millions | |
| Recent Price: 70.14 Smart Investing & Trading Score: 78 | |
| Day Percent Change: -0.20% Day Change: -0.14 | |
| Week Change: 1.98% Year-to-date Change: 12.3% | |
| KBH Links: Profile News Message Board | |
| Charts:- Daily , Weekly | |
| Add KBH to Watchlist: View: Get Complete KBH Trend Analysis ➞ | |
 | BANC Banc of California, Inc. |
| Sector: Financials | |
| SubSector: Regional - Pacific Banks | |
| MarketCap: 459.929 Millions | |
| Recent Price: 15.08 Smart Investing & Trading Score: 88 | |
| Day Percent Change: 0.87% Day Change: 0.13 | |
| Week Change: 3.08% Year-to-date Change: 12.3% | |
| BANC Links: Profile News Message Board | |
| Charts:- Daily , Weekly | |
| Add BANC to Watchlist: View: Get Complete BANC Trend Analysis ➞ | |
 | MGEE MGE Energy, Inc. |
| Sector: Utilities | |
| SubSector: Diversified Utilities | |
| MarketCap: 2608.3 Millions | |
| Recent Price: 81.18 Smart Investing & Trading Score: 85 | |
| Day Percent Change: -0.49% Day Change: -0.40 | |
| Week Change: 1.59% Year-to-date Change: 12.3% | |
| MGEE Links: Profile News Message Board | |
| Charts:- Daily , Weekly | |
| Add MGEE to Watchlist: View: Get Complete MGEE Trend Analysis ➞ | |
 | KNSA Kiniksa Pharmaceuticals, Ltd. |
| Sector: Health Care | |
| SubSector: Biotechnology | |
| MarketCap: 780.285 Millions | |
| Recent Price: 19.69 Smart Investing & Trading Score: 45 | |
| Day Percent Change: -2.04% Day Change: -0.41 | |
| Week Change: -1.94% Year-to-date Change: 12.3% | |
| KNSA Links: Profile News Message Board | |
| Charts:- Daily , Weekly | |
| Add KNSA to Watchlist: View: Get Complete KNSA Trend Analysis ➞ | |
 | HAE Haemonetics Corporation |
| Sector: Health Care | |
| SubSector: Medical Instruments & Supplies | |
| MarketCap: 4500.7 Millions | |
| Recent Price: 95.86 Smart Investing & Trading Score: 83 | |
| Day Percent Change: 3.52% Day Change: 3.26 | |
| Week Change: 1.55% Year-to-date Change: 12.1% | |
| HAE Links: Profile News Message Board | |
| Charts:- Daily , Weekly | |
| Add HAE to Watchlist: View: Get Complete HAE Trend Analysis ➞ | |
 | MTX Minerals Technologies Inc. |
| Sector: Materials | |
| SubSector: Chemicals - Major Diversified | |
| MarketCap: 1155.36 Millions | |
| Recent Price: 79.90 Smart Investing & Trading Score: 76 | |
| Day Percent Change: 0.20% Day Change: 0.16 | |
| Week Change: 3.51% Year-to-date Change: 12.1% | |
| MTX Links: Profile News Message Board | |
| Charts:- Daily , Weekly | |
| Add MTX to Watchlist: View: Get Complete MTX Trend Analysis ➞ | |
 | PSMT PriceSmart, Inc. |
| Sector: Services & Goods | |
| SubSector: Discount, Variety Stores | |
| MarketCap: 1655.72 Millions | |
| Recent Price: 84.89 Smart Investing & Trading Score: 76 | |
| Day Percent Change: -0.60% Day Change: -0.51 | |
| Week Change: 2.95% Year-to-date Change: 12.0% | |
| PSMT Links: Profile News Message Board | |
| Charts:- Daily , Weekly | |
| Add PSMT to Watchlist: View: Get Complete PSMT Trend Analysis ➞ | |
 | PRFT Perficient, Inc. |
| Sector: Technology | |
| SubSector: Information Technology Services | |
| MarketCap: 1005.68 Millions | |
| Recent Price: 73.60 Smart Investing & Trading Score: 88 | |
| Day Percent Change: 0.03% Day Change: 0.02 | |
| Week Change: 52.98% Year-to-date Change: 11.8% | |
| PRFT Links: Profile News Message Board | |
| Charts:- Daily , Weekly | |
| Add PRFT to Watchlist: View: Get Complete PRFT Trend Analysis ➞ | |
 | RPHM Reneo Pharmaceuticals, Inc. |
| Sector: Health Care | |
| SubSector: Biotechnology | |
| MarketCap: 233 Millions | |
| Recent Price: 1.81 Smart Investing & Trading Score: 93 | |
| Day Percent Change: -2.69% Day Change: -0.05 | |
| Week Change: 4.62% Year-to-date Change: 11.7% | |
| RPHM Links: Profile News Message Board | |
| Charts:- Daily , Weekly | |
| Add RPHM to Watchlist: View: Get Complete RPHM Trend Analysis ➞ | |
 | TMHC Taylor Morrison Home Corporation |
| Sector: Industrials | |
| SubSector: Residential Construction | |
| MarketCap: 1336.76 Millions | |
| Recent Price: 59.56 Smart Investing & Trading Score: 85 | |
| Day Percent Change: 0.27% Day Change: 0.16 | |
| Week Change: 4.13% Year-to-date Change: 11.6% | |
| TMHC Links: Profile News Message Board | |
| Charts:- Daily , Weekly | |
| Add TMHC to Watchlist: View: Get Complete TMHC Trend Analysis ➞ | |
 | GOOD Gladstone Commercial Corporation |
| Sector: Financials | |
| SubSector: REIT - Diversified | |
| MarketCap: 425.253 Millions | |
| Recent Price: 14.76 Smart Investing & Trading Score: 100 | |
| Day Percent Change: -0.81% Day Change: -0.12 | |
| Week Change: 8.85% Year-to-date Change: 11.5% | |
| GOOD Links: Profile News Message Board | |
| Charts:- Daily , Weekly | |
| Add GOOD to Watchlist: View: Get Complete GOOD Trend Analysis ➞ | |
 | HLIO Helios Technologies, Inc. |
| Sector: Industrials | |
| SubSector: Diversified Machinery | |
| MarketCap: 1455.66 Millions | |
| Recent Price: 50.53 Smart Investing & Trading Score: 100 | |
| Day Percent Change: -3.29% Day Change: -1.72 | |
| Week Change: 5.16% Year-to-date Change: 11.4% | |
| HLIO Links: Profile News Message Board | |
| Charts:- Daily , Weekly | |
| Add HLIO to Watchlist: View: Get Complete HLIO Trend Analysis ➞ | |
 | CIVI Civitas Solutions, Inc. |
| Sector: Health Care | |
| SubSector: Long-Term Care Facilities | |
| MarketCap: 625.74 Millions | |
| Recent Price: 76.18 Smart Investing & Trading Score: 22 | |
| Day Percent Change: -2.53% Day Change: -1.98 | |
| Week Change: 0.9% Year-to-date Change: 11.4% | |
| CIVI Links: Profile News Message Board | |
| Charts:- Daily , Weekly | |
| Add CIVI to Watchlist: View: Get Complete CIVI Trend Analysis ➞ | |
 | WHD Cactus, Inc. |
| Sector: Energy | |
| SubSector: Oil & Gas Equipment & Services | |
| MarketCap: 920.261 Millions | |
| Recent Price: 50.55 Smart Investing & Trading Score: 68 | |
| Day Percent Change: -0.86% Day Change: -0.44 | |
| Week Change: -0.2% Year-to-date Change: 11.3% | |
| WHD Links: Profile News Message Board | |
| Charts:- Daily , Weekly | |
| Add WHD to Watchlist: View: Get Complete WHD Trend Analysis ➞ | |
 | WVE Wave Life Sciences Ltd. |
| Sector: Health Care | |
| SubSector: Biotechnology | |
| MarketCap: 452.785 Millions | |
| Recent Price: 5.62 Smart Investing & Trading Score: 58 | |
| Day Percent Change: -2.43% Day Change: -0.14 | |
| Week Change: -8.47% Year-to-date Change: 11.3% | |
| WVE Links: Profile News Message Board | |
| Charts:- Daily , Weekly | |
| Add WVE to Watchlist: View: Get Complete WVE Trend Analysis ➞ | |
 | HL Hecla Mining Company |
| Sector: Materials | |
| SubSector: Gold | |
| MarketCap: 1048.49 Millions | |
| Recent Price: 5.35 Smart Investing & Trading Score: 100 | |
| Day Percent Change: -2.19% Day Change: -0.12 | |
| Week Change: 12.87% Year-to-date Change: 11.2% | |
| HL Links: Profile News Message Board | |
| Charts:- Daily , Weekly | |
| Add HL to Watchlist: View: Get Complete HL Trend Analysis ➞ | |
 | HBI Hanesbrands Inc. |
| Sector: Consumer Staples | |
| SubSector: Textile - Apparel Clothing | |
| MarketCap: 3559.75 Millions | |
| Recent Price: 4.96 Smart Investing & Trading Score: 69 | |
| Day Percent Change: 5.98% Day Change: 0.28 | |
| Week Change: 11.71% Year-to-date Change: 11.2% | |
| HBI Links: Profile News Message Board | |
| Charts:- Daily , Weekly | |
| Add HBI to Watchlist: View: Get Complete HBI Trend Analysis ➞ | |
 | MYRG MYR Group Inc. |
| Sector: Industrials | |
| SubSector: General Contractors | |
| MarketCap: 405.363 Millions | |
| Recent Price: 160.70 Smart Investing & Trading Score: 32 | |
| Day Percent Change: 2.59% Day Change: 4.05 | |
| Week Change: 11.66% Year-to-date Change: 11.1% | |
| MYRG Links: Profile News Message Board | |
| Charts:- Daily , Weekly | |
| Add MYRG to Watchlist: View: Get Complete MYRG Trend Analysis ➞ | |
 | GTLS Chart Industries, Inc. |
| Sector: Industrials | |
| SubSector: Metal Fabrication | |
| MarketCap: 751.15 Millions | |
| Recent Price: 151.30 Smart Investing & Trading Score: 58 | |
| Day Percent Change: -2.38% Day Change: -3.69 | |
| Week Change: -2.39% Year-to-date Change: 11.0% | |
| GTLS Links: Profile News Message Board | |
| Charts:- Daily , Weekly | |
| Add GTLS to Watchlist: View: Get Complete GTLS Trend Analysis ➞ | |
 | ZUO Zuora, Inc. |
| Sector: Technology | |
| SubSector: Application Software | |
| MarketCap: 1063.22 Millions | |
| Recent Price: 10.43 Smart Investing & Trading Score: 68 | |
| Day Percent Change: -0.86% Day Change: -0.09 | |
| Week Change: 3.42% Year-to-date Change: 10.9% | |
| ZUO Links: Profile News Message Board | |
| Charts:- Daily , Weekly | |
| Add ZUO to Watchlist: View: Get Complete ZUO Trend Analysis ➞ | |
 | GPOR Gulfport Energy Corporation |
| Sector: Energy | |
| SubSector: Oil & Gas E&P | |
| MarketCap: 1890 Millions | |
| Recent Price: 147.71 Smart Investing & Trading Score: 26 | |
| Day Percent Change: -3.44% Day Change: -5.26 | |
| Week Change: -3.58% Year-to-date Change: 10.9% | |
| GPOR Links: Profile News Message Board | |
| Charts:- Daily , Weekly | |
| Add GPOR to Watchlist: View: Get Complete GPOR Trend Analysis ➞ | |
 | HWKN Hawkins, Inc. |
| Sector: Materials | |
| SubSector: Specialty Chemicals | |
| MarketCap: 398.957 Millions | |
| Recent Price: 78.09 Smart Investing & Trading Score: 88 | |
| Day Percent Change: -0.85% Day Change: -0.67 | |
| Week Change: 1.95% Year-to-date Change: 10.9% | |
| HWKN Links: Profile News Message Board | |
| Charts:- Daily , Weekly | |
| Add HWKN to Watchlist: View: Get Complete HWKN Trend Analysis ➞ | |
 | DJCO Daily Journal Corporation |
| Sector: Services & Goods | |
| SubSector: Publishing - Newspapers | |
| MarketCap: 306.822 Millions | |
| Recent Price: 377.90 Smart Investing & Trading Score: 95 | |
| Day Percent Change: 0.00% Day Change: 0.00 | |
| Week Change: 2.41% Year-to-date Change: 10.9% | |
| DJCO Links: Profile News Message Board | |
| Charts:- Daily , Weekly | |
| Add DJCO to Watchlist: View: Get Complete DJCO Trend Analysis ➞ | |
 | DORM Dorman Products, Inc. |
| Sector: Consumer Staples | |
| SubSector: Auto Parts | |
| MarketCap: 2028.79 Millions | |
| Recent Price: 92.44 Smart Investing & Trading Score: 59 | |
| Day Percent Change: 0.26% Day Change: 0.24 | |
| Week Change: 1.64% Year-to-date Change: 10.8% | |
| DORM Links: Profile News Message Board | |
| Charts:- Daily , Weekly | |
| Add DORM to Watchlist: View: Get Complete DORM Trend Analysis ➞ | |
| Too many stocks? View smallcap stocks filtered by marketcap & sector |
| Marketcap: All SmallCap Stocks (default-no microcap), Large, Mid-Range, Small & MicroCap |
| Sector: Tech, Finance, Energy, Staples, Retail, Industrial, Materials, Utilities & Medical |
|
Best Stocks Today 12Stocks.com |
© 2024 12Stocks.com Terms & Conditions Privacy Contact Us
All Information Provided Only For Education And Not To Be Used For Investing or Trading. See Terms & Conditions


One More Thing ... Get Best Stocks Delivered Daily!
Never Ever Miss A Move With Our Top Ten Stocks Lists
Find Best Stocks In Any Market - Bull or Bear Market
Take A Peek At Our Top Ten Stocks Lists: Daily, Weekly, Year-to-Date & Top Trends
Find Best Stocks In Any Market - Bull or Bear Market
Take A Peek At Our Top Ten Stocks Lists: Daily, Weekly, Year-to-Date & Top Trends
Smallcap Stocks With Best Up Trends [0-bearish to 100-bullish]: iTeos [100], CareDx [100], ADMA Biologics[100], Guardant Health[100], Nelnet [100], RE/MAX [100], BioLife Solutions[100], ProKidney [100], MRC Global[100], Redwire [100], Consensus Cloud[100]
Best Smallcap Stocks Year-to-Date:
CareMax [516.49%], Janux [355.28%], Bakkt [341.26%], Viking [295.78%], Alpine Immune[241.07%], Longboard [229.3%], Avidity Biosciences[187.17%], Super Micro[180.9%], Sweetgreen [176.46%], Vera [166.93%], Cullinan Oncology[160.62%] Best Smallcap Stocks This Week:
Novavax [80.12%], Innodata [61.16%], DASAN Zhone[59.62%], Consensus Cloud[53.8%], Perficient [52.98%], CareDx [52.57%], iTeos [49.76%], Bakkt [47.31%], Sweetgreen [41.36%], Children s[41.26%], Telephone and[40.25%] Best Smallcap Stocks Daily:
Novavax [98.66%], iTeos [43.07%], CareDx [34.09%], Organogenesis [32.89%], Sweetgreen [30.79%], ADMA Biologics[27.13%], TELA Bio[16.80%], SkyWater [14.89%], Integral Ad[13.72%], Sharecare [12.94%], Harrow Health[12.73%]