
 Login Sign Up


| |||||
 |  | ||||

| 12Stocks.com Market Intelligence |
Best SmallCap Stocks
|
| In a hurry? Small Cap Stock Lists: Performance Trends Table, Stock Charts
Sort Small Cap stocks: Daily, Weekly, Year-to-Date, Market Cap & Trends. Filter Small Cap stocks list by sector: Show all, Tech, Finance, Energy, Staples, Retail, Industrial, Materials, Utilities and HealthCare Filter Small Cap stocks list by size: All Large Medium Small and MicroCap |
| 12Stocks.com Small Cap Stocks Performances & Trends Daily | |||||||||
|
|  The overall Smart Investing & Trading Score is 44 (0-bearish to 100-bullish) which puts Small Cap index in short term neutral trend. The Smart Investing & Trading Score from previous trading session is 58 and hence a deterioration of trend.
| ||||||||
Here are the Smart Investing & Trading Scores of the most requested small cap stocks at 12Stocks.com (click stock name for detailed review):
|


| 12Stocks.com: Investing in Smallcap Index with Stocks | |
|
The following table helps investors and traders sort through current performance and trends (as measured by Smart Investing & Trading Score) of various
stocks in the Smallcap Index. Quick View: Move mouse or cursor over stock symbol (ticker) to view short-term technical chart and over stock name to view long term chart. Click on  to add stock symbol to your watchlist and to add stock symbol to your watchlist and  to view watchlist. Click on any ticker or stock name for detailed market intelligence report for that stock. to view watchlist. Click on any ticker or stock name for detailed market intelligence report for that stock. |
12Stocks.com Performance of Stocks in Smallcap Index
| Ticker | Stock Name | Watchlist | Category | Recent Price | Smart Investing & Trading Score | Change % | YTD Change% |
| WVE | Wave Life |   | Health Care | 4.76 | 51 | -4.99% | -5.74% |
| AAT | American Assets | | Financials | 21.22 | 67 | -0.35% | -5.75% |
| WDFC | WD-40 | | Materials | 225.27 | 10 | -0.63% | -5.77% |
| CLB | Core | | Energy | 16.64 | 50 | 0.64% | -5.80% |
| PDM | Piedmont Office | | Financials | 6.70 | 70 | -2.83% | -5.84% |
| ARR | ARMOUR Residential | | Financials | 18.19 | 42 | -2.88% | -5.85% |
| LKFN | Lakeland Financial | | Financials | 61.33 | 60 | -2.09% | -5.88% |
| PMT | PennyMac Mortgage | | Financials | 14.07 | 39 | 2.55% | -5.89% |
| EXLS | ExlService | | Technology | 29.03 | 35 | -1.83% | -5.90% |
| MYGN | Myriad Genetics | | Services & Goods | 18.00 | 0 | -3.38% | -5.96% |
| DC | Dakota Gold | | Materials | 2.44 | 43 | 3.38% | -5.96% |
| KRG | Kite Realty | | Financials | 21.49 | 93 | -1.06% | -5.99% |
| ALG | Alamo Group | | Industrials | 197.46 | 10 | -3.30% | -6.06% |
| PNRG | PrimeEnergy Resources | | Energy | 99.87 | 41 | -0.82% | -6.09% |
| HTLF | Heartland Financial | | Financials | 35.31 | 100 | -1.99% | -6.13% |
| PEB | Pebblebrook Hotel | | Financials | 15.00 | 93 | -3.85% | -6.13% |
| LPG | Dorian LPG | | Transports | 41.18 | 88 | -1.51% | -6.13% |
| CVGW | Calavo Growers | | Consumer Staples | 27.61 | 80 | 0.82% | -6.14% |
| LADR | Ladder Capital | | Financials | 10.80 | 42 | 2.86% | -6.17% |
| XPOF | Xponential Fitness | | Services & Goods | 12.23 | 46 | -3.70% | -6.17% |
| HWC | Hancock Whitney | | Financials | 45.57 | 80 | -1.94% | -6.22% |
| FFBC | First Financial | | Financials | 22.27 | 80 | -1.24% | -6.23% |
| LTH | Life Time | | Services & Goods | 14.21 | 51 | -2.71% | -6.24% |
| PDFS | PDF Solutions | | Technology | 30.12 | 25 | 0.13% | -6.29% |
| GEF | Greif | | Consumer Staples | 61.47 | 38 | -1.42% | -6.29% |


| Too many stocks? View smallcap stocks filtered by marketcap & sector |
| Marketcap: All SmallCap Stocks (default-no microcap), Large, Mid-Range, Small |
| Smallcap Sector: Tech, Finance, Energy, Staples, Retail, Industrial, Materials, & Medical |
|
Get the most comprehensive stock market coverage daily at 12Stocks.com ➞ Best Stocks Today ➞ Best Stocks Weekly ➞ Best Stocks Year-to-Date ➞ Best Stocks Trends ➞  Best Stocks Today 12Stocks.com Best Nasdaq Stocks ➞ Best S&P 500 Stocks ➞ Best Tech Stocks ➞ Best Biotech Stocks ➞ |
| Detailed Overview of SmallCap Stocks |
| SmallCap Technical Overview, Leaders & Laggards, Top SmallCap ETF Funds & Detailed SmallCap Stocks List, Charts, Trends & More |
| Smallcap: Technical Analysis, Trends & YTD Performance | |
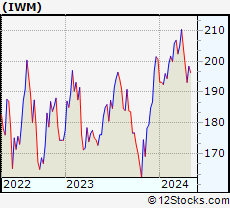
| SmallCap segment as represented by
IWM, an exchange-traded fund [ETF], holds basket of thousands of smallcap stocks from across all major sectors of the US stock market. The smallcap index (contains stocks like Riverbed & Sotheby's) is down by -2.41% and is currently underperforming the overall market by -7.26% year-to-date. Below is a quick view of technical charts and trends: | |
 IWM Weekly Chart |
|
| Long Term Trend: Good | |
| Medium Term Trend: Not Good | |
 IWM Daily Chart |
|
| Short Term Trend: Very Good | |
| Overall Trend Score: 44 | |
| YTD Performance: -2.41% | |
| **Trend Scores & Views Are Only For Educational Purposes And Not For Investing | |
| 12Stocks.com: Top Performing Small Cap Index Stocks | ||||||||||||||||||||||||||||||||||||||||||||||||
 The top performing Small Cap Index stocks year to date are
Now, more recently, over last week, the top performing Small Cap Index stocks on the move are


|
||||||||||||||||||||||||||||||||||||||||||||||||
| 12Stocks.com: Investing in Smallcap Index using Exchange Traded Funds | |
|
The following table shows list of key exchange traded funds (ETF) that
help investors track Smallcap index. The following list also includes leveraged ETF funds that track twice or thrice the daily returns of Smallcap indices. Short or inverse ETF funds move in the opposite direction to the index they track and are useful during market pullbacks or during bear markets. Quick View: Move mouse or cursor over ETF symbol (ticker) to view short-term technical chart and over ETF name to view long term chart. Click on ticker or stock name for detailed view. Click on to add stock symbol to your watchlist and to view watchlist. |
12Stocks.com List of ETFs that track Smallcap Index
| Ticker | ETF Name | Watchlist | Recent Price | Smart Investing & Trading Score | Change % | Week % | Year-to-date % |
| IWM | iShares Russell 2000 | | 195.88 | 44 | -0.91 | 1.42 | -2.41% |
| IJR | iShares Core S&P Small-Cap | | 104.62 | 78 | -1.03 | 1.36 | -3.35% |
| VTWO | Vanguard Russell 2000 ETF | | 79.21 | 63 | -0.90 | 1.45 | -2.33% |
| IWN | iShares Russell 2000 Value | | 149.73 | 68 | -1.02 | 1.32 | -3.61% |
| IWO | iShares Russell 2000 Growth | | 249.49 | 51 | -0.71 | 1.71 | -1.08% |
| IJS | iShares S&P Small-Cap 600 Value | | 96.25 | 60 | -1.49 | 0.67 | -6.62% |
| IJT | iShares S&P Small-Cap 600 Growth | | 124.73 | 63 | -0.51 | 2.06 | -0.33% |
| XSLV | PowerShares S&P SmallCap Low Volatil ETF | | 42.49 | 73 | -1.05 | 0.73 | -3.77% |
| SMLV | SPDR SSGA US Small Cap Low Volatil ETF | | 106.85 | 73 | -1.46 | 0.72 | -5.04% |
| SBB | ProShares Short SmallCap600 | | 16.65 | 40 | 1.71 | -1.13 | 4.52% |
| SDD | ProShares UltraShort SmallCap600 | | 19.60 | 42 | 0.56 | -3.64 | 6.37% |
| SAA | ProShares Ultra SmallCap600 | | 22.34 | 58 | -2.91 | 2.48 | -10.46% |
| 12Stocks.com: Charts, Trends, Fundamental Data and Performances of SmallCap Stocks | |
|
We now take in-depth look at all SmallCap stocks including charts, multi-period performances and overall trends (as measured by Smart Investing & Trading Score). One can sort SmallCap stocks (click link to choose) by Daily, Weekly and by Year-to-Date performances. Also, one can sort by size of the company or by market capitalization. |
| Select Your Default Chart Type: | |||||
| |||||
| Click on stock symbol or name for detailed view. Click on to add stock symbol to your watchlist and to view watchlist. Quick View: Move mouse or cursor over "Daily" to quickly view daily technical stock chart and over "Weekly" to view weekly technical stock chart. | |||||

 | WVE Wave Life Sciences Ltd. |
| Sector: Health Care | |
| SubSector: Biotechnology | |
| MarketCap: 452.785 Millions | |
| Recent Price: 4.76 Smart Investing & Trading Score: 51 | |
| Day Percent Change: -4.99% Day Change: -0.25 | |
| Week Change: -2.26% Year-to-date Change: -5.7% | |
| WVE Links: Profile News Message Board | |
| Charts:- Daily , Weekly | |
| Add WVE to Watchlist: View: Get Complete WVE Trend Analysis ➞ | |
 | AAT American Assets Trust, Inc. |
| Sector: Financials | |
| SubSector: REIT - Retail | |
| MarketCap: 1580.54 Millions | |
| Recent Price: 21.22 Smart Investing & Trading Score: 67 | |
| Day Percent Change: -0.35% Day Change: -0.07 | |
| Week Change: 1.07% Year-to-date Change: -5.8% | |
| AAT Links: Profile News Message Board | |
| Charts:- Daily , Weekly | |
| Add AAT to Watchlist: View: Get Complete AAT Trend Analysis ➞ | |
 | WDFC WD-40 Company |
| Sector: Materials | |
| SubSector: Specialty Chemicals | |
| MarketCap: 2900.57 Millions | |
| Recent Price: 225.27 Smart Investing & Trading Score: 10 | |
| Day Percent Change: -0.63% Day Change: -1.42 | |
| Week Change: -1.99% Year-to-date Change: -5.8% | |
| WDFC Links: Profile News Message Board | |
| Charts:- Daily , Weekly | |
| Add WDFC to Watchlist: View: Get Complete WDFC Trend Analysis ➞ | |
 | CLB Core Laboratories N.V. |
| Sector: Energy | |
| SubSector: Oil & Gas Equipment & Services | |
| MarketCap: 599.661 Millions | |
| Recent Price: 16.64 Smart Investing & Trading Score: 50 | |
| Day Percent Change: 0.64% Day Change: 0.11 | |
| Week Change: -3.17% Year-to-date Change: -5.8% | |
| CLB Links: Profile News Message Board | |
| Charts:- Daily , Weekly | |
| Add CLB to Watchlist: View: Get Complete CLB Trend Analysis ➞ | |
 | PDM Piedmont Office Realty Trust, Inc. |
| Sector: Financials | |
| SubSector: REIT - Office | |
| MarketCap: 2097.46 Millions | |
| Recent Price: 6.70 Smart Investing & Trading Score: 70 | |
| Day Percent Change: -2.83% Day Change: -0.19 | |
| Week Change: 3% Year-to-date Change: -5.8% | |
| PDM Links: Profile News Message Board | |
| Charts:- Daily , Weekly | |
| Add PDM to Watchlist: View: Get Complete PDM Trend Analysis ➞ | |
 | ARR ARMOUR Residential REIT, Inc. |
| Sector: Financials | |
| SubSector: Mortgage Investment | |
| MarketCap: 578.739 Millions | |
| Recent Price: 18.19 Smart Investing & Trading Score: 42 | |
| Day Percent Change: -2.88% Day Change: -0.54 | |
| Week Change: 0.11% Year-to-date Change: -5.9% | |
| ARR Links: Profile News Message Board | |
| Charts:- Daily , Weekly | |
| Add ARR to Watchlist: View: Get Complete ARR Trend Analysis ➞ | |
 | LKFN Lakeland Financial Corporation |
| Sector: Financials | |
| SubSector: Regional - Midwest Banks | |
| MarketCap: 903.27 Millions | |
| Recent Price: 61.33 Smart Investing & Trading Score: 60 | |
| Day Percent Change: -2.09% Day Change: -1.31 | |
| Week Change: -0.52% Year-to-date Change: -5.9% | |
| LKFN Links: Profile News Message Board | |
| Charts:- Daily , Weekly | |
| Add LKFN to Watchlist: View: Get Complete LKFN Trend Analysis ➞ | |
 | PMT PennyMac Mortgage Investment Trust |
| Sector: Financials | |
| SubSector: Mortgage Investment | |
| MarketCap: 917.639 Millions | |
| Recent Price: 14.07 Smart Investing & Trading Score: 39 | |
| Day Percent Change: 2.55% Day Change: 0.35 | |
| Week Change: 3.76% Year-to-date Change: -5.9% | |
| PMT Links: Profile News Message Board | |
| Charts:- Daily , Weekly | |
| Add PMT to Watchlist: View: Get Complete PMT Trend Analysis ➞ | |
 | EXLS ExlService Holdings, Inc. |
| Sector: Technology | |
| SubSector: Information Technology Services | |
| MarketCap: 1781.78 Millions | |
| Recent Price: 29.03 Smart Investing & Trading Score: 35 | |
| Day Percent Change: -1.83% Day Change: -0.54 | |
| Week Change: -0.99% Year-to-date Change: -5.9% | |
| EXLS Links: Profile News Message Board | |
| Charts:- Daily , Weekly | |
| Add EXLS to Watchlist: View: Get Complete EXLS Trend Analysis ➞ | |
 | MYGN Myriad Genetics, Inc. |
| Sector: Services & Goods | |
| SubSector: Research Services | |
| MarketCap: 1051.94 Millions | |
| Recent Price: 18.00 Smart Investing & Trading Score: 0 | |
| Day Percent Change: -3.38% Day Change: -0.63 | |
| Week Change: -2.7% Year-to-date Change: -6.0% | |
| MYGN Links: Profile News Message Board | |
| Charts:- Daily , Weekly | |
| Add MYGN to Watchlist: View: Get Complete MYGN Trend Analysis ➞ | |
 | DC Dakota Gold Corp. |
| Sector: Materials | |
| SubSector: Gold | |
| MarketCap: 218 Millions | |
| Recent Price: 2.44 Smart Investing & Trading Score: 43 | |
| Day Percent Change: 3.38% Day Change: 0.08 | |
| Week Change: -2.98% Year-to-date Change: -6.0% | |
| DC Links: Profile News Message Board | |
| Charts:- Daily , Weekly | |
| Add DC to Watchlist: View: Get Complete DC Trend Analysis ➞ | |
 | KRG Kite Realty Group Trust |
| Sector: Financials | |
| SubSector: REIT - Retail | |
| MarketCap: 1030.14 Millions | |
| Recent Price: 21.49 Smart Investing & Trading Score: 93 | |
| Day Percent Change: -1.06% Day Change: -0.23 | |
| Week Change: 2.87% Year-to-date Change: -6.0% | |
| KRG Links: Profile News Message Board | |
| Charts:- Daily , Weekly | |
| Add KRG to Watchlist: View: Get Complete KRG Trend Analysis ➞ | |
 | ALG Alamo Group Inc. |
| Sector: Industrials | |
| SubSector: Farm & Construction Machinery | |
| MarketCap: 964.107 Millions | |
| Recent Price: 197.46 Smart Investing & Trading Score: 10 | |
| Day Percent Change: -3.30% Day Change: -6.74 | |
| Week Change: -2.41% Year-to-date Change: -6.1% | |
| ALG Links: Profile News Message Board | |
| Charts:- Daily , Weekly | |
| Add ALG to Watchlist: View: Get Complete ALG Trend Analysis ➞ | |
 | PNRG PrimeEnergy Resources Corporation |
| Sector: Energy | |
| SubSector: Independent Oil & Gas | |
| MarketCap: 112.593 Millions | |
| Recent Price: 99.87 Smart Investing & Trading Score: 41 | |
| Day Percent Change: -0.82% Day Change: -0.83 | |
| Week Change: -1.16% Year-to-date Change: -6.1% | |
| PNRG Links: Profile News Message Board | |
| Charts:- Daily , Weekly | |
| Add PNRG to Watchlist: View: Get Complete PNRG Trend Analysis ➞ | |
 | HTLF Heartland Financial USA, Inc. |
| Sector: Financials | |
| SubSector: Regional - Southwest Banks | |
| MarketCap: 1143.85 Millions | |
| Recent Price: 35.31 Smart Investing & Trading Score: 100 | |
| Day Percent Change: -1.99% Day Change: -0.72 | |
| Week Change: 1.45% Year-to-date Change: -6.1% | |
| HTLF Links: Profile News Message Board | |
| Charts:- Daily , Weekly | |
| Add HTLF to Watchlist: View: Get Complete HTLF Trend Analysis ➞ | |
 | PEB Pebblebrook Hotel Trust |
| Sector: Financials | |
| SubSector: REIT - Hotel/Motel | |
| MarketCap: 1472.84 Millions | |
| Recent Price: 15.00 Smart Investing & Trading Score: 93 | |
| Day Percent Change: -3.85% Day Change: -0.60 | |
| Week Change: 2.53% Year-to-date Change: -6.1% | |
| PEB Links: Profile News Message Board | |
| Charts:- Daily , Weekly | |
| Add PEB to Watchlist: View: Get Complete PEB Trend Analysis ➞ | |
 | LPG Dorian LPG Ltd. |
| Sector: Transports | |
| SubSector: Shipping | |
| MarketCap: 426.414 Millions | |
| Recent Price: 41.18 Smart Investing & Trading Score: 88 | |
| Day Percent Change: -1.51% Day Change: -0.63 | |
| Week Change: 3.47% Year-to-date Change: -6.1% | |
| LPG Links: Profile News Message Board | |
| Charts:- Daily , Weekly | |
| Add LPG to Watchlist: View: Get Complete LPG Trend Analysis ➞ | |
 | CVGW Calavo Growers, Inc. |
| Sector: Consumer Staples | |
| SubSector: Farm Products | |
| MarketCap: 935.287 Millions | |
| Recent Price: 27.61 Smart Investing & Trading Score: 80 | |
| Day Percent Change: 0.82% Day Change: 0.23 | |
| Week Change: -2.83% Year-to-date Change: -6.1% | |
| CVGW Links: Profile News Message Board | |
| Charts:- Daily , Weekly | |
| Add CVGW to Watchlist: View: Get Complete CVGW Trend Analysis ➞ | |
 | LADR Ladder Capital Corp |
| Sector: Financials | |
| SubSector: Mortgage Investment | |
| MarketCap: 660.039 Millions | |
| Recent Price: 10.80 Smart Investing & Trading Score: 42 | |
| Day Percent Change: 2.86% Day Change: 0.30 | |
| Week Change: 3.05% Year-to-date Change: -6.2% | |
| LADR Links: Profile News Message Board | |
| Charts:- Daily , Weekly | |
| Add LADR to Watchlist: View: Get Complete LADR Trend Analysis ➞ | |
 | XPOF Xponential Fitness, Inc. |
| Sector: Services & Goods | |
| SubSector: Leisure | |
| MarketCap: 811 Millions | |
| Recent Price: 12.23 Smart Investing & Trading Score: 46 | |
| Day Percent Change: -3.70% Day Change: -0.47 | |
| Week Change: -6.96% Year-to-date Change: -6.2% | |
| XPOF Links: Profile News Message Board | |
| Charts:- Daily , Weekly | |
| Add XPOF to Watchlist: View: Get Complete XPOF Trend Analysis ➞ | |
 | HWC Hancock Whitney Corporation |
| Sector: Financials | |
| SubSector: Regional - Southeast Banks | |
| MarketCap: 1438.55 Millions | |
| Recent Price: 45.57 Smart Investing & Trading Score: 80 | |
| Day Percent Change: -1.94% Day Change: -0.90 | |
| Week Change: 2.96% Year-to-date Change: -6.2% | |
| HWC Links: Profile News Message Board | |
| Charts:- Daily , Weekly | |
| Add HWC to Watchlist: View: Get Complete HWC Trend Analysis ➞ | |
 | FFBC First Financial Bancorp. |
| Sector: Financials | |
| SubSector: Regional - Midwest Banks | |
| MarketCap: 1363.7 Millions | |
| Recent Price: 22.27 Smart Investing & Trading Score: 80 | |
| Day Percent Change: -1.24% Day Change: -0.28 | |
| Week Change: 1.74% Year-to-date Change: -6.2% | |
| FFBC Links: Profile News Message Board | |
| Charts:- Daily , Weekly | |
| Add FFBC to Watchlist: View: Get Complete FFBC Trend Analysis ➞ | |
 | LTH Life Time Group Holdings, Inc. |
| Sector: Services & Goods | |
| SubSector: Leisure | |
| MarketCap: 3740 Millions | |
| Recent Price: 14.21 Smart Investing & Trading Score: 51 | |
| Day Percent Change: -2.71% Day Change: -0.39 | |
| Week Change: 1.39% Year-to-date Change: -6.2% | |
| LTH Links: Profile News Message Board | |
| Charts:- Daily , Weekly | |
| Add LTH to Watchlist: View: Get Complete LTH Trend Analysis ➞ | |
 | PDFS PDF Solutions, Inc. |
| Sector: Technology | |
| SubSector: Technical & System Software | |
| MarketCap: 345.1 Millions | |
| Recent Price: 30.12 Smart Investing & Trading Score: 25 | |
| Day Percent Change: 0.13% Day Change: 0.04 | |
| Week Change: 1.89% Year-to-date Change: -6.3% | |
| PDFS Links: Profile News Message Board | |
| Charts:- Daily , Weekly | |
| Add PDFS to Watchlist: View: Get Complete PDFS Trend Analysis ➞ | |
 | GEF Greif, Inc. |
| Sector: Consumer Staples | |
| SubSector: Packaging & Containers | |
| MarketCap: 1563.03 Millions | |
| Recent Price: 61.47 Smart Investing & Trading Score: 38 | |
| Day Percent Change: -1.42% Day Change: -0.88 | |
| Week Change: 0.17% Year-to-date Change: -6.3% | |
| GEF Links: Profile News Message Board | |
| Charts:- Daily , Weekly | |
| Add GEF to Watchlist: View: Get Complete GEF Trend Analysis ➞ | |
| Too many stocks? View smallcap stocks filtered by marketcap & sector |
| Marketcap: All SmallCap Stocks (default-no microcap), Large, Mid-Range, Small & MicroCap |
| Sector: Tech, Finance, Energy, Staples, Retail, Industrial, Materials, Utilities & Medical |
|
Best Stocks Today 12Stocks.com |
© 2024 12Stocks.com Terms & Conditions Privacy Contact Us
All Information Provided Only For Education And Not To Be Used For Investing or Trading. See Terms & Conditions


One More Thing ... Get Best Stocks Delivered Daily!
Never Ever Miss A Move With Our Top Ten Stocks Lists
Find Best Stocks In Any Market - Bull or Bear Market
Take A Peek At Our Top Ten Stocks Lists: Daily, Weekly, Year-to-Date & Top Trends
Find Best Stocks In Any Market - Bull or Bear Market
Take A Peek At Our Top Ten Stocks Lists: Daily, Weekly, Year-to-Date & Top Trends
Smallcap Stocks With Best Up Trends [0-bearish to 100-bullish]: B. Riley[100], Ribbon [100], Cricut [100], Central Pacific[100], California Water[100], Diodes [100], Carpenter [100], Sanmina [100], Agios [100], Comstock Resources[100], Excelerate Energy[100]
Best Smallcap Stocks Year-to-Date:
CareMax [572.16%], Janux [333.88%], Viking [261.04%], Alpine Immune[239.52%], Longboard [218%], Super Micro[175.94%], Avidity Biosciences[159.79%], Arcutis Bio[156.19%], Vera [154.33%], Hippo [126.07%], Y-mAbs [121.85%] Best Smallcap Stocks This Week:
Matterport [169.25%], B. Riley[65.73%], Seres [33.67%], Impinj [31.96%], Ribbon [30.81%], Riot Blockchain[30.23%], ProKidney [27.45%], CareMax [26.85%], P.A.M. Transportation[26.15%], Cullinan Oncology[21.1%], Hibbett Sports[20.85%] Best Smallcap Stocks Daily:
Impinj [26.95%], P.A.M. Transportation[21.11%], Strategic Education[14.81%], OptiNose [14.56%], Sonic Automotive[12.75%], Intevac [11.89%], B. Riley[11.36%], Noodles & [8.08%], Red Robin[7.69%], JELD-WEN Holding[7.31%], Community Health[6.77%]