
 Login Sign Up


| |||||
 |  | ||||

| 12Stocks.com Market Intelligence |
Best SmallCap Stocks
|
| In a hurry? Small Cap Stock Lists: Performance Trends Table, Stock Charts
Sort Small Cap stocks: Daily, Weekly, Year-to-Date, Market Cap & Trends. Filter Small Cap stocks list by sector: Show all, Tech, Finance, Energy, Staples, Retail, Industrial, Materials, Utilities and HealthCare Filter Small Cap stocks list by size: All Large Medium Small and MicroCap |
| 12Stocks.com Small Cap Stocks Performances & Trends Daily | |||||||||
|
|  The overall Smart Investing & Trading Score is 58 (0-bearish to 100-bullish) which puts Small Cap index in short term neutral trend. The Smart Investing & Trading Score from previous trading session is 63 and hence a deterioration of trend.
| ||||||||
Here are the Smart Investing & Trading Scores of the most requested small cap stocks at 12Stocks.com (click stock name for detailed review):
|


| 12Stocks.com: Investing in Smallcap Index with Stocks | |
|
The following table helps investors and traders sort through current performance and trends (as measured by Smart Investing & Trading Score) of various
stocks in the Smallcap Index. Quick View: Move mouse or cursor over stock symbol (ticker) to view short-term technical chart and over stock name to view long term chart. Click on  to add stock symbol to your watchlist and to add stock symbol to your watchlist and  to view watchlist. Click on any ticker or stock name for detailed market intelligence report for that stock. to view watchlist. Click on any ticker or stock name for detailed market intelligence report for that stock. |
12Stocks.com Performance of Stocks in Smallcap Index
| Ticker | Stock Name | Watchlist | Category | Recent Price | Smart Investing & Trading Score | Change % | YTD Change% |
| BGS | B&G Foods |   | Consumer Staples | 11.05 | 75 | -0.18% | 5.24% |
| RM | Regional Management | | Financials | 26.38 | 100 | 0.53% | 5.18% |
| LNTH | Lantheus | | Health Care | 65.21 | 81 | 1.24% | 5.18% |
| TCMD | Tactile Systems | | Health Care | 15.04 | 52 | 3.23% | 5.17% |
| NTB | Bank of N.T. Butterfield & Son | | Financials | 33.66 | 80 | 5.09% | 5.15% |
| NWPX | Northwest Pipe | | Materials | 31.80 | 61 | -1.76% | 5.09% |
| CDMO | Avid Bioservices | | Health Care | 6.83 | 75 | 2.25% | 5.08% |
| SDRL | Seadrill | | Energy | 49.78 | 61 | -1.94% | 5.01% |
| BANC | Banc of California | | Financials | 14.09 | 17 | 1.00% | 4.91% |
| PRDO | Perdoceo Education | | Services & Goods | 18.42 | 77 | 3.25% | 4.90% |
| INFN | Infinera | | Technology | 4.98 | 49 | 1.84% | 4.84% |
| CYRX | Cryoport | | Consumer Staples | 16.23 | 46 | 0.74% | 4.78% |
| GATX | GATX | | Transports | 125.83 | 26 | -0.23% | 4.67% |
| LXRX | Lexicon | | Health Care | 1.60 | 10 | -0.62% | 4.58% |
| GENC | Gencor Industries | | Industrials | 16.88 | 54 | -0.18% | 4.58% |
| SUPN | Supernus | | Health Care | 30.26 | 68 | 1.04% | 4.56% |
| GRBK | Green Brick | | Financials | 54.31 | 58 | -0.62% | 4.56% |
| HSII | Heidrick & Struggles | | Services & Goods | 30.87 | 70 | 0.32% | 4.54% |
| LAUR | Laureate Education | | Services & Goods | 14.32 | 48 | 0.49% | 4.45% |
| EPC | Edgewell Personal | | Consumer Staples | 38.23 | 100 | 1.38% | 4.37% |
| CTS | CTS | | Technology | 45.64 | 83 | 0.33% | 4.34% |
| LQDA | Liquidia | | Health Care | 12.55 | 23 | -3.09% | 4.32% |
| SLP | Simulations Plus | | Technology | 46.65 | 68 | 1.69% | 4.25% |
| DFIN | Donnelley Financial | | Services & Goods | 65.00 | 95 | -0.58% | 4.22% |
| PFSI | PennyMac Financial | | Financials | 92.07 | 88 | -0.77% | 4.19% |


| Too many stocks? View smallcap stocks filtered by marketcap & sector |
| Marketcap: All SmallCap Stocks (default-no microcap), Large, Mid-Range, Small |
| Smallcap Sector: Tech, Finance, Energy, Staples, Retail, Industrial, Materials, & Medical |
|
Get the most comprehensive stock market coverage daily at 12Stocks.com ➞ Best Stocks Today ➞ Best Stocks Weekly ➞ Best Stocks Year-to-Date ➞ Best Stocks Trends ➞  Best Stocks Today 12Stocks.com Best Nasdaq Stocks ➞ Best S&P 500 Stocks ➞ Best Tech Stocks ➞ Best Biotech Stocks ➞ |
| Detailed Overview of SmallCap Stocks |
| SmallCap Technical Overview, Leaders & Laggards, Top SmallCap ETF Funds & Detailed SmallCap Stocks List, Charts, Trends & More |
| Smallcap: Technical Analysis, Trends & YTD Performance | |
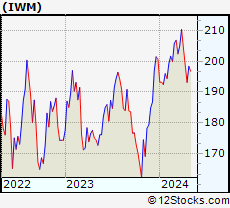
| SmallCap segment as represented by
IWM, an exchange-traded fund [ETF], holds basket of thousands of smallcap stocks from across all major sectors of the US stock market. The smallcap index (contains stocks like Riverbed & Sotheby's) is down by -1.51% and is currently underperforming the overall market by -7.17% year-to-date. Below is a quick view of technical charts and trends: | |
 IWM Weekly Chart |
|
| Long Term Trend: Good | |
| Medium Term Trend: Not Good | |
 IWM Daily Chart |
|
| Short Term Trend: Very Good | |
| Overall Trend Score: 58 | |
| YTD Performance: -1.51% | |
| **Trend Scores & Views Are Only For Educational Purposes And Not For Investing | |
| 12Stocks.com: Top Performing Small Cap Index Stocks | ||||||||||||||||||||||||||||||||||||||||||||||||
 The top performing Small Cap Index stocks year to date are
Now, more recently, over last week, the top performing Small Cap Index stocks on the move are


|
||||||||||||||||||||||||||||||||||||||||||||||||
| 12Stocks.com: Investing in Smallcap Index using Exchange Traded Funds | |
|
The following table shows list of key exchange traded funds (ETF) that
help investors track Smallcap index. The following list also includes leveraged ETF funds that track twice or thrice the daily returns of Smallcap indices. Short or inverse ETF funds move in the opposite direction to the index they track and are useful during market pullbacks or during bear markets. Quick View: Move mouse or cursor over ETF symbol (ticker) to view short-term technical chart and over ETF name to view long term chart. Click on ticker or stock name for detailed view. Click on to add stock symbol to your watchlist and to view watchlist. |
12Stocks.com List of ETFs that track Smallcap Index
| Ticker | ETF Name | Watchlist | Recent Price | Smart Investing & Trading Score | Change % | Week % | Year-to-date % |
| IWM | iShares Russell 2000 | | 197.68 | 58 | -0.45 | 2.35 | -1.51% |
| IJR | iShares Core S&P Small-Cap | | 105.71 | 85 | -0.24 | 2.41 | -2.35% |
| VTWO | Vanguard Russell 2000 ETF | | 79.93 | 48 | -0.45 | 2.37 | -1.44% |
| IWN | iShares Russell 2000 Value | | 151.28 | 75 | -0.30 | 2.37 | -2.61% |
| IWO | iShares Russell 2000 Growth | | 251.27 | 58 | -0.44 | 2.44 | -0.38% |
| IJS | iShares S&P Small-Cap 600 Value | | 97.71 | 45 | -0.43 | 2.2 | -5.2% |
| IJT | iShares S&P Small-Cap 600 Growth | | 125.37 | 48 | -0.28 | 2.59 | 0.18% |
| XSLV | PowerShares S&P SmallCap Low Volatil ETF | | 42.94 | 48 | -0.26 | 1.8 | -2.74% |
| SBB | ProShares Short SmallCap600 | | 16.37 | 33 | -0.02 | -2.79 | 2.76% |
| SMLV | SPDR SSGA US Small Cap Low Volatil ETF | | 108.43 | 73 | -0.31 | 2.21 | -3.63% |
| SAA | ProShares Ultra SmallCap600 | | 23.01 | 58 | -0.60 | 5.55 | -7.78% |
| SDD | ProShares UltraShort SmallCap600 | | 19.49 | 42 | 1.35 | -4.18 | 5.77% |
| 12Stocks.com: Charts, Trends, Fundamental Data and Performances of SmallCap Stocks | |
|
We now take in-depth look at all SmallCap stocks including charts, multi-period performances and overall trends (as measured by Smart Investing & Trading Score). One can sort SmallCap stocks (click link to choose) by Daily, Weekly and by Year-to-Date performances. Also, one can sort by size of the company or by market capitalization. |
| Select Your Default Chart Type: | |||||
| |||||
| Click on stock symbol or name for detailed view. Click on to add stock symbol to your watchlist and to view watchlist. Quick View: Move mouse or cursor over "Daily" to quickly view daily technical stock chart and over "Weekly" to view weekly technical stock chart. | |||||

 | BGS B&G Foods, Inc. |
| Sector: Consumer Staples | |
| SubSector: Processed & Packaged Goods | |
| MarketCap: 1456.08 Millions | |
| Recent Price: 11.05 Smart Investing & Trading Score: 75 | |
| Day Percent Change: -0.18% Day Change: -0.02 | |
| Week Change: 2.98% Year-to-date Change: 5.2% | |
| BGS Links: Profile News Message Board | |
| Charts:- Daily , Weekly | |
| Add BGS to Watchlist: View: Get Complete BGS Trend Analysis ➞ | |
 | RM Regional Management Corp. |
| Sector: Financials | |
| SubSector: Credit Services | |
| MarketCap: 148.008 Millions | |
| Recent Price: 26.38 Smart Investing & Trading Score: 100 | |
| Day Percent Change: 0.53% Day Change: 0.14 | |
| Week Change: 4.68% Year-to-date Change: 5.2% | |
| RM Links: Profile News Message Board | |
| Charts:- Daily , Weekly | |
| Add RM to Watchlist: View: Get Complete RM Trend Analysis ➞ | |
 | LNTH Lantheus Holdings, Inc. |
| Sector: Health Care | |
| SubSector: Medical Appliances & Equipment | |
| MarketCap: 467.18 Millions | |
| Recent Price: 65.21 Smart Investing & Trading Score: 81 | |
| Day Percent Change: 1.24% Day Change: 0.80 | |
| Week Change: 2.19% Year-to-date Change: 5.2% | |
| LNTH Links: Profile News Message Board | |
| Charts:- Daily , Weekly | |
| Add LNTH to Watchlist: View: Get Complete LNTH Trend Analysis ➞ | |
 | TCMD Tactile Systems Technology, Inc. |
| Sector: Health Care | |
| SubSector: Medical Instruments & Supplies | |
| MarketCap: 655.96 Millions | |
| Recent Price: 15.04 Smart Investing & Trading Score: 52 | |
| Day Percent Change: 3.23% Day Change: 0.47 | |
| Week Change: 4.44% Year-to-date Change: 5.2% | |
| TCMD Links: Profile News Message Board | |
| Charts:- Daily , Weekly | |
| Add TCMD to Watchlist: View: Get Complete TCMD Trend Analysis ➞ | |
 | NTB The Bank of N.T. Butterfield & Son Limited |
| Sector: Financials | |
| SubSector: Foreign Regional Banks | |
| MarketCap: 889.379 Millions | |
| Recent Price: 33.66 Smart Investing & Trading Score: 80 | |
| Day Percent Change: 5.09% Day Change: 1.63 | |
| Week Change: 8.37% Year-to-date Change: 5.2% | |
| NTB Links: Profile News Message Board | |
| Charts:- Daily , Weekly | |
| Add NTB to Watchlist: View: Get Complete NTB Trend Analysis ➞ | |
 | NWPX Northwest Pipe Company |
| Sector: Materials | |
| SubSector: Steel & Iron | |
| MarketCap: 245.788 Millions | |
| Recent Price: 31.80 Smart Investing & Trading Score: 61 | |
| Day Percent Change: -1.76% Day Change: -0.57 | |
| Week Change: -0.16% Year-to-date Change: 5.1% | |
| NWPX Links: Profile News Message Board | |
| Charts:- Daily , Weekly | |
| Add NWPX to Watchlist: View: Get Complete NWPX Trend Analysis ➞ | |
 | CDMO Avid Bioservices, Inc. |
| Sector: Health Care | |
| SubSector: Biotechnology | |
| MarketCap: 203.685 Millions | |
| Recent Price: 6.83 Smart Investing & Trading Score: 75 | |
| Day Percent Change: 2.25% Day Change: 0.15 | |
| Week Change: 6.55% Year-to-date Change: 5.1% | |
| CDMO Links: Profile News Message Board | |
| Charts:- Daily , Weekly | |
| Add CDMO to Watchlist: View: Get Complete CDMO Trend Analysis ➞ | |
 | SDRL Seadrill Limited |
| Sector: Energy | |
| SubSector: Oil & Gas Drilling | |
| MarketCap: 3300 Millions | |
| Recent Price: 49.78 Smart Investing & Trading Score: 61 | |
| Day Percent Change: -1.94% Day Change: -0.99 | |
| Week Change: 0.21% Year-to-date Change: 5.0% | |
| SDRL Links: Profile News Message Board | |
| Charts:- Daily , Weekly | |
| Add SDRL to Watchlist: View: Get Complete SDRL Trend Analysis ➞ | |
 | BANC Banc of California, Inc. |
| Sector: Financials | |
| SubSector: Regional - Pacific Banks | |
| MarketCap: 459.929 Millions | |
| Recent Price: 14.09 Smart Investing & Trading Score: 17 | |
| Day Percent Change: 1.00% Day Change: 0.14 | |
| Week Change: 1.66% Year-to-date Change: 4.9% | |
| BANC Links: Profile News Message Board | |
| Charts:- Daily , Weekly | |
| Add BANC to Watchlist: View: Get Complete BANC Trend Analysis ➞ | |
 | PRDO Perdoceo Education Corporation |
| Sector: Services & Goods | |
| SubSector: Education & Training Services | |
| MarketCap: 631.006 Millions | |
| Recent Price: 18.42 Smart Investing & Trading Score: 77 | |
| Day Percent Change: 3.25% Day Change: 0.58 | |
| Week Change: 6.35% Year-to-date Change: 4.9% | |
| PRDO Links: Profile News Message Board | |
| Charts:- Daily , Weekly | |
| Add PRDO to Watchlist: View: Get Complete PRDO Trend Analysis ➞ | |
 | INFN Infinera Corporation |
| Sector: Technology | |
| SubSector: Communication Equipment | |
| MarketCap: 943 Millions | |
| Recent Price: 4.98 Smart Investing & Trading Score: 49 | |
| Day Percent Change: 1.84% Day Change: 0.09 | |
| Week Change: 5.51% Year-to-date Change: 4.8% | |
| INFN Links: Profile News Message Board | |
| Charts:- Daily , Weekly | |
| Add INFN to Watchlist: View: Get Complete INFN Trend Analysis ➞ | |
 | CYRX Cryoport, Inc. |
| Sector: Consumer Staples | |
| SubSector: Packaging & Containers | |
| MarketCap: 576.653 Millions | |
| Recent Price: 16.23 Smart Investing & Trading Score: 46 | |
| Day Percent Change: 0.74% Day Change: 0.12 | |
| Week Change: 0.62% Year-to-date Change: 4.8% | |
| CYRX Links: Profile News Message Board | |
| Charts:- Daily , Weekly | |
| Add CYRX to Watchlist: View: Get Complete CYRX Trend Analysis ➞ | |
 | GATX GATX Corporation |
| Sector: Transports | |
| SubSector: Rental & Leasing Services | |
| MarketCap: 2080.34 Millions | |
| Recent Price: 125.83 Smart Investing & Trading Score: 26 | |
| Day Percent Change: -0.23% Day Change: -0.29 | |
| Week Change: -3.19% Year-to-date Change: 4.7% | |
| GATX Links: Profile News Message Board | |
| Charts:- Daily , Weekly | |
| Add GATX to Watchlist: View: Get Complete GATX Trend Analysis ➞ | |
 | LXRX Lexicon Pharmaceuticals, Inc. |
| Sector: Health Care | |
| SubSector: Biotechnology | |
| MarketCap: 251.185 Millions | |
| Recent Price: 1.60 Smart Investing & Trading Score: 10 | |
| Day Percent Change: -0.62% Day Change: -0.01 | |
| Week Change: -3.03% Year-to-date Change: 4.6% | |
| LXRX Links: Profile News Message Board | |
| Charts:- Daily , Weekly | |
| Add LXRX to Watchlist: View: Get Complete LXRX Trend Analysis ➞ | |
 | GENC Gencor Industries, Inc. |
| Sector: Industrials | |
| SubSector: Farm & Construction Machinery | |
| MarketCap: 147.607 Millions | |
| Recent Price: 16.88 Smart Investing & Trading Score: 54 | |
| Day Percent Change: -0.18% Day Change: -0.03 | |
| Week Change: -1.06% Year-to-date Change: 4.6% | |
| GENC Links: Profile News Message Board | |
| Charts:- Daily , Weekly | |
| Add GENC to Watchlist: View: Get Complete GENC Trend Analysis ➞ | |
 | SUPN Supernus Pharmaceuticals, Inc. |
| Sector: Health Care | |
| SubSector: Drugs - Generic | |
| MarketCap: 833.585 Millions | |
| Recent Price: 30.26 Smart Investing & Trading Score: 68 | |
| Day Percent Change: 1.04% Day Change: 0.31 | |
| Week Change: 2.93% Year-to-date Change: 4.6% | |
| SUPN Links: Profile News Message Board | |
| Charts:- Daily , Weekly | |
| Add SUPN to Watchlist: View: Get Complete SUPN Trend Analysis ➞ | |
 | GRBK Green Brick Partners, Inc. |
| Sector: Financials | |
| SubSector: Real Estate Development | |
| MarketCap: 341.819 Millions | |
| Recent Price: 54.31 Smart Investing & Trading Score: 58 | |
| Day Percent Change: -0.62% Day Change: -0.34 | |
| Week Change: 3.76% Year-to-date Change: 4.6% | |
| GRBK Links: Profile News Message Board | |
| Charts:- Daily , Weekly | |
| Add GRBK to Watchlist: View: Get Complete GRBK Trend Analysis ➞ | |
 | HSII Heidrick & Struggles International, Inc. |
| Sector: Services & Goods | |
| SubSector: Staffing & Outsourcing Services | |
| MarketCap: 431.428 Millions | |
| Recent Price: 30.87 Smart Investing & Trading Score: 70 | |
| Day Percent Change: 0.32% Day Change: 0.10 | |
| Week Change: 1.21% Year-to-date Change: 4.5% | |
| HSII Links: Profile News Message Board | |
| Charts:- Daily , Weekly | |
| Add HSII to Watchlist: View: Get Complete HSII Trend Analysis ➞ | |
 | LAUR Laureate Education, Inc. |
| Sector: Services & Goods | |
| SubSector: Education & Training Services | |
| MarketCap: 2258.56 Millions | |
| Recent Price: 14.32 Smart Investing & Trading Score: 48 | |
| Day Percent Change: 0.49% Day Change: 0.07 | |
| Week Change: 1.99% Year-to-date Change: 4.5% | |
| LAUR Links: Profile News Message Board | |
| Charts:- Daily , Weekly | |
| Add LAUR to Watchlist: View: Get Complete LAUR Trend Analysis ➞ | |
 | EPC Edgewell Personal Care Company |
| Sector: Consumer Staples | |
| SubSector: Personal Products | |
| MarketCap: 1605.95 Millions | |
| Recent Price: 38.23 Smart Investing & Trading Score: 100 | |
| Day Percent Change: 1.38% Day Change: 0.52 | |
| Week Change: 4.31% Year-to-date Change: 4.4% | |
| EPC Links: Profile News Message Board | |
| Charts:- Daily , Weekly | |
| Add EPC to Watchlist: View: Get Complete EPC Trend Analysis ➞ | |
 | CTS CTS Corporation |
| Sector: Technology | |
| SubSector: Diversified Electronics | |
| MarketCap: 645.896 Millions | |
| Recent Price: 45.64 Smart Investing & Trading Score: 83 | |
| Day Percent Change: 0.33% Day Change: 0.15 | |
| Week Change: 5.09% Year-to-date Change: 4.3% | |
| CTS Links: Profile News Message Board | |
| Charts:- Daily , Weekly | |
| Add CTS to Watchlist: View: Get Complete CTS Trend Analysis ➞ | |
 | LQDA Liquidia Technologies, Inc. |
| Sector: Health Care | |
| SubSector: Biotechnology | |
| MarketCap: 80.4785 Millions | |
| Recent Price: 12.55 Smart Investing & Trading Score: 23 | |
| Day Percent Change: -3.09% Day Change: -0.40 | |
| Week Change: -5.71% Year-to-date Change: 4.3% | |
| LQDA Links: Profile News Message Board | |
| Charts:- Daily , Weekly | |
| Add LQDA to Watchlist: View: Get Complete LQDA Trend Analysis ➞ | |
 | SLP Simulations Plus, Inc. |
| Sector: Technology | |
| SubSector: Business Software & Services | |
| MarketCap: 564.258 Millions | |
| Recent Price: 46.65 Smart Investing & Trading Score: 68 | |
| Day Percent Change: 1.69% Day Change: 0.77 | |
| Week Change: 3.3% Year-to-date Change: 4.3% | |
| SLP Links: Profile News Message Board | |
| Charts:- Daily , Weekly | |
| Add SLP to Watchlist: View: Get Complete SLP Trend Analysis ➞ | |
 | DFIN Donnelley Financial Solutions, Inc. |
| Sector: Services & Goods | |
| SubSector: Business Services | |
| MarketCap: 229.882 Millions | |
| Recent Price: 65.00 Smart Investing & Trading Score: 95 | |
| Day Percent Change: -0.58% Day Change: -0.38 | |
| Week Change: 4.47% Year-to-date Change: 4.2% | |
| DFIN Links: Profile News Message Board | |
| Charts:- Daily , Weekly | |
| Add DFIN to Watchlist: View: Get Complete DFIN Trend Analysis ➞ | |
 | PFSI PennyMac Financial Services, Inc. |
| Sector: Financials | |
| SubSector: Mortgage Investment | |
| MarketCap: 1588.09 Millions | |
| Recent Price: 92.07 Smart Investing & Trading Score: 88 | |
| Day Percent Change: -0.77% Day Change: -0.71 | |
| Week Change: 4.67% Year-to-date Change: 4.2% | |
| PFSI Links: Profile News Message Board | |
| Charts:- Daily , Weekly | |
| Add PFSI to Watchlist: View: Get Complete PFSI Trend Analysis ➞ | |
| Too many stocks? View smallcap stocks filtered by marketcap & sector |
| Marketcap: All SmallCap Stocks (default-no microcap), Large, Mid-Range, Small & MicroCap |
| Sector: Tech, Finance, Energy, Staples, Retail, Industrial, Materials, Utilities & Medical |
|
Best Stocks Today 12Stocks.com |
© 2024 12Stocks.com Terms & Conditions Privacy Contact Us
All Information Provided Only For Education And Not To Be Used For Investing or Trading. See Terms & Conditions


One More Thing ... Get Best Stocks Delivered Daily!
Never Ever Miss A Move With Our Top Ten Stocks Lists
Find Best Stocks In Any Market - Bull or Bear Market
Take A Peek At Our Top Ten Stocks Lists: Daily, Weekly, Year-to-Date & Top Trends
Find Best Stocks In Any Market - Bull or Bear Market
Take A Peek At Our Top Ten Stocks Lists: Daily, Weekly, Year-to-Date & Top Trends
Smallcap Stocks With Best Up Trends [0-bearish to 100-bullish]: B. Riley[100], Ribbon [100], Group 1[100], Trustmark [100], MBIA [100], Integer [100], EchoStar [100], Comstock Resources[100], Vishay Inter[100], Jamf Holding[100], SunOpta [100]
Best Smallcap Stocks Year-to-Date:
CareMax [574.23%], Janux [352.07%], Viking [249.65%], Alpine Immune[239.13%], Longboard [223.4%], Avidity Biosciences[177.71%], Arcutis Bio[170.9%], Super Micro[165.5%], Vera [149.61%], Hippo [130.79%], Y-mAbs [124.19%] Best Smallcap Stocks This Week:
Matterport [166.09%], B. Riley[48.82%], Seres [30.29%], Riot Blockchain[30.12%], CareMax [27.24%], Ribbon [25.97%], ProKidney [23.28%], SoundHound AI[22.54%], Cipher Mining[22.14%], Hibbett Sports[21.61%], Cullinan Oncology[20.69%] Best Smallcap Stocks Daily:
B. Riley[36.97%], Ribbon [26.46%], Babcock & Wilcox Enterprises[15.57%], Cullinan Oncology[13.55%], Amneal [12.04%], Comtech Tele[10.76%], Innodata [10.28%], Gritstone Oncology[10.06%], Navitas Semiconductor[8.83%], Eyenovia [8.68%], K12 [8.64%]