
 Login Sign Up


| |||||
 |  | ||||

| 12Stocks.com Market Intelligence |
Best SmallCap Stocks
|
| In a hurry? Small Cap Stock Lists: Performance Trends Table, Stock Charts
Sort Small Cap stocks: Daily, Weekly, Year-to-Date, Market Cap & Trends. Filter Small Cap stocks list by sector: Show all, Tech, Finance, Energy, Staples, Retail, Industrial, Materials, Utilities and HealthCare Filter Small Cap stocks list by size: All Large Medium Small and MicroCap |
| 12Stocks.com Small Cap Stocks Performances & Trends Daily | |||||||||
|
|  The overall Smart Investing & Trading Score is 26 (0-bearish to 100-bullish) which puts Small Cap index in short term bearish to neutral trend. The Smart Investing & Trading Score from previous trading session is 31 and hence a deterioration of trend.
| ||||||||
Here are the Smart Investing & Trading Scores of the most requested small cap stocks at 12Stocks.com (click stock name for detailed review):
|


| 12Stocks.com: Investing in Smallcap Index with Stocks | |
|
The following table helps investors and traders sort through current performance and trends (as measured by Smart Investing & Trading Score) of various
stocks in the Smallcap Index. Quick View: Move mouse or cursor over stock symbol (ticker) to view short-term technical chart and over stock name to view long term chart. Click on  to add stock symbol to your watchlist and to add stock symbol to your watchlist and  to view watchlist. Click on any ticker or stock name for detailed market intelligence report for that stock. to view watchlist. Click on any ticker or stock name for detailed market intelligence report for that stock. |
12Stocks.com Performance of Stocks in Smallcap Index
| Ticker | Stock Name | Watchlist | Category | Recent Price | Smart Investing & Trading Score | Change % | YTD Change% |
| ACRE | Ares Commercial |   | Financials | 6.74 | 10 | -3.99% | -34.94% |
| BCOV | Brightcove | | Technology | 1.67 | 10 | -1.76% | -35.52% |
| SITM | SiTime | | Technology | 78.51 | 20 | -3.82% | -35.69% |
| TPIC | TPI Composites | | Industrials | 2.66 | 35 | 1.92% | -35.75% |
| ATRC | AtriCure | | Health Care | 22.90 | 0 | -4.94% | -35.84% |
| RKLB | Rocket Lab | | Industrials | 3.53 | 0 | -5.36% | -35.93% |
| IKNA | Ikena Oncology | | Health Care | 1.28 | 25 | -3.76% | -36.00% |
| PLSE | Pulse Biosciences | | Health Care | 7.82 | 49 | 8.31% | -36.11% |
| BBIO | BridgeBio Pharma | | Health Care | 25.77 | 10 | -3.95% | -36.17% |
| ADTN | ADTRAN | | Technology | 4.68 | 10 | -0.85% | -36.24% |
| FCEL | FuelCell Energy | | Industrials | 1.02 | 10 | -7.27% | -36.25% |
| ESCA | Escalade | | Consumer Staples | 12.79 | 10 | -0.93% | -36.34% |
| SFIX | Stitch Fix | | Services & Goods | 2.27 | 15 | -1.73% | -36.41% |
| ACHR | Archer Aviation | | Industrials | 3.89 | 0 | -2.99% | -36.44% |
| AMRC | Ameresco | | Services & Goods | 20.10 | 10 | -3.92% | -36.53% |
| DMRC | Digimarc | | Technology | 22.92 | 10 | -2.18% | -36.54% |
| LESL | Leslies | | Services & Goods | 4.38 | 17 | -4.58% | -36.71% |
| LVWR | LiveWire Group | | Services & Goods | 7.36 | 45 | 0.27% | -36.77% |
| GTN | Gray Television | | Services & Goods | 5.66 | 27 | 1.80% | -36.83% |
| EXTR | Extreme s | | Technology | 11.13 | 50 | 0.54% | -36.90% |
| GH | Guardant Health | | Health Care | 17.06 | 20 | -8.67% | -36.93% |
| COUR | Coursera | | Consumer Staples | 12.40 | 10 | -5.34% | -36.94% |
| AKTS | Akoustis | | Technology | 0.53 | 10 | -8.32% | -37.00% |
| KRNY | Kearny Financial | | Financials | 5.63 | 25 | -3.10% | -37.24% |
| QTRX | Quanterix | | Health Care | 17.15 | 0 | -6.64% | -37.27% |


| Too many stocks? View smallcap stocks filtered by marketcap & sector |
| Marketcap: All SmallCap Stocks (default-no microcap), Large, Mid-Range, Small |
| Smallcap Sector: Tech, Finance, Energy, Staples, Retail, Industrial, Materials, & Medical |
|
Get the most comprehensive stock market coverage daily at 12Stocks.com ➞ Best Stocks Today ➞ Best Stocks Weekly ➞ Best Stocks Year-to-Date ➞ Best Stocks Trends ➞  Best Stocks Today 12Stocks.com Best Nasdaq Stocks ➞ Best S&P 500 Stocks ➞ Best Tech Stocks ➞ Best Biotech Stocks ➞ |
| Detailed Overview of SmallCap Stocks |
| SmallCap Technical Overview, Leaders & Laggards, Top SmallCap ETF Funds & Detailed SmallCap Stocks List, Charts, Trends & More |
| Smallcap: Technical Analysis, Trends & YTD Performance | |
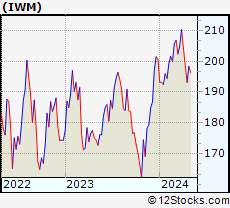
| SmallCap segment as represented by
IWM, an exchange-traded fund [ETF], holds basket of thousands of smallcap stocks from across all major sectors of the US stock market. The smallcap index (contains stocks like Riverbed & Sotheby's) is down by -2.46% and is currently underperforming the overall market by -7.8% year-to-date. Below is a quick view of technical charts and trends: | |
 IWM Weekly Chart |
|
| Long Term Trend: Good | |
| Medium Term Trend: Not Good | |
 IWM Daily Chart |
|
| Short Term Trend: Not Good | |
| Overall Trend Score: 26 | |
| YTD Performance: -2.46% | |
| **Trend Scores & Views Are Only For Educational Purposes And Not For Investing | |
| 12Stocks.com: Top Performing Small Cap Index Stocks | ||||||||||||||||||||||||||||||||||||||||||||||||
 The top performing Small Cap Index stocks year to date are
Now, more recently, over last week, the top performing Small Cap Index stocks on the move are


|
||||||||||||||||||||||||||||||||||||||||||||||||
| 12Stocks.com: Investing in Smallcap Index using Exchange Traded Funds | |
|
The following table shows list of key exchange traded funds (ETF) that
help investors track Smallcap index. The following list also includes leveraged ETF funds that track twice or thrice the daily returns of Smallcap indices. Short or inverse ETF funds move in the opposite direction to the index they track and are useful during market pullbacks or during bear markets. Quick View: Move mouse or cursor over ETF symbol (ticker) to view short-term technical chart and over ETF name to view long term chart. Click on ticker or stock name for detailed view. Click on to add stock symbol to your watchlist and to view watchlist. |
12Stocks.com List of ETFs that track Smallcap Index
| Ticker | ETF Name | Watchlist | Recent Price | Smart Investing & Trading Score | Change % | Week % | Year-to-date % |
| IWM | iShares Russell 2000 | | 195.78 | 26 | -1.46 | -1.46 | -2.46% |
| IJR | iShares Core S&P Small-Cap | | 103.54 | 13 | -0.93 | -0.93 | -4.35% |
| VTWO | Vanguard Russell 2000 ETF | | 79.23 | 26 | -1.36 | -1.36 | -2.31% |
| IWN | iShares Russell 2000 Value | | 148.60 | 18 | -1.18 | -1.18 | -4.33% |
| IWO | iShares Russell 2000 Growth | | 251.04 | 26 | -1.69 | -1.69 | -0.47% |
| IJS | iShares S&P Small-Cap 600 Value | | 95.20 | 0 | -1.01 | -1.01 | -7.64% |
| IJT | iShares S&P Small-Cap 600 Growth | | 123.52 | 31 | -1.01 | -1.01 | -1.29% |
| XSLV | PowerShares S&P SmallCap Low Volatil ETF | | 41.88 | 0 | -0.50 | -0.5 | -5.14% |
| SDD | ProShares UltraShort SmallCap600 | | 20.23 | 100 | 2.01 | 2.01 | 9.79% |
| SAA | ProShares Ultra SmallCap600 | | 22.43 | 0 | -0.58 | -0.58 | -10.1% |
| SBB | ProShares Short SmallCap600 | | 16.41 | 52 | -0.83 | -0.83 | 3.01% |
| SMLV | SPDR SSGA US Small Cap Low Volatil ETF | | 104.73 | 8 | -0.27 | -0.27 | -6.92% |
| 12Stocks.com: Charts, Trends, Fundamental Data and Performances of SmallCap Stocks | |
|
We now take in-depth look at all SmallCap stocks including charts, multi-period performances and overall trends (as measured by Smart Investing & Trading Score). One can sort SmallCap stocks (click link to choose) by Daily, Weekly and by Year-to-Date performances. Also, one can sort by size of the company or by market capitalization. |
| Select Your Default Chart Type: | |||||
| |||||
| Click on stock symbol or name for detailed view. Click on to add stock symbol to your watchlist and to view watchlist. Quick View: Move mouse or cursor over "Daily" to quickly view daily technical stock chart and over "Weekly" to view weekly technical stock chart. | |||||

 | ACRE Ares Commercial Real Estate Corporation |
| Sector: Financials | |
| SubSector: Mortgage Investment | |
| MarketCap: 242.339 Millions | |
| Recent Price: 6.74 Smart Investing & Trading Score: 10 | |
| Day Percent Change: -3.99% Day Change: -0.28 | |
| Week Change: -3.99% Year-to-date Change: -34.9% | |
| ACRE Links: Profile News Message Board | |
| Charts:- Daily , Weekly | |
| Add ACRE to Watchlist: View: Get Complete ACRE Trend Analysis ➞ | |
 | BCOV Brightcove Inc. |
| Sector: Technology | |
| SubSector: Application Software | |
| MarketCap: 266.162 Millions | |
| Recent Price: 1.67 Smart Investing & Trading Score: 10 | |
| Day Percent Change: -1.76% Day Change: -0.03 | |
| Week Change: -1.76% Year-to-date Change: -35.5% | |
| BCOV Links: Profile News Message Board | |
| Charts:- Daily , Weekly | |
| Add BCOV to Watchlist: View: Get Complete BCOV Trend Analysis ➞ | |
 | SITM SiTime Corporation |
| Sector: Technology | |
| SubSector: Semiconductor - Specialized | |
| MarketCap: 403.76 Millions | |
| Recent Price: 78.51 Smart Investing & Trading Score: 20 | |
| Day Percent Change: -3.82% Day Change: -3.12 | |
| Week Change: -3.82% Year-to-date Change: -35.7% | |
| SITM Links: Profile News Message Board | |
| Charts:- Daily , Weekly | |
| Add SITM to Watchlist: View: Get Complete SITM Trend Analysis ➞ | |
 | TPIC TPI Composites, Inc. |
| Sector: Industrials | |
| SubSector: Diversified Machinery | |
| MarketCap: 451.016 Millions | |
| Recent Price: 2.66 Smart Investing & Trading Score: 35 | |
| Day Percent Change: 1.92% Day Change: 0.05 | |
| Week Change: 1.92% Year-to-date Change: -35.8% | |
| TPIC Links: Profile News Message Board | |
| Charts:- Daily , Weekly | |
| Add TPIC to Watchlist: View: Get Complete TPIC Trend Analysis ➞ | |
 | ATRC AtriCure, Inc. |
| Sector: Health Care | |
| SubSector: Medical Instruments & Supplies | |
| MarketCap: 1158.7 Millions | |
| Recent Price: 22.90 Smart Investing & Trading Score: 0 | |
| Day Percent Change: -4.94% Day Change: -1.19 | |
| Week Change: -4.94% Year-to-date Change: -35.8% | |
| ATRC Links: Profile News Message Board | |
| Charts:- Daily , Weekly | |
| Add ATRC to Watchlist: View: Get Complete ATRC Trend Analysis ➞ | |
 | RKLB Rocket Lab USA, Inc. |
| Sector: Industrials | |
| SubSector: Aerospace & Defense | |
| MarketCap: 2820 Millions | |
| Recent Price: 3.53 Smart Investing & Trading Score: 0 | |
| Day Percent Change: -5.36% Day Change: -0.20 | |
| Week Change: -5.36% Year-to-date Change: -35.9% | |
| RKLB Links: Profile News Message Board | |
| Charts:- Daily , Weekly | |
| Add RKLB to Watchlist: View: Get Complete RKLB Trend Analysis ➞ | |
 | IKNA Ikena Oncology, Inc. |
| Sector: Health Care | |
| SubSector: Biotechnology | |
| MarketCap: 277 Millions | |
| Recent Price: 1.28 Smart Investing & Trading Score: 25 | |
| Day Percent Change: -3.76% Day Change: -0.05 | |
| Week Change: -3.76% Year-to-date Change: -36.0% | |
| IKNA Links: Profile News Message Board | |
| Charts:- Daily , Weekly | |
| Add IKNA to Watchlist: View: Get Complete IKNA Trend Analysis ➞ | |
 | PLSE Pulse Biosciences, Inc. |
| Sector: Health Care | |
| SubSector: Medical Instruments & Supplies | |
| MarketCap: 131.96 Millions | |
| Recent Price: 7.82 Smart Investing & Trading Score: 49 | |
| Day Percent Change: 8.31% Day Change: 0.60 | |
| Week Change: 8.31% Year-to-date Change: -36.1% | |
| PLSE Links: Profile News Message Board | |
| Charts:- Daily , Weekly | |
| Add PLSE to Watchlist: View: Get Complete PLSE Trend Analysis ➞ | |
 | BBIO BridgeBio Pharma, Inc. |
| Sector: Health Care | |
| SubSector: Biotechnology | |
| MarketCap: 3879.35 Millions | |
| Recent Price: 25.77 Smart Investing & Trading Score: 10 | |
| Day Percent Change: -3.95% Day Change: -1.06 | |
| Week Change: -3.95% Year-to-date Change: -36.2% | |
| BBIO Links: Profile News Message Board | |
| Charts:- Daily , Weekly | |
| Add BBIO to Watchlist: View: Get Complete BBIO Trend Analysis ➞ | |
 | ADTN ADTRAN, Inc. |
| Sector: Technology | |
| SubSector: Communication Equipment | |
| MarketCap: 303.539 Millions | |
| Recent Price: 4.68 Smart Investing & Trading Score: 10 | |
| Day Percent Change: -0.85% Day Change: -0.04 | |
| Week Change: -0.85% Year-to-date Change: -36.2% | |
| ADTN Links: Profile News Message Board | |
| Charts:- Daily , Weekly | |
| Add ADTN to Watchlist: View: Get Complete ADTN Trend Analysis ➞ | |
 | FCEL FuelCell Energy, Inc. |
| Sector: Industrials | |
| SubSector: Industrial Electrical Equipment | |
| MarketCap: 347.079 Millions | |
| Recent Price: 1.02 Smart Investing & Trading Score: 10 | |
| Day Percent Change: -7.27% Day Change: -0.08 | |
| Week Change: -7.27% Year-to-date Change: -36.3% | |
| FCEL Links: Profile News Message Board | |
| Charts:- Daily , Weekly | |
| Add FCEL to Watchlist: View: Get Complete FCEL Trend Analysis ➞ | |
 | ESCA Escalade, Incorporated |
| Sector: Consumer Staples | |
| SubSector: Sporting Goods | |
| MarketCap: 87.8144 Millions | |
| Recent Price: 12.79 Smart Investing & Trading Score: 10 | |
| Day Percent Change: -0.93% Day Change: -0.12 | |
| Week Change: -0.93% Year-to-date Change: -36.3% | |
| ESCA Links: Profile News Message Board | |
| Charts:- Daily , Weekly | |
| Add ESCA to Watchlist: View: Get Complete ESCA Trend Analysis ➞ | |
 | SFIX Stitch Fix, Inc. |
| Sector: Services & Goods | |
| SubSector: Specialty Retail, Other | |
| MarketCap: 1693.64 Millions | |
| Recent Price: 2.27 Smart Investing & Trading Score: 15 | |
| Day Percent Change: -1.73% Day Change: -0.04 | |
| Week Change: -1.73% Year-to-date Change: -36.4% | |
| SFIX Links: Profile News Message Board | |
| Charts:- Daily , Weekly | |
| Add SFIX to Watchlist: View: Get Complete SFIX Trend Analysis ➞ | |
 | ACHR Archer Aviation Inc. |
| Sector: Industrials | |
| SubSector: Aerospace & Defense | |
| MarketCap: 976 Millions | |
| Recent Price: 3.89 Smart Investing & Trading Score: 0 | |
| Day Percent Change: -2.99% Day Change: -0.12 | |
| Week Change: -2.99% Year-to-date Change: -36.4% | |
| ACHR Links: Profile News Message Board | |
| Charts:- Daily , Weekly | |
| Add ACHR to Watchlist: View: Get Complete ACHR Trend Analysis ➞ | |
 | AMRC Ameresco, Inc. |
| Sector: Services & Goods | |
| SubSector: Technical Services | |
| MarketCap: 898.91 Millions | |
| Recent Price: 20.10 Smart Investing & Trading Score: 10 | |
| Day Percent Change: -3.92% Day Change: -0.82 | |
| Week Change: -3.92% Year-to-date Change: -36.5% | |
| AMRC Links: Profile News Message Board | |
| Charts:- Daily , Weekly | |
| Add AMRC to Watchlist: View: Get Complete AMRC Trend Analysis ➞ | |
 | DMRC Digimarc Corporation |
| Sector: Technology | |
| SubSector: Information Technology Services | |
| MarketCap: 222.268 Millions | |
| Recent Price: 22.92 Smart Investing & Trading Score: 10 | |
| Day Percent Change: -2.18% Day Change: -0.51 | |
| Week Change: -2.18% Year-to-date Change: -36.5% | |
| DMRC Links: Profile News Message Board | |
| Charts:- Daily , Weekly | |
| Add DMRC to Watchlist: View: Get Complete DMRC Trend Analysis ➞ | |
 | LESL Leslies, Inc. |
| Sector: Services & Goods | |
| SubSector: Home Improvement Retail | |
| MarketCap: 37927 Millions | |
| Recent Price: 4.38 Smart Investing & Trading Score: 17 | |
| Day Percent Change: -4.58% Day Change: -0.21 | |
| Week Change: -4.58% Year-to-date Change: -36.7% | |
| LESL Links: Profile News Message Board | |
| Charts:- Daily , Weekly | |
| Add LESL to Watchlist: View: Get Complete LESL Trend Analysis ➞ | |
 | LVWR LiveWire Group, Inc. |
| Sector: Services & Goods | |
| SubSector: Auto Manufacturers | |
| MarketCap: 2400 Millions | |
| Recent Price: 7.36 Smart Investing & Trading Score: 45 | |
| Day Percent Change: 0.27% Day Change: 0.02 | |
| Week Change: 0.27% Year-to-date Change: -36.8% | |
| LVWR Links: Profile News Message Board | |
| Charts:- Daily , Weekly | |
| Add LVWR to Watchlist: View: Get Complete LVWR Trend Analysis ➞ | |
 | GTN Gray Television, Inc. |
| Sector: Services & Goods | |
| SubSector: Broadcasting - TV | |
| MarketCap: 1144.63 Millions | |
| Recent Price: 5.66 Smart Investing & Trading Score: 27 | |
| Day Percent Change: 1.80% Day Change: 0.10 | |
| Week Change: 1.8% Year-to-date Change: -36.8% | |
| GTN Links: Profile News Message Board | |
| Charts:- Daily , Weekly | |
| Add GTN to Watchlist: View: Get Complete GTN Trend Analysis ➞ | |
 | EXTR Extreme Networks, Inc. |
| Sector: Technology | |
| SubSector: Communication Equipment | |
| MarketCap: 339.939 Millions | |
| Recent Price: 11.13 Smart Investing & Trading Score: 50 | |
| Day Percent Change: 0.54% Day Change: 0.06 | |
| Week Change: 0.54% Year-to-date Change: -36.9% | |
| EXTR Links: Profile News Message Board | |
| Charts:- Daily , Weekly | |
| Add EXTR to Watchlist: View: Get Complete EXTR Trend Analysis ➞ | |
 | GH Guardant Health, Inc. |
| Sector: Health Care | |
| SubSector: Medical Laboratories & Research | |
| MarketCap: 5678.7 Millions | |
| Recent Price: 17.06 Smart Investing & Trading Score: 20 | |
| Day Percent Change: -8.67% Day Change: -1.62 | |
| Week Change: -8.67% Year-to-date Change: -36.9% | |
| GH Links: Profile News Message Board | |
| Charts:- Daily , Weekly | |
| Add GH to Watchlist: View: Get Complete GH Trend Analysis ➞ | |
 | COUR Coursera, Inc. |
| Sector: Consumer Staples | |
| SubSector: Education & Training Services | |
| MarketCap: 1990 Millions | |
| Recent Price: 12.40 Smart Investing & Trading Score: 10 | |
| Day Percent Change: -5.34% Day Change: -0.70 | |
| Week Change: -5.34% Year-to-date Change: -36.9% | |
| COUR Links: Profile News Message Board | |
| Charts:- Daily , Weekly | |
| Add COUR to Watchlist: View: Get Complete COUR Trend Analysis ➞ | |
 | AKTS Akoustis Technologies, Inc. |
| Sector: Technology | |
| SubSector: Communication Equipment | |
| MarketCap: 197.039 Millions | |
| Recent Price: 0.53 Smart Investing & Trading Score: 10 | |
| Day Percent Change: -8.32% Day Change: -0.05 | |
| Week Change: -8.32% Year-to-date Change: -37.0% | |
| AKTS Links: Profile News Message Board | |
| Charts:- Daily , Weekly | |
| Add AKTS to Watchlist: View: Get Complete AKTS Trend Analysis ➞ | |
 | KRNY Kearny Financial Corp. |
| Sector: Financials | |
| SubSector: Savings & Loans | |
| MarketCap: 781.73 Millions | |
| Recent Price: 5.63 Smart Investing & Trading Score: 25 | |
| Day Percent Change: -3.10% Day Change: -0.18 | |
| Week Change: -3.1% Year-to-date Change: -37.2% | |
| KRNY Links: Profile News Message Board | |
| Charts:- Daily , Weekly | |
| Add KRNY to Watchlist: View: Get Complete KRNY Trend Analysis ➞ | |
 | QTRX Quanterix Corporation |
| Sector: Health Care | |
| SubSector: Biotechnology | |
| MarketCap: 448.685 Millions | |
| Recent Price: 17.15 Smart Investing & Trading Score: 0 | |
| Day Percent Change: -6.64% Day Change: -1.22 | |
| Week Change: -6.64% Year-to-date Change: -37.3% | |
| QTRX Links: Profile News Message Board | |
| Charts:- Daily , Weekly | |
| Add QTRX to Watchlist: View: Get Complete QTRX Trend Analysis ➞ | |
| Too many stocks? View smallcap stocks filtered by marketcap & sector |
| Marketcap: All SmallCap Stocks (default-no microcap), Large, Mid-Range, Small & MicroCap |
| Sector: Tech, Finance, Energy, Staples, Retail, Industrial, Materials, Utilities & Medical |
|
Best Stocks Today 12Stocks.com |
© 2024 12Stocks.com Terms & Conditions Privacy Contact Us
All Information Provided Only For Education And Not To Be Used For Investing or Trading. See Terms & Conditions


One More Thing ... Get Best Stocks Delivered Daily!
Never Ever Miss A Move With Our Top Ten Stocks Lists
Find Best Stocks In Any Market - Bull or Bear Market
Take A Peek At Our Top Ten Stocks Lists: Daily, Weekly, Year-to-Date & Top Trends
Find Best Stocks In Any Market - Bull or Bear Market
Take A Peek At Our Top Ten Stocks Lists: Daily, Weekly, Year-to-Date & Top Trends
Smallcap Stocks With Best Up Trends [0-bearish to 100-bullish]: Snap One[100], ProKidney [100], SES AI[100], Encore Wire[100], Century Aluminum[100], Core Molding[100], Theravance Biopharma[100], Acadia Realty[100], Prelude [100], Alpine Immune[100], Argan [100]
Best Smallcap Stocks Year-to-Date:
CareMax [570.1%], Janux [382.64%], Viking [259.81%], Alpine Immune[238.34%], Arcutis Bio[212.38%], Super Micro[210.54%], Vera [200.58%], Longboard [198.69%], Avidity Biosciences[164.49%], Veritone [151.1%], Stoke [132.13%] Best Smallcap Stocks This Week:
Snap One[29.48%], ProKidney [19.43%], Piedmont Lithium[15.77%], SES AI[15.44%], Eagle [13.29%], Encore Wire[11.59%], ESSA Bancorp[8.88%], Benson Hill[8.4%], Pulse Biosciences[8.31%], Century Aluminum[7.71%], Core Molding[7.45%] Best Smallcap Stocks Daily:
Snap One[29.48%], ProKidney [19.43%], Piedmont Lithium[15.77%], SES AI[15.44%], Eagle [13.29%], Encore Wire[11.59%], ESSA Bancorp[8.88%], Benson Hill[8.40%], Pulse Biosciences[8.31%], Century Aluminum[7.71%], Core Molding[7.45%]