
 Login Sign Up


| |||||
 |  | ||||

| 12Stocks.com Market Intelligence |
Best SmallCap Stocks
|
| In a hurry? Small Cap Stock Lists: Performance Trends Table, Stock Charts
Sort Small Cap stocks: Daily, Weekly, Year-to-Date, Market Cap & Trends. Filter Small Cap stocks list by sector: Show all, Tech, Finance, Energy, Staples, Retail, Industrial, Materials, Utilities and HealthCare Filter Small Cap stocks list by size: All Large Medium Small and MicroCap |
| 12Stocks.com Small Cap Stocks Performances & Trends Daily | |||||||||
|
|  The overall Smart Investing & Trading Score is 23 (0-bearish to 100-bullish) which puts Small Cap index in short term bearish to neutral trend. The Smart Investing & Trading Score from previous trading session is 13 and an improvement of trend continues.
| ||||||||
Here are the Smart Investing & Trading Scores of the most requested small cap stocks at 12Stocks.com (click stock name for detailed review):
|


| 12Stocks.com: Investing in Smallcap Index with Stocks | |
|
The following table helps investors and traders sort through current performance and trends (as measured by Smart Investing & Trading Score) of various
stocks in the Smallcap Index. Quick View: Move mouse or cursor over stock symbol (ticker) to view short-term technical chart and over stock name to view long term chart. Click on  to add stock symbol to your watchlist and to add stock symbol to your watchlist and  to view watchlist. Click on any ticker or stock name for detailed market intelligence report for that stock. to view watchlist. Click on any ticker or stock name for detailed market intelligence report for that stock. |
12Stocks.com Performance of Stocks in Smallcap Index
| Ticker | Stock Name | Watchlist | Category | Recent Price | Smart Investing & Trading Score | Change % | YTD Change% |
| NKTX | Nkarta |   | Health Care | 7.50 | 10 | -3.60% | 13.72% |
| MTDR | Matador Resources | | Energy | 64.61 | 46 | -0.20% | 13.63% |
| SNPO | Snap One | | Technology | 10.55 | 81 | -0.09% | 13.56% |
| OSG | Overseas Shipholding | | Transports | 5.98 | 25 | 0.84% | 13.47% |
| SLCA | U.S. Silica | | Materials | 12.82 | 69 | 1.10% | 13.35% |
| SLDP | Solid Power | | Industrials | 1.62 | 42 | 0.00% | 13.33% |
| NX | Quanex Building | | Industrials | 34.64 | 36 | 1.17% | 13.31% |
| COLL | Collegium Pharmaceutical | | Health Care | 34.85 | 36 | 0.23% | 13.22% |
| TNK | Teekay Tankers | | Transports | 56.53 | 0 | 1.82% | 13.13% |
| UFCS | United Fire | | Financials | 22.76 | 100 | 3.31% | 13.12% |
| GCI | Gannett Co | | Services & Goods | 2.60 | 100 | 4.00% | 13.04% |
| ACVA | ACV Auctions | | Services & Goods | 17.00 | 26 | -5.61% | 12.88% |
| TSQ | Townsquare Media | | Services & Goods | 11.91 | 56 | -0.83% | 12.78% |
| DGII | Digi | | Technology | 29.32 | 46 | -0.95% | 12.77% |
| ASC | Ardmore Shipping | | Transports | 15.88 | 17 | 1.86% | 12.70% |
| SFL | SFL | | Transports | 12.71 | 51 | 2.01% | 12.68% |
| EPAC | Enerpac Tool | | Industrials | 35.02 | 56 | 0.78% | 12.64% |
| GRNT | Granite Ridge | | Energy | 6.79 | 88 | 0.15% | 12.60% |
| EIG | Employers | | Financials | 44.36 | 68 | 2.92% | 12.59% |
| TREE | LendingTree | | Financials | 34.12 | 49 | -0.47% | 12.53% |
| SANM | Sanmina | | Technology | 57.79 | 35 | -0.74% | 12.50% |
| DM | Dominion Midstream | | Energy | 0.84 | 32 | 2.09% | 12.46% |
| BTMD | biote | | Health Care | 5.57 | 26 | -0.18% | 12.30% |
| LANC | Lancaster Colony | | Consumer Staples | 186.60 | 43 | 1.62% | 12.15% |
| CSWI | CSW Industrials | | Industrials | 232.19 | 46 | -0.77% | 11.95% |


| Too many stocks? View smallcap stocks filtered by marketcap & sector |
| Marketcap: All SmallCap Stocks (default-no microcap), Large, Mid-Range, Small |
| Smallcap Sector: Tech, Finance, Energy, Staples, Retail, Industrial, Materials, & Medical |
|
Get the most comprehensive stock market coverage daily at 12Stocks.com ➞ Best Stocks Today ➞ Best Stocks Weekly ➞ Best Stocks Year-to-Date ➞ Best Stocks Trends ➞  Best Stocks Today 12Stocks.com Best Nasdaq Stocks ➞ Best S&P 500 Stocks ➞ Best Tech Stocks ➞ Best Biotech Stocks ➞ |
| Detailed Overview of SmallCap Stocks |
| SmallCap Technical Overview, Leaders & Laggards, Top SmallCap ETF Funds & Detailed SmallCap Stocks List, Charts, Trends & More |
| Smallcap: Technical Analysis, Trends & YTD Performance | |
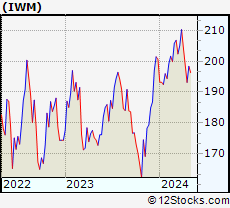
| SmallCap segment as represented by
IWM, an exchange-traded fund [ETF], holds basket of thousands of smallcap stocks from across all major sectors of the US stock market. The smallcap index (contains stocks like Riverbed & Sotheby's) is down by -3.77% and is currently underperforming the overall market by -7.15% year-to-date. Below is a quick view of technical charts and trends: | |
 IWM Weekly Chart |
|
| Long Term Trend: Not Good | |
| Medium Term Trend: Not Good | |
 IWM Daily Chart |
|
| Short Term Trend: Not Good | |
| Overall Trend Score: 23 | |
| YTD Performance: -3.77% | |
| **Trend Scores & Views Are Only For Educational Purposes And Not For Investing | |
| 12Stocks.com: Top Performing Small Cap Index Stocks | ||||||||||||||||||||||||||||||||||||||||||||||||
 The top performing Small Cap Index stocks year to date are
Now, more recently, over last week, the top performing Small Cap Index stocks on the move are


|
||||||||||||||||||||||||||||||||||||||||||||||||
| 12Stocks.com: Investing in Smallcap Index using Exchange Traded Funds | |
|
The following table shows list of key exchange traded funds (ETF) that
help investors track Smallcap index. The following list also includes leveraged ETF funds that track twice or thrice the daily returns of Smallcap indices. Short or inverse ETF funds move in the opposite direction to the index they track and are useful during market pullbacks or during bear markets. Quick View: Move mouse or cursor over ETF symbol (ticker) to view short-term technical chart and over ETF name to view long term chart. Click on ticker or stock name for detailed view. Click on to add stock symbol to your watchlist and to view watchlist. |
12Stocks.com List of ETFs that track Smallcap Index
| Ticker | ETF Name | Watchlist | Recent Price | Smart Investing & Trading Score | Change % | Week % | Year-to-date % |
| IWM | iShares Russell 2000 | | 193.14 | 23 | 0.16 | -2.79 | -3.77% |
| IJR | iShares Core S&P Small-Cap | | 103.22 | 10 | 0.86 | -1.23 | -4.65% |
| IWN | iShares Russell 2000 Value | | 147.78 | 10 | 0.99 | -1.73 | -4.86% |
| VTWO | Vanguard Russell 2000 ETF | | 78.06 | 23 | 0.14 | -2.81 | -3.75% |
| IWO | iShares Russell 2000 Growth | | 245.29 | 36 | -0.67 | -3.94 | -2.75% |
| IJS | iShares S&P Small-Cap 600 Value | | 95.61 | 17 | 1.16 | -0.58 | -7.24% |
| IJT | iShares S&P Small-Cap 600 Growth | | 121.96 | 23 | 0.32 | -2.26 | -2.54% |
| XSLV | PowerShares S&P SmallCap Low Volatil ETF | | 42.30 | 17 | 1.56 | 0.5 | -4.19% |
| SAA | ProShares Ultra SmallCap600 | | 21.80 | 18 | 0.83 | -3.37 | -12.63% |
| SMLV | SPDR SSGA US Small Cap Low Volatil ETF | | 106.09 | 32 | 2.18 | 1.03 | -5.71% |
| SDD | ProShares UltraShort SmallCap600 | | 20.34 | 76 | -1.69 | 2.57 | 10.38% |
| SBB | ProShares Short SmallCap600 | | 16.84 | 76 | -0.82 | 1.77 | 5.71% |
| 12Stocks.com: Charts, Trends, Fundamental Data and Performances of SmallCap Stocks | |
|
We now take in-depth look at all SmallCap stocks including charts, multi-period performances and overall trends (as measured by Smart Investing & Trading Score). One can sort SmallCap stocks (click link to choose) by Daily, Weekly and by Year-to-Date performances. Also, one can sort by size of the company or by market capitalization. |
| Select Your Default Chart Type: | |||||
| |||||
| Click on stock symbol or name for detailed view. Click on to add stock symbol to your watchlist and to view watchlist. Quick View: Move mouse or cursor over "Daily" to quickly view daily technical stock chart and over "Weekly" to view weekly technical stock chart. | |||||

 | NKTX Nkarta, Inc. |
| Sector: Health Care | |
| SubSector: Biotechnology | |
| MarketCap: 23487 Millions | |
| Recent Price: 7.50 Smart Investing & Trading Score: 10 | |
| Day Percent Change: -3.60% Day Change: -0.28 | |
| Week Change: -14.19% Year-to-date Change: 13.7% | |
| NKTX Links: Profile News Message Board | |
| Charts:- Daily , Weekly | |
| Add NKTX to Watchlist: View: Get Complete NKTX Trend Analysis ➞ | |
 | MTDR Matador Resources Company |
| Sector: Energy | |
| SubSector: Independent Oil & Gas | |
| MarketCap: 196.593 Millions | |
| Recent Price: 64.61 Smart Investing & Trading Score: 46 | |
| Day Percent Change: -0.20% Day Change: -0.13 | |
| Week Change: -5.72% Year-to-date Change: 13.6% | |
| MTDR Links: Profile News Message Board | |
| Charts:- Daily , Weekly | |
| Add MTDR to Watchlist: View: Get Complete MTDR Trend Analysis ➞ | |
 | SNPO Snap One Holdings Corp. |
| Sector: Technology | |
| SubSector: Electronics & Computer Distribution | |
| MarketCap: 807 Millions | |
| Recent Price: 10.55 Smart Investing & Trading Score: 81 | |
| Day Percent Change: -0.09% Day Change: -0.01 | |
| Week Change: 29.61% Year-to-date Change: 13.6% | |
| SNPO Links: Profile News Message Board | |
| Charts:- Daily , Weekly | |
| Add SNPO to Watchlist: View: Get Complete SNPO Trend Analysis ➞ | |
 | OSG Overseas Shipholding Group, Inc. |
| Sector: Transports | |
| SubSector: Shipping | |
| MarketCap: 184.814 Millions | |
| Recent Price: 5.98 Smart Investing & Trading Score: 25 | |
| Day Percent Change: 0.84% Day Change: 0.05 | |
| Week Change: 0.17% Year-to-date Change: 13.5% | |
| OSG Links: Profile News Message Board | |
| Charts:- Daily , Weekly | |
| Add OSG to Watchlist: View: Get Complete OSG Trend Analysis ➞ | |
 | SLCA U.S. Silica Holdings, Inc. |
| Sector: Materials | |
| SubSector: Industrial Metals & Minerals | |
| MarketCap: 93 Millions | |
| Recent Price: 12.82 Smart Investing & Trading Score: 69 | |
| Day Percent Change: 1.10% Day Change: 0.14 | |
| Week Change: -0.62% Year-to-date Change: 13.4% | |
| SLCA Links: Profile News Message Board | |
| Charts:- Daily , Weekly | |
| Add SLCA to Watchlist: View: Get Complete SLCA Trend Analysis ➞ | |
 | SLDP Solid Power, Inc. |
| Sector: Industrials | |
| SubSector: Electrical Equipment & Parts | |
| MarketCap: 445 Millions | |
| Recent Price: 1.62 Smart Investing & Trading Score: 42 | |
| Day Percent Change: 0.00% Day Change: 0.00 | |
| Week Change: 0.31% Year-to-date Change: 13.3% | |
| SLDP Links: Profile News Message Board | |
| Charts:- Daily , Weekly | |
| Add SLDP to Watchlist: View: Get Complete SLDP Trend Analysis ➞ | |
 | NX Quanex Building Products Corporation |
| Sector: Industrials | |
| SubSector: General Building Materials | |
| MarketCap: 315.453 Millions | |
| Recent Price: 34.64 Smart Investing & Trading Score: 36 | |
| Day Percent Change: 1.17% Day Change: 0.40 | |
| Week Change: -3.43% Year-to-date Change: 13.3% | |
| NX Links: Profile News Message Board | |
| Charts:- Daily , Weekly | |
| Add NX to Watchlist: View: Get Complete NX Trend Analysis ➞ | |
 | COLL Collegium Pharmaceutical, Inc. |
| Sector: Health Care | |
| SubSector: Drugs - Generic | |
| MarketCap: 569.185 Millions | |
| Recent Price: 34.85 Smart Investing & Trading Score: 36 | |
| Day Percent Change: 0.23% Day Change: 0.08 | |
| Week Change: -2.41% Year-to-date Change: 13.2% | |
| COLL Links: Profile News Message Board | |
| Charts:- Daily , Weekly | |
| Add COLL to Watchlist: View: Get Complete COLL Trend Analysis ➞ | |
 | TNK Teekay Tankers Ltd. |
| Sector: Transports | |
| SubSector: Shipping | |
| MarketCap: 584.714 Millions | |
| Recent Price: 56.53 Smart Investing & Trading Score: 0 | |
| Day Percent Change: 1.82% Day Change: 1.01 | |
| Week Change: -1.99% Year-to-date Change: 13.1% | |
| TNK Links: Profile News Message Board | |
| Charts:- Daily , Weekly | |
| Add TNK to Watchlist: View: Get Complete TNK Trend Analysis ➞ | |
 | UFCS United Fire Group, Inc. |
| Sector: Financials | |
| SubSector: Property & Casualty Insurance | |
| MarketCap: 862.812 Millions | |
| Recent Price: 22.76 Smart Investing & Trading Score: 100 | |
| Day Percent Change: 3.31% Day Change: 0.73 | |
| Week Change: 4.55% Year-to-date Change: 13.1% | |
| UFCS Links: Profile News Message Board | |
| Charts:- Daily , Weekly | |
| Add UFCS to Watchlist: View: Get Complete UFCS Trend Analysis ➞ | |
 | GCI Gannett Co., Inc. |
| Sector: Services & Goods | |
| SubSector: Publishing - Newspapers | |
| MarketCap: 222.322 Millions | |
| Recent Price: 2.60 Smart Investing & Trading Score: 100 | |
| Day Percent Change: 4.00% Day Change: 0.10 | |
| Week Change: 9.24% Year-to-date Change: 13.0% | |
| GCI Links: Profile News Message Board | |
| Charts:- Daily , Weekly | |
| Add GCI to Watchlist: View: Get Complete GCI Trend Analysis ➞ | |
 | ACVA ACV Auctions Inc. |
| Sector: Services & Goods | |
| SubSector: Auto & Truck Dealerships | |
| MarketCap: 2680 Millions | |
| Recent Price: 17.00 Smart Investing & Trading Score: 26 | |
| Day Percent Change: -5.61% Day Change: -1.01 | |
| Week Change: -3.95% Year-to-date Change: 12.9% | |
| ACVA Links: Profile News Message Board | |
| Charts:- Daily , Weekly | |
| Add ACVA to Watchlist: View: Get Complete ACVA Trend Analysis ➞ | |
 | TSQ Townsquare Media, Inc. |
| Sector: Services & Goods | |
| SubSector: Broadcasting - Radio | |
| MarketCap: 101.795 Millions | |
| Recent Price: 11.91 Smart Investing & Trading Score: 56 | |
| Day Percent Change: -0.83% Day Change: -0.10 | |
| Week Change: -3.25% Year-to-date Change: 12.8% | |
| TSQ Links: Profile News Message Board | |
| Charts:- Daily , Weekly | |
| Add TSQ to Watchlist: View: Get Complete TSQ Trend Analysis ➞ | |
 | DGII Digi International Inc. |
| Sector: Technology | |
| SubSector: Communication Equipment | |
| MarketCap: 257.339 Millions | |
| Recent Price: 29.32 Smart Investing & Trading Score: 46 | |
| Day Percent Change: -0.95% Day Change: -0.28 | |
| Week Change: -5.14% Year-to-date Change: 12.8% | |
| DGII Links: Profile News Message Board | |
| Charts:- Daily , Weekly | |
| Add DGII to Watchlist: View: Get Complete DGII Trend Analysis ➞ | |
 | ASC Ardmore Shipping Corporation |
| Sector: Transports | |
| SubSector: Shipping | |
| MarketCap: 147.014 Millions | |
| Recent Price: 15.88 Smart Investing & Trading Score: 17 | |
| Day Percent Change: 1.86% Day Change: 0.29 | |
| Week Change: 0% Year-to-date Change: 12.7% | |
| ASC Links: Profile News Message Board | |
| Charts:- Daily , Weekly | |
| Add ASC to Watchlist: View: Get Complete ASC Trend Analysis ➞ | |
 | SFL SFL Corporation Ltd. |
| Sector: Transports | |
| SubSector: Shipping | |
| MarketCap: 890.414 Millions | |
| Recent Price: 12.71 Smart Investing & Trading Score: 51 | |
| Day Percent Change: 2.01% Day Change: 0.25 | |
| Week Change: 1.03% Year-to-date Change: 12.7% | |
| SFL Links: Profile News Message Board | |
| Charts:- Daily , Weekly | |
| Add SFL to Watchlist: View: Get Complete SFL Trend Analysis ➞ | |
 | EPAC Enerpac Tool Group Corp. |
| Sector: Industrials | |
| SubSector: Diversified Machinery | |
| MarketCap: 1044.16 Millions | |
| Recent Price: 35.02 Smart Investing & Trading Score: 56 | |
| Day Percent Change: 0.78% Day Change: 0.27 | |
| Week Change: -0.06% Year-to-date Change: 12.6% | |
| EPAC Links: Profile News Message Board | |
| Charts:- Daily , Weekly | |
| Add EPAC to Watchlist: View: Get Complete EPAC Trend Analysis ➞ | |
 | GRNT Granite Ridge Resources, Inc. |
| Sector: Energy | |
| SubSector: Oil & Gas E&P | |
| MarketCap: 890 Millions | |
| Recent Price: 6.79 Smart Investing & Trading Score: 88 | |
| Day Percent Change: 0.15% Day Change: 0.01 | |
| Week Change: -1.16% Year-to-date Change: 12.6% | |
| GRNT Links: Profile News Message Board | |
| Charts:- Daily , Weekly | |
| Add GRNT to Watchlist: View: Get Complete GRNT Trend Analysis ➞ | |
 | EIG Employers Holdings, Inc. |
| Sector: Financials | |
| SubSector: Accident & Health Insurance | |
| MarketCap: 1202.6 Millions | |
| Recent Price: 44.36 Smart Investing & Trading Score: 68 | |
| Day Percent Change: 2.92% Day Change: 1.26 | |
| Week Change: 4.11% Year-to-date Change: 12.6% | |
| EIG Links: Profile News Message Board | |
| Charts:- Daily , Weekly | |
| Add EIG to Watchlist: View: Get Complete EIG Trend Analysis ➞ | |
 | TREE LendingTree, Inc. |
| Sector: Financials | |
| SubSector: Mortgage Investment | |
| MarketCap: 2745.99 Millions | |
| Recent Price: 34.12 Smart Investing & Trading Score: 49 | |
| Day Percent Change: -0.47% Day Change: -0.16 | |
| Week Change: -9.33% Year-to-date Change: 12.5% | |
| TREE Links: Profile News Message Board | |
| Charts:- Daily , Weekly | |
| Add TREE to Watchlist: View: Get Complete TREE Trend Analysis ➞ | |
 | SANM Sanmina Corporation |
| Sector: Technology | |
| SubSector: Diversified Electronics | |
| MarketCap: 1790.36 Millions | |
| Recent Price: 57.79 Smart Investing & Trading Score: 35 | |
| Day Percent Change: -0.74% Day Change: -0.43 | |
| Week Change: -0.67% Year-to-date Change: 12.5% | |
| SANM Links: Profile News Message Board | |
| Charts:- Daily , Weekly | |
| Add SANM to Watchlist: View: Get Complete SANM Trend Analysis ➞ | |
 | DM Dominion Midstream Partners, LP |
| Sector: Energy | |
| SubSector: Oil & Gas Pipelines | |
| MarketCap: 3017.01 Millions | |
| Recent Price: 0.84 Smart Investing & Trading Score: 32 | |
| Day Percent Change: 2.09% Day Change: 0.02 | |
| Week Change: -11.68% Year-to-date Change: 12.5% | |
| DM Links: Profile News Message Board | |
| Charts:- Daily , Weekly | |
| Add DM to Watchlist: View: Get Complete DM Trend Analysis ➞ | |
 | BTMD biote Corp. |
| Sector: Health Care | |
| SubSector: Medical Care Facilities | |
| MarketCap: 468 Millions | |
| Recent Price: 5.57 Smart Investing & Trading Score: 26 | |
| Day Percent Change: -0.18% Day Change: -0.01 | |
| Week Change: -7.48% Year-to-date Change: 12.3% | |
| BTMD Links: Profile News Message Board | |
| Charts:- Daily , Weekly | |
| Add BTMD to Watchlist: View: Get Complete BTMD Trend Analysis ➞ | |
 | LANC Lancaster Colony Corporation |
| Sector: Consumer Staples | |
| SubSector: Food - Major Diversified | |
| MarketCap: 4060.83 Millions | |
| Recent Price: 186.60 Smart Investing & Trading Score: 43 | |
| Day Percent Change: 1.62% Day Change: 2.98 | |
| Week Change: -4.85% Year-to-date Change: 12.2% | |
| LANC Links: Profile News Message Board | |
| Charts:- Daily , Weekly | |
| Add LANC to Watchlist: View: Get Complete LANC Trend Analysis ➞ | |
 | CSWI CSW Industrials, Inc. |
| Sector: Industrials | |
| SubSector: Diversified Machinery | |
| MarketCap: 985.616 Millions | |
| Recent Price: 232.19 Smart Investing & Trading Score: 46 | |
| Day Percent Change: -0.77% Day Change: -1.79 | |
| Week Change: -1.63% Year-to-date Change: 12.0% | |
| CSWI Links: Profile News Message Board | |
| Charts:- Daily , Weekly | |
| Add CSWI to Watchlist: View: Get Complete CSWI Trend Analysis ➞ | |
| Too many stocks? View smallcap stocks filtered by marketcap & sector |
| Marketcap: All SmallCap Stocks (default-no microcap), Large, Mid-Range, Small & MicroCap |
| Sector: Tech, Finance, Energy, Staples, Retail, Industrial, Materials, Utilities & Medical |
|
Best Stocks Today 12Stocks.com |
© 2024 12Stocks.com Terms & Conditions Privacy Contact Us
All Information Provided Only For Education And Not To Be Used For Investing or Trading. See Terms & Conditions


One More Thing ... Get Best Stocks Delivered Daily!
Never Ever Miss A Move With Our Top Ten Stocks Lists
Find Best Stocks In Any Market - Bull or Bear Market
Take A Peek At Our Top Ten Stocks Lists: Daily, Weekly, Year-to-Date & Top Trends
Find Best Stocks In Any Market - Bull or Bear Market
Take A Peek At Our Top Ten Stocks Lists: Daily, Weekly, Year-to-Date & Top Trends
Smallcap Stocks With Best Up Trends [0-bearish to 100-bullish]: Humacyte [100], Old Second[100], Gannett Co[100], Tejon Ranch[100], Cricut [100], Victory Capital[100], United Fire[100], Century Aluminum[100], Portland General[100], Lantheus [100], Oscar Health[100]
Best Smallcap Stocks Year-to-Date:
Agenus [540.17%], CareMax [423.71%], Janux [336.95%], Viking [240.57%], Alpine Immune[238.94%], Longboard [194.11%], Arcutis Bio[181.42%], Avidity Biosciences[153.65%], Super Micro[151.19%], Vera [138.18%], Stoke [129.66%] Best Smallcap Stocks This Week:
Macatawa Bank[46.82%], Vertex Energy[43.27%], Snap One[29.61%], Vanda [24.03%], Humacyte [23.78%], ALX Oncology[22.49%], ContextLogic [20%], ProKidney [16.57%], Calavo Growers[16.33%], Badger Meter[15.61%], Accolade [13.45%] Best Smallcap Stocks Daily:
Tellurian [28.11%], Origin Materials[20.44%], Metropolitan Bank[18.01%], Vertex Energy[13.74%], Genelux [10.37%], Gevo [10.14%], Riot Blockchain[10.07%], Humacyte [9.86%], Marathon Patent[9.78%], Emergent BioSolutions[9.68%], Fossil Group[9.64%]